Renovated Office
For Sale
$4,000,000
538 Jefferson St, Lafayette, LA 70501
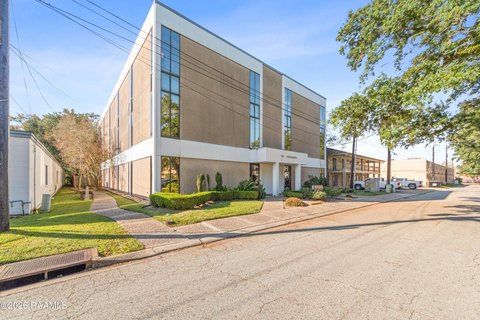
Two-level office property pairs exposed brick character with Class A finishes, collaborative rooms, and substantial open workspace.
Property Size24,850 SF
Price / SF$160.97
Days on Market73
Property Features for 538 Jefferson St
General Information
Standard status
Active
Size
24,850 SF
Additional Details
Utilities to Site
Yes
Sprinkler System
Yes
Amenities
full kitchen
conference rooms
meeting and training rooms
rooftop deck
high-speed internet and fiber wiring
heavy electrical capacity
Building Details
Buildings
1
Stories
2
Building Size
24,850 SF
Construction
brick
Listing Agency:
Keaty Real Estate Team
Listed By:
James Keaty · License #30974
(337) 235-7770
Source:
Athomerealtyla
Added: Aug 5
Changed: Oct 14
Last Checked: Oct 7 at 4:51PM
Displayed information is deemed reliable but is not guaranteed and should be independently verified. All listing content including descriptions, pricing, images are the copyrighted material of Keaty Real Estate Team

Ask AI about this property
Review the available facts, identify missing information and prepare questions for the agent.
Investment Insights
Based on property information with market context.
This approximately 24,850-square-foot office building spans two floors and combines exposed brick walls with renovated Class A finishes. The first floor includes a full kitchen, conference and training rooms, multiple restrooms, and expansive open workspace. The upper level is largely open, with plumbing already installed for future build-out or continued storage use. A rooftop deck adds an outdoor amenity, and approved plans may allow expansion of that area.
The property is at 538 Jefferson St in downtown Lafayette, directly across from the Vermilion parking garage entrance through the park. It is located within the Historic Downtown District, Downtown Economic Development Zone, and designated Opportunity Zone 2.0, effective 2027.
Building infrastructure includes heavy electrical capacity, high-speed internet with fiber wiring, and fire sprinkler systems throughout. The layout is designed to accommodate a headquarters operation with room for up to 200+ employees.
The property is at 538 Jefferson St in downtown Lafayette, directly across from the Vermilion parking garage entrance through the park. It is located within the Historic Downtown District, Downtown Economic Development Zone, and designated Opportunity Zone 2.0, effective 2027.
Building infrastructure includes heavy electrical capacity, high-speed internet with fiber wiring, and fire sprinkler systems throughout. The layout is designed to accommodate a headquarters operation with room for up to 200+ employees.
Key Highlights
- Approximately 24,850 total square feet across two floors
- Renovated Class A office finishes with exposed brick walls
- Full kitchen, conference rooms, training rooms, and multiple restrooms
Financial Insights
Estimated NOI and Cap Rate
NOI / Yr
$289,179
Cap Rate
7.23%
Suggested Prices Based on Cap Rates
Cap Rate 5%
$5,783,580
$5.8M
Cap Rate 7%
$4,131,129
$4.1M
Cap Rate 9%
$3,213,100
$3.2M
Market Conditions
NOI Build-Up for 24,850 SF
Gross rent
$447.3K $18.00/SF
− Vacancy
−$61.7K −$2.48/SF
EGI
$385.6K $15.52/SF
− OpEx
−$96.4K −$3.88/SF
NOI
$289.2K $11.64/SF
Area
Lafayette, LA
Vacancy
13.80%
Lease Rate
$18.00 /SF/Yr
Expense Ratio
25.00%
Simulate Cap Rate and NOI
Suggested Prices Based on Cap Rates
Cap Rate 5%
$5,783,580
Cap Rate 7%
$4,131,129
Cap Rate 9%
$3,213,100
Alternative Uses
Best Use
Office B
$4.13M
$3.61M – $4.82M
NOI $289,179 @ 7.0% cap · market cap 7.23%
Second Best
—
—
no second resolved use
Theoretical Best
Office A
$5.88M
$5.14M – $6.85M
NOI $411,277 @ 7.0% cap · market cap 10.28%
Zoning and permitted uses should be independently verified with authorities.
How Realmo checks its estimates
Property Analytics
Unlock full access to Insights
Subscribe to Realmo Intelligence
Open Analytics
Current Use
Lease Details
Yes
Sprinkler system
Yes
Utilities to site
Location Intelligence
Trade Area within ½ mile
2,219
Businesses Nearby
Explore this area
Business Placement
Demographics for 70501, LA
28,721
Population
12,657
Households
2.3
Avg Household Size
38
Median Age
16%
College-Educated
78%
High-School Grad
15.3 sq mi
ZIP Area
1,877
Density / Sq Mi
$31,723
Median Household Income
$25,281
Median Earnings
$867
Median Rent
$117,200
Median Home Value
Check the figures for this property
Cap Rate, Value Estimation, Potential NOI and more
View Realmo Analytics
Market
Vacancy Rate% for Office in South region


Frequently Asked Questions
What type of property is this?
Office building - Two-level office property pairs exposed brick character with Class A finishes, collaborative rooms, and substantial open workspace.
Where is this office building located?
The property is located at 538 Jefferson St Lafayette, LA.
What is the asking price?
The asking price for this property is $4,000,000.
What are key features of this property?
This property features: Approximately 24,850 total square feet across two floors; Renovated Class A office finishes with exposed brick walls; Full kitchen, conference rooms, training rooms, and multiple restrooms


