Updated Duplex with
For Sale
$339,000
Pending
536 Iron Kettle Road, Toms River, NJ 08753
Residential, Duplex, Toms River, NJ
Property Size1,152 SF
Lot Size0.27 Acres
Days on Market101
Property Features for 536 Iron Kettle Road
General Information
Property type
Residential
Property subtype
Duplex
Bedrooms
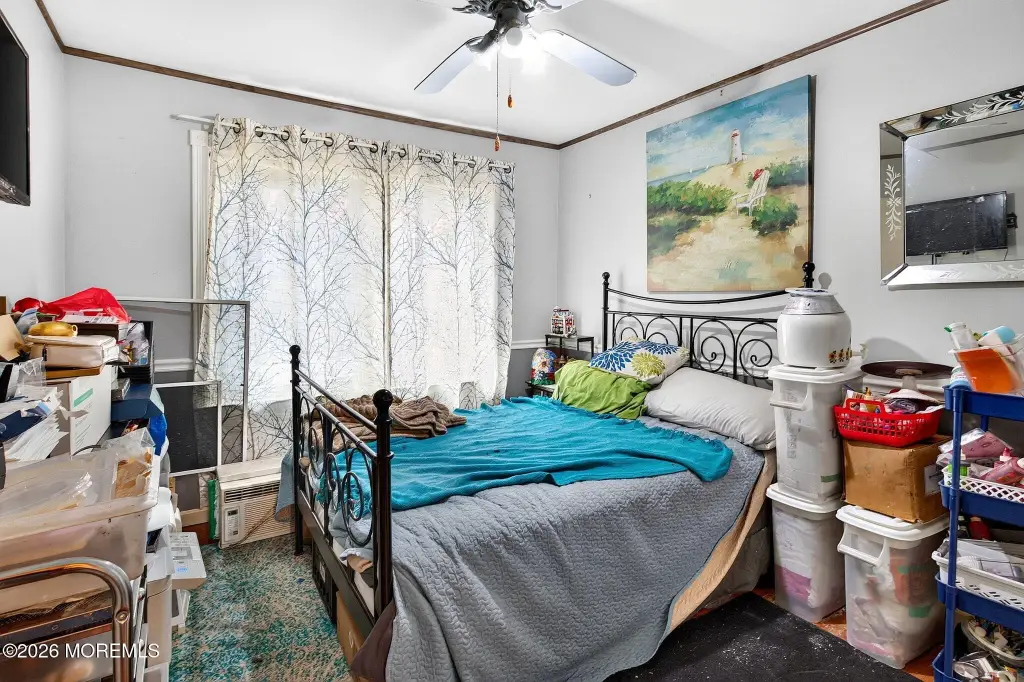
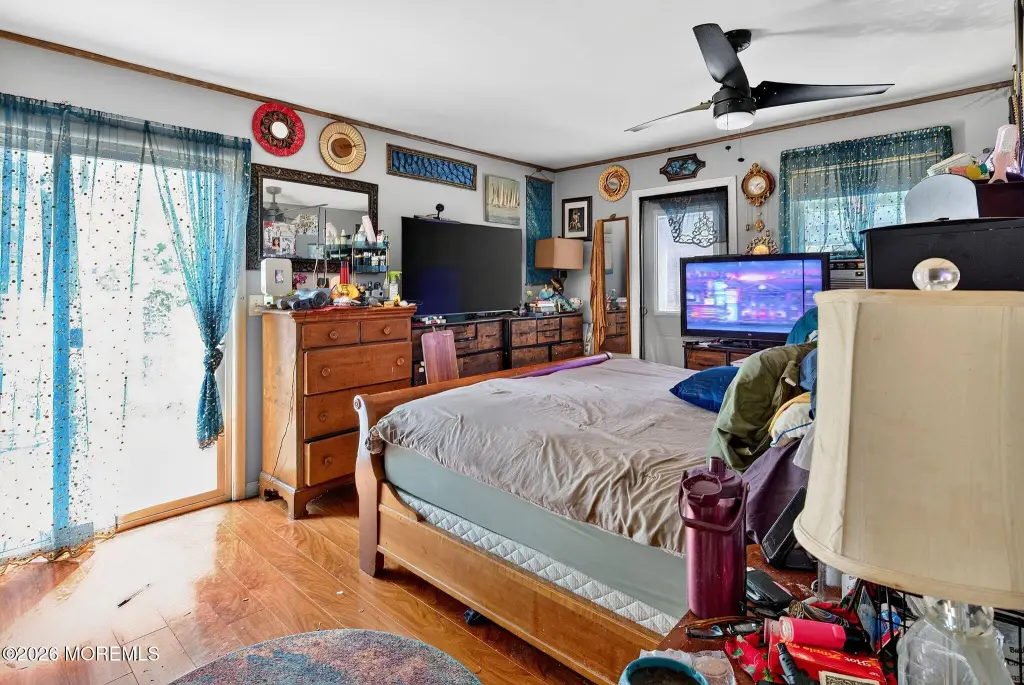
2
Bathrooms
2
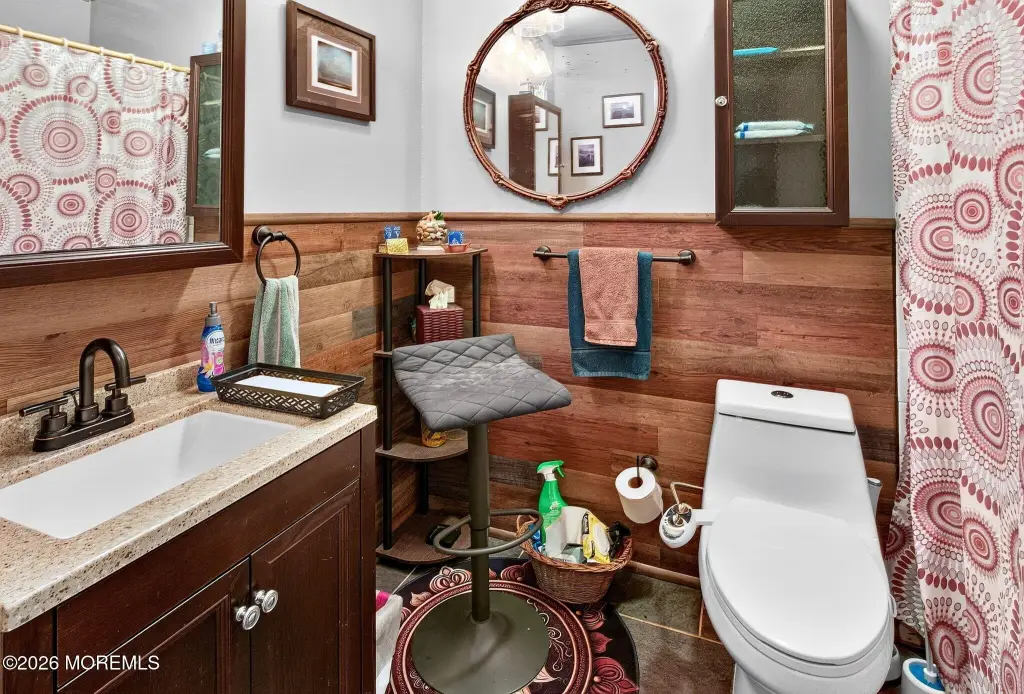
Full bathrooms
2
Rooms
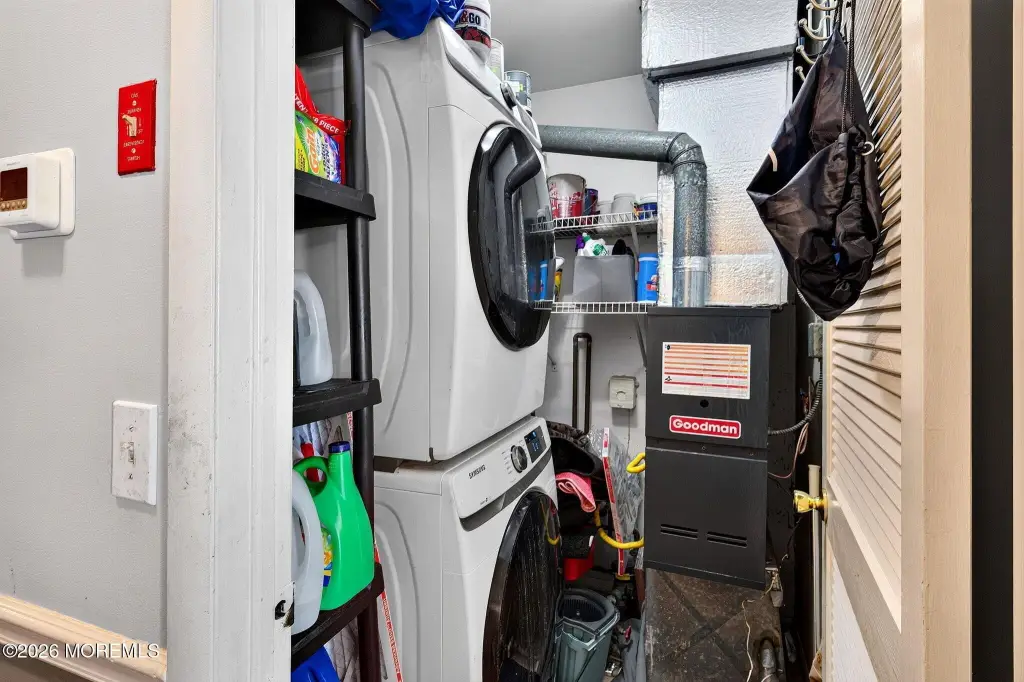
Dining Room, Bathroom 1, Bedroom 2, Laundry Room, Bedroom 1, Utility Room, Bathroom 2
Parking features
Driveway
Patio and Porch features
Patio, Deck
Interior features
Attic - Pull Down Stairs
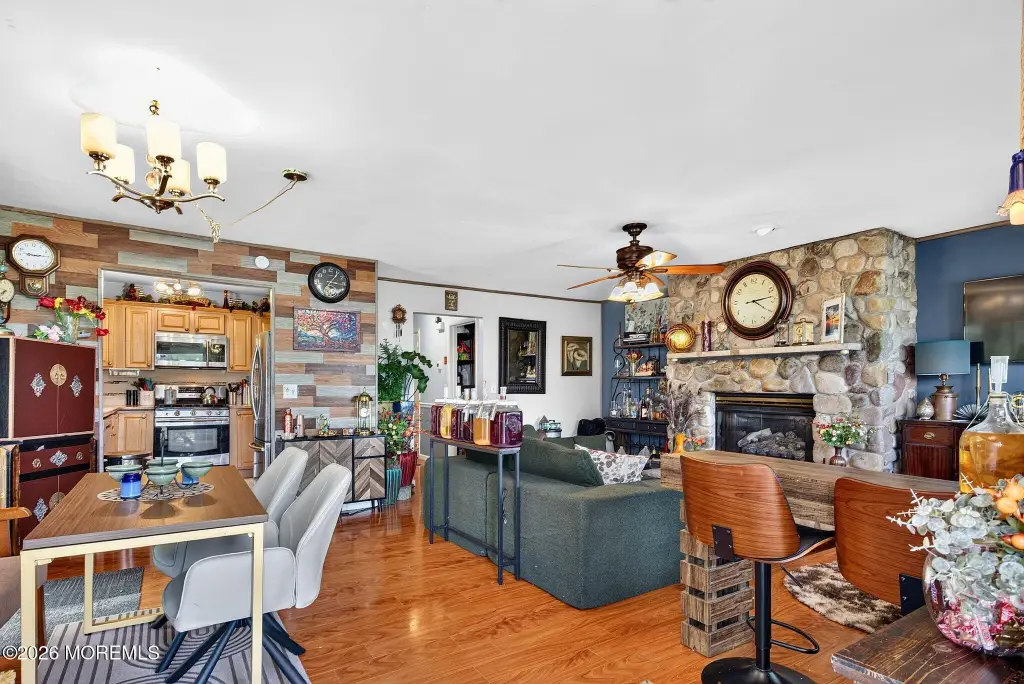
Fireplace
1
Basement
Crawl Space
Subdivision
South Winds
Lot features
Back to Woods
Elementary school
East Dover
Middle school
TR Intr East
High school
Toms River East
Directions
GPS to 536 Iron Kettle Rd, Toms River
Standard status
Pending
APN
08-01078-01-00017
Size
1,152 SF
Lot size
0.27 Acres
Taxes and HOA fees
Tax Year
2025
Tax Annual Amount
4172
HOA Fee
$35 Monthly
Utilities
Sewer type
Public Sewer
Heating system
Forced Air, Natural Gas
Cooling system
Central Air
Water source
Public
Amenities
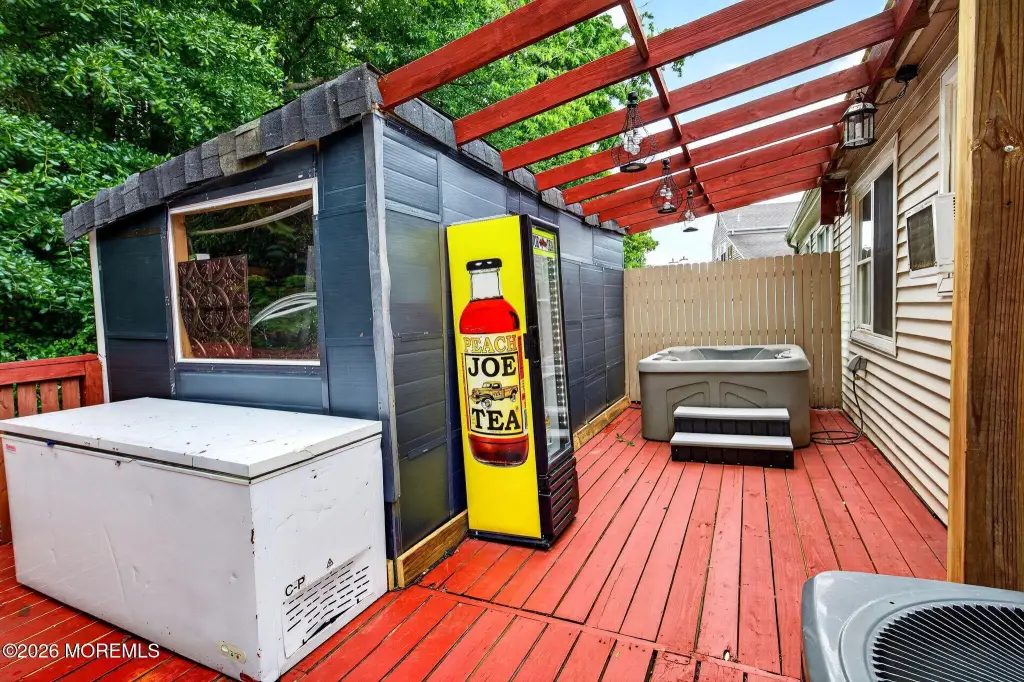
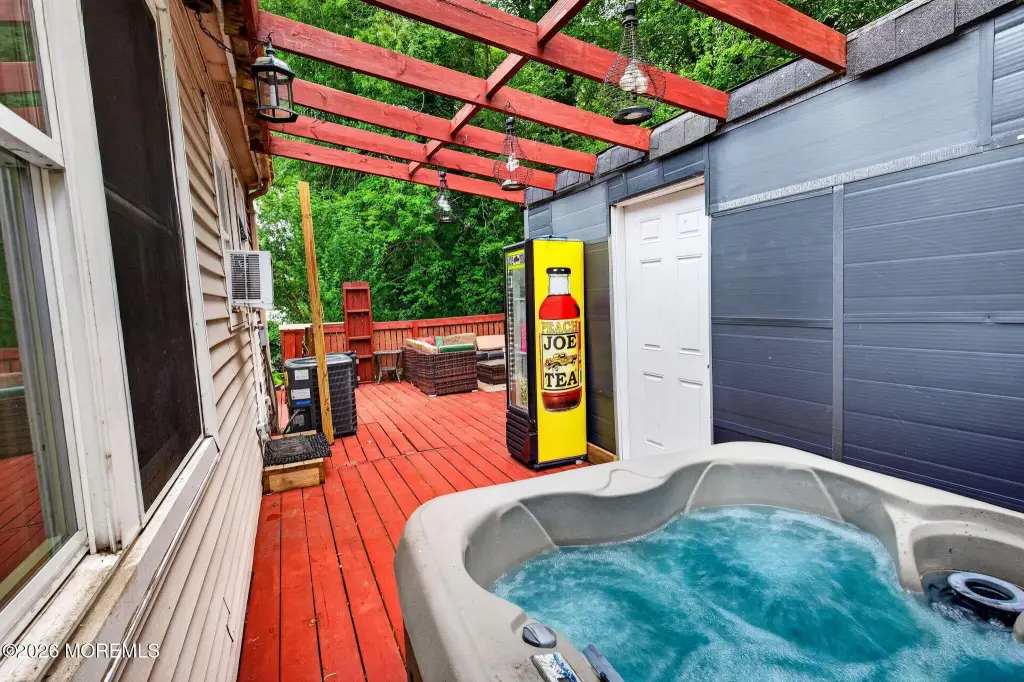
hot tub
koi pond
detached storage shed
walk-up attic
central air
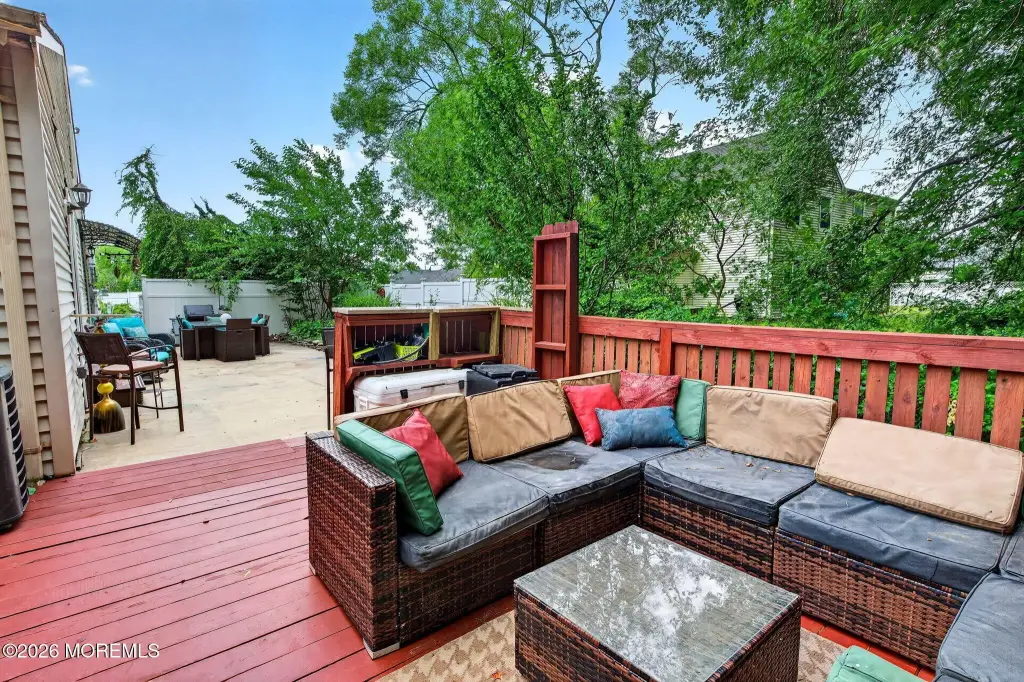
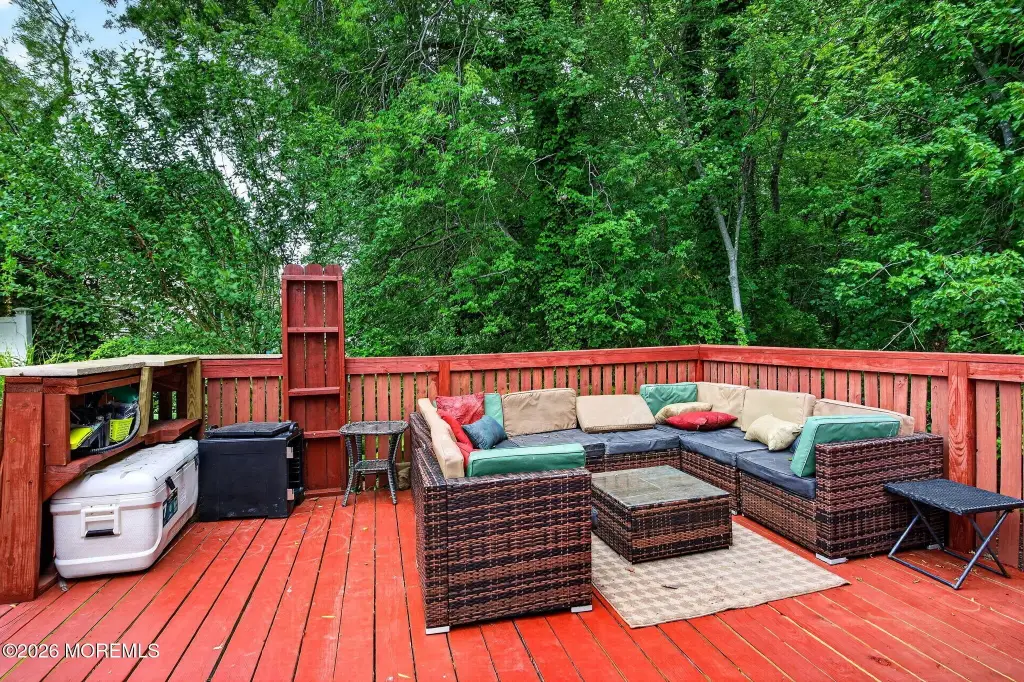
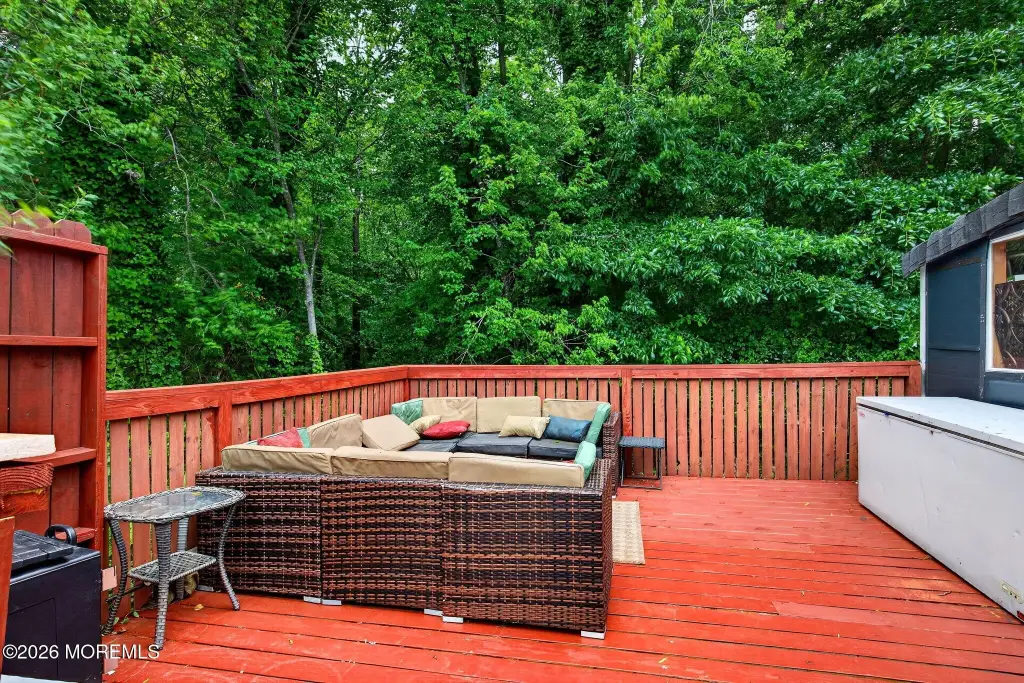
multi-level deck
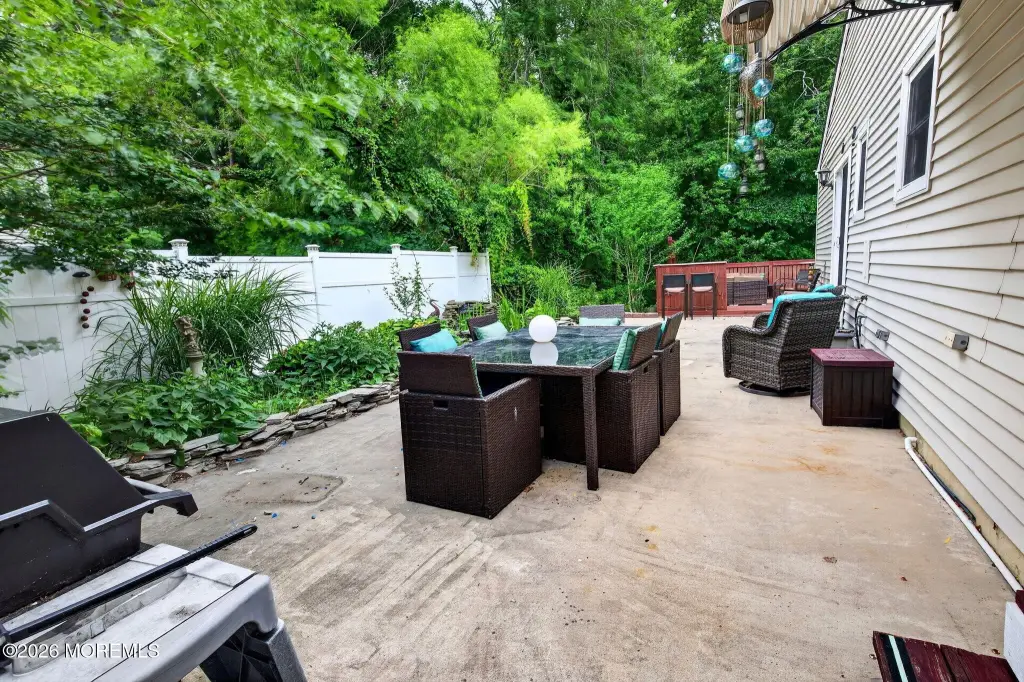
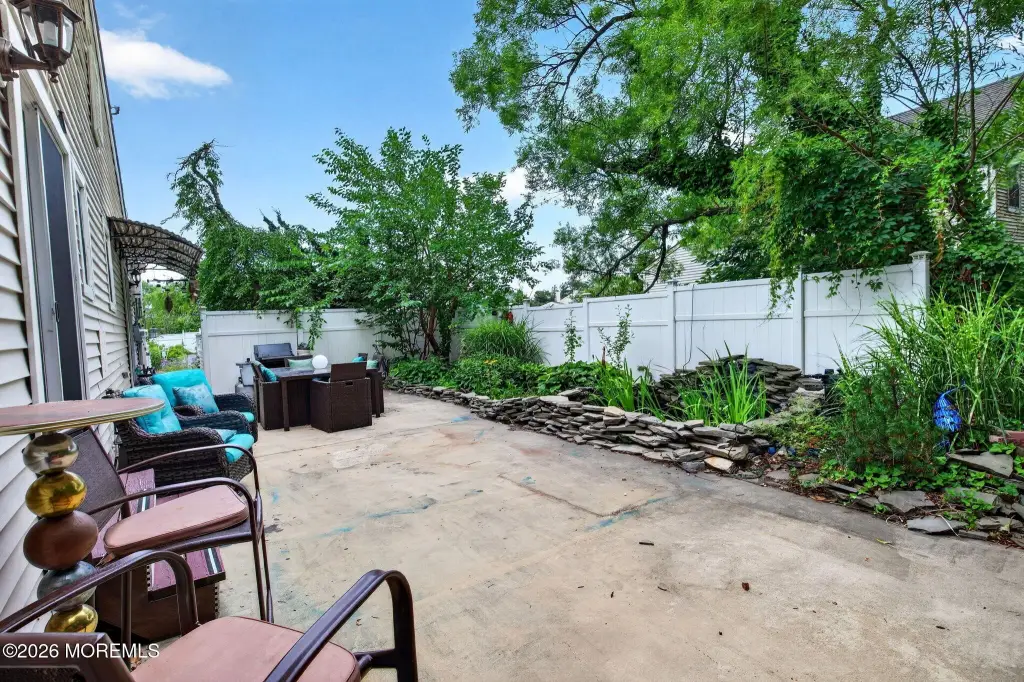
concrete patio
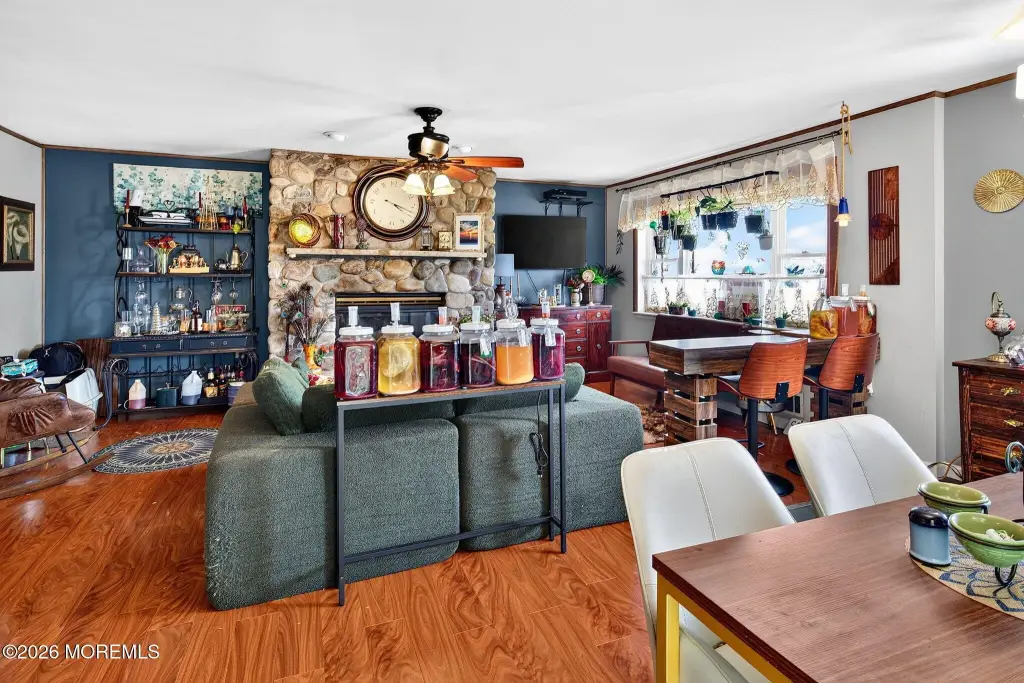
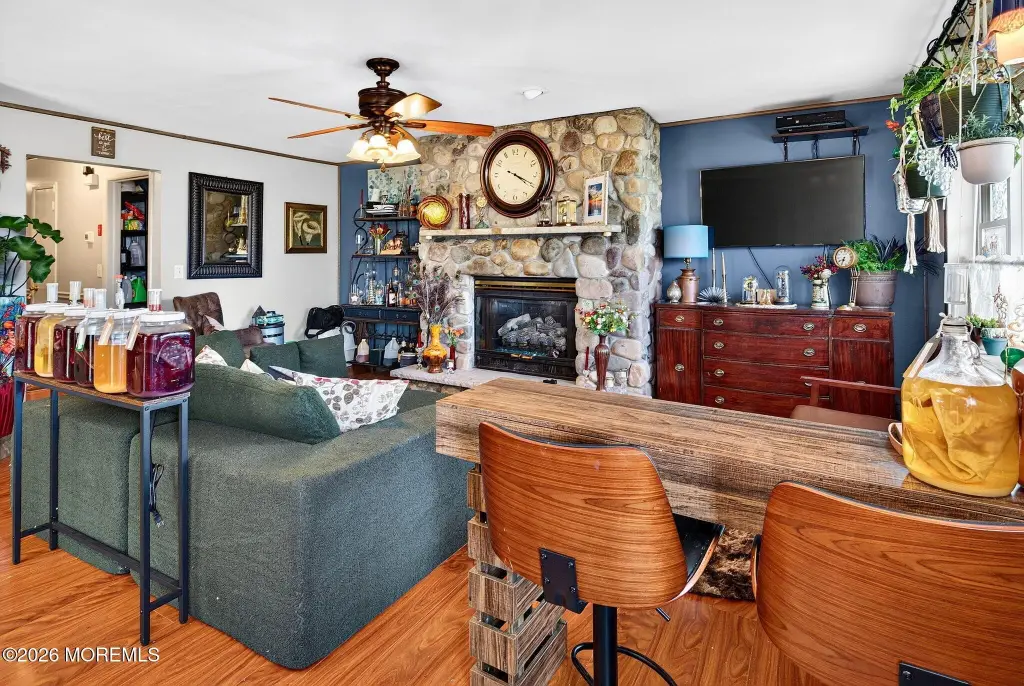
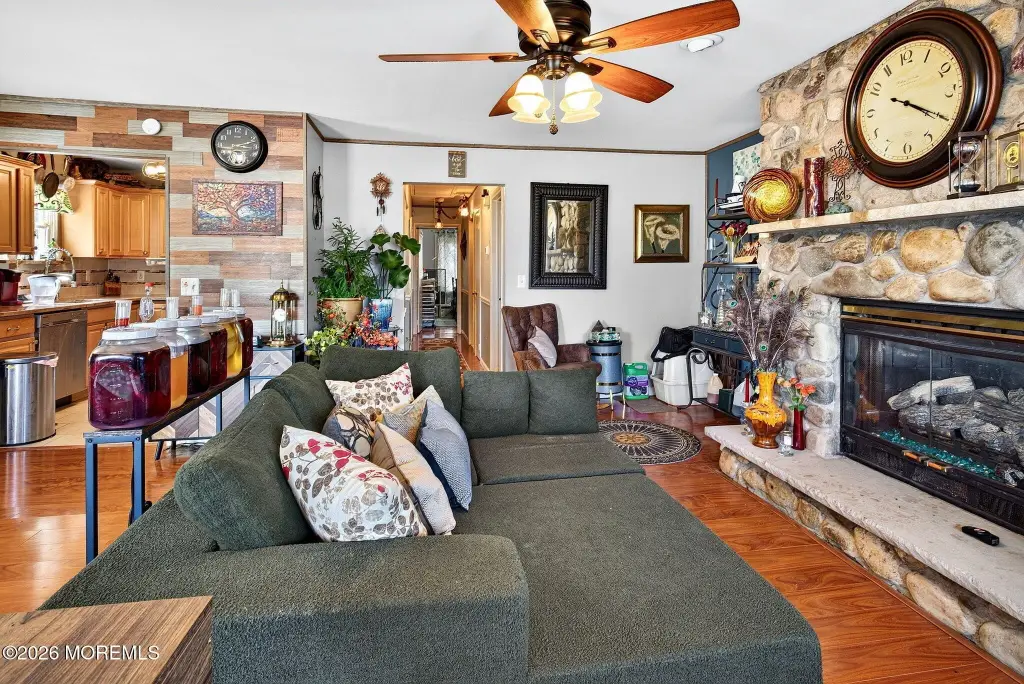
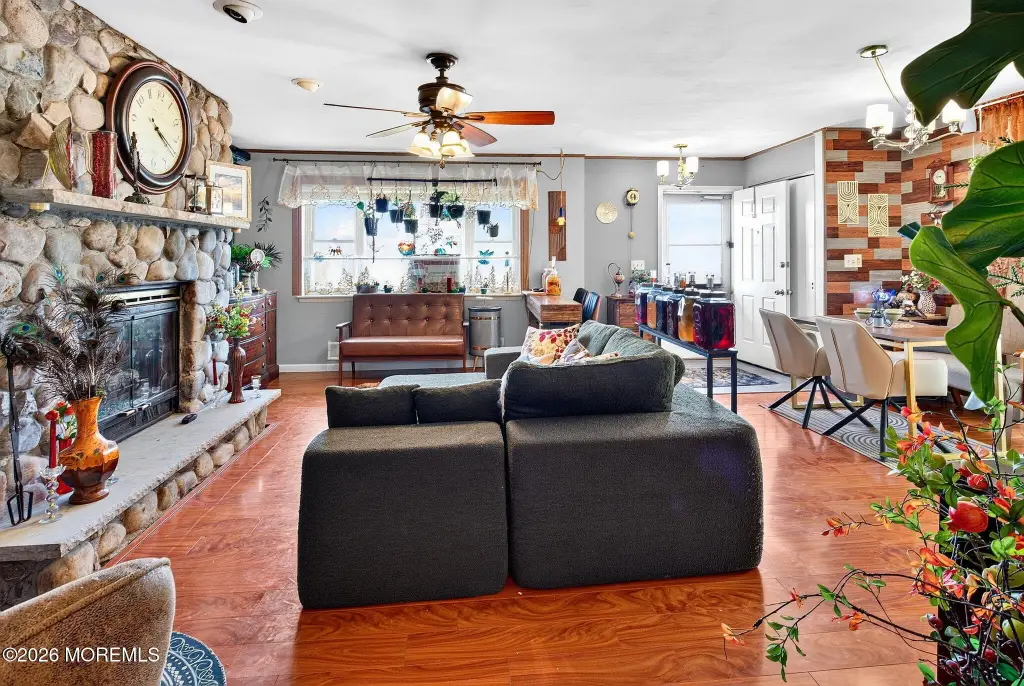
stone fireplace
Building Details
Year built
1987
Floors in Building
1
Roof type
Shingle
Architectural style
Ranch
Listing Agency:
RE/MAX Select
(732) 573-4660
Listed By:
Robert Durso · License #7813218
(732) 887-4787
Added: Jul 9
Changed: Oct 8
Last Checked: Oct 17 at 3:06PM
MLS# 22620850
Copyright © 2026 More MLS. All rights reserved. All information provided by the listing agent/broker is deemed reliable but is not guaranteed and should be independently verified.

Ask AI about this property
Review the available facts, identify missing information and prepare questions for the agent.
Investment Insights
Based on property information with market context.
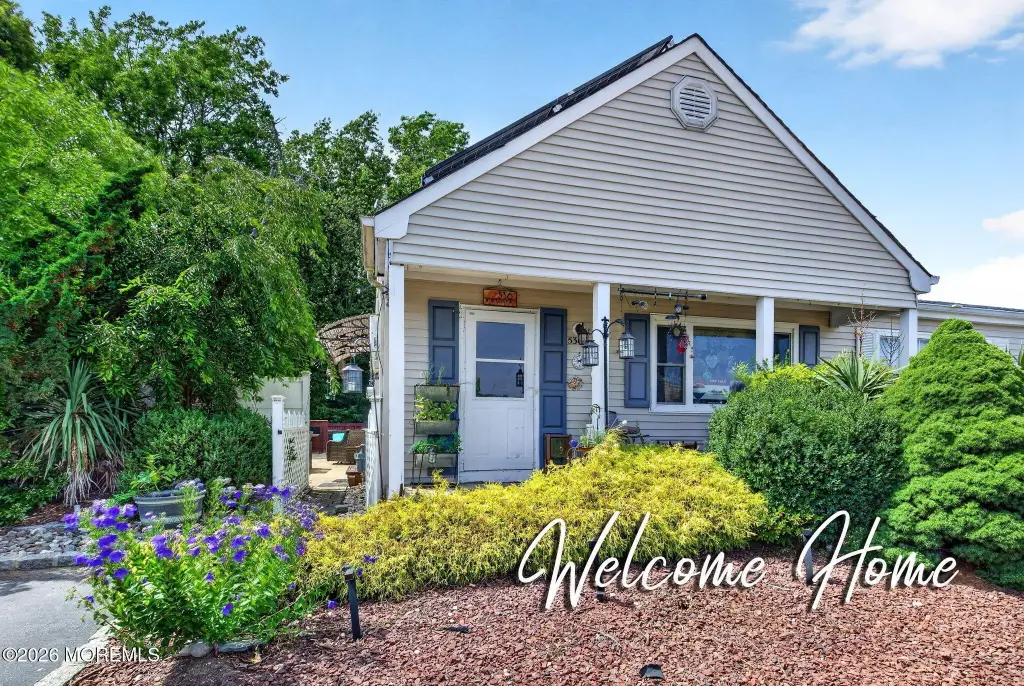
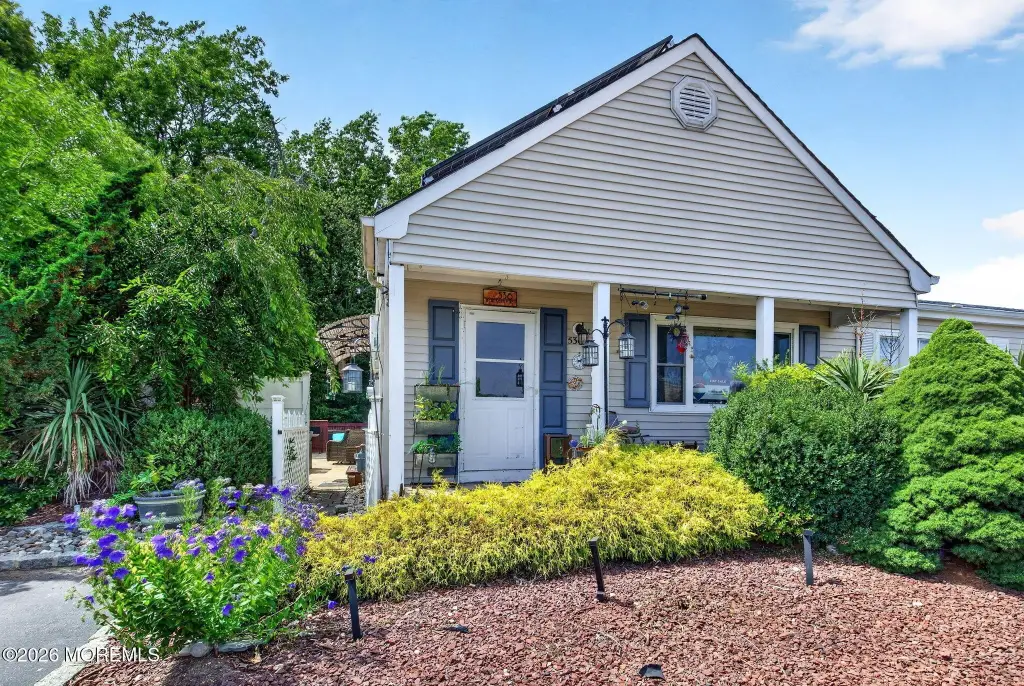
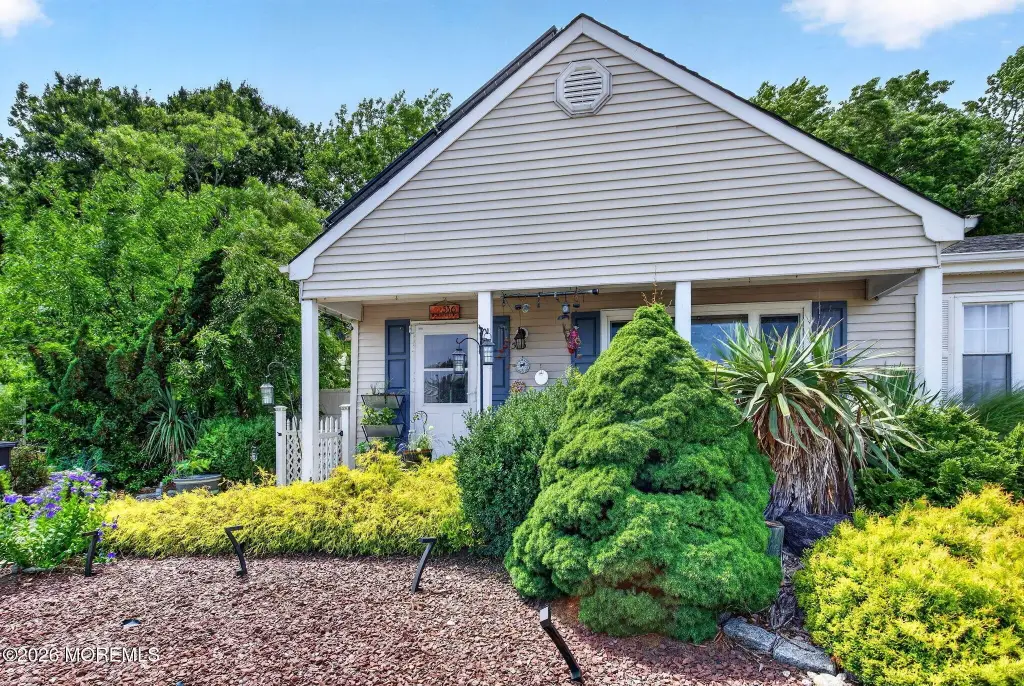
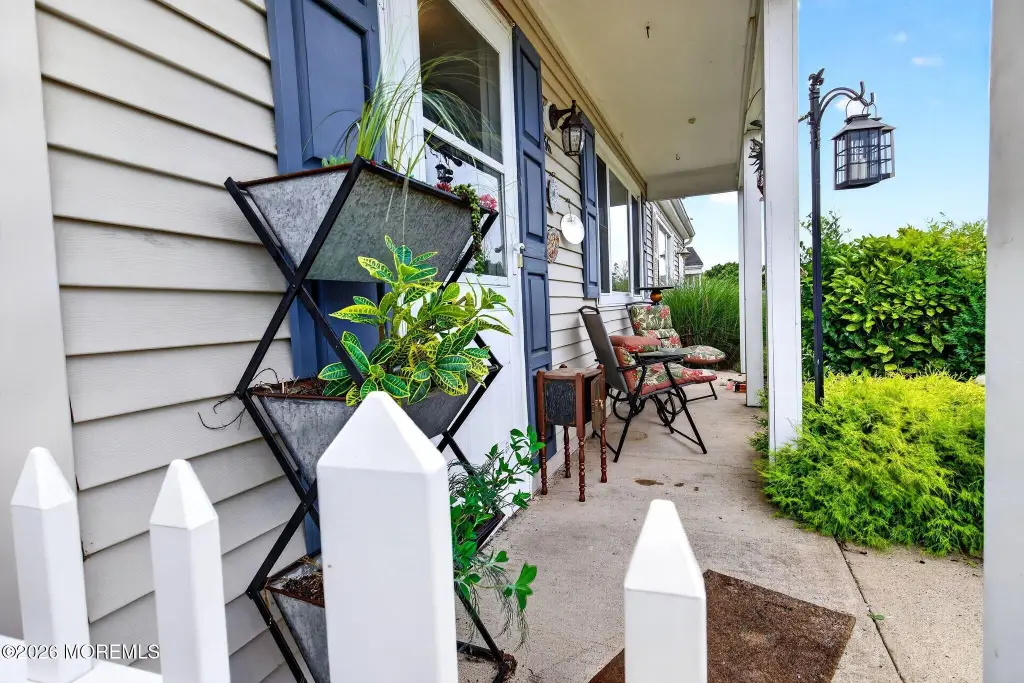
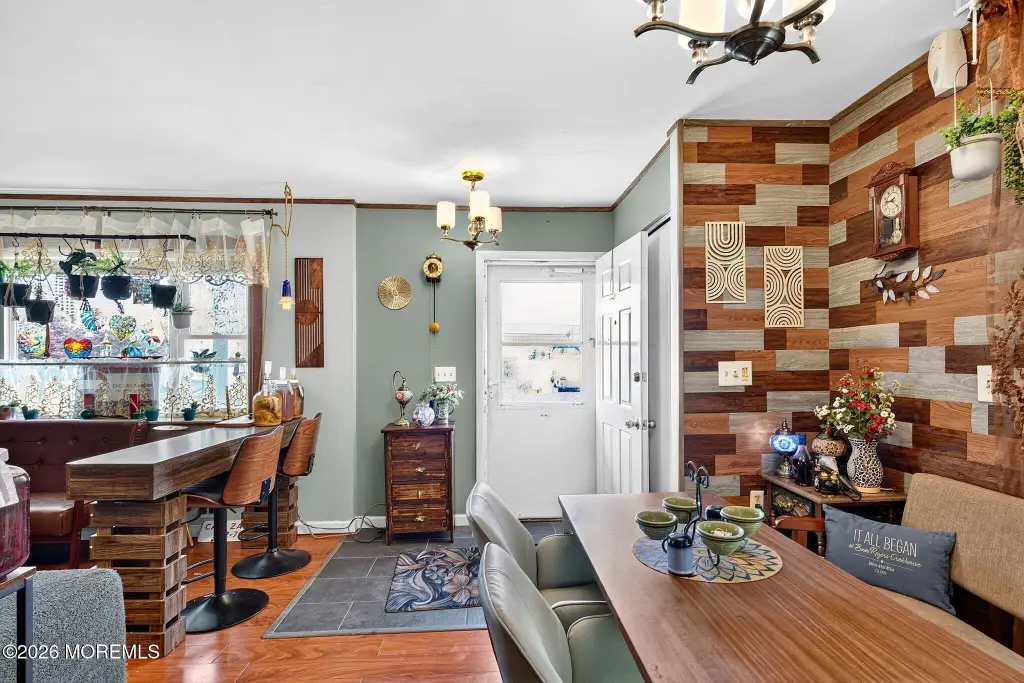
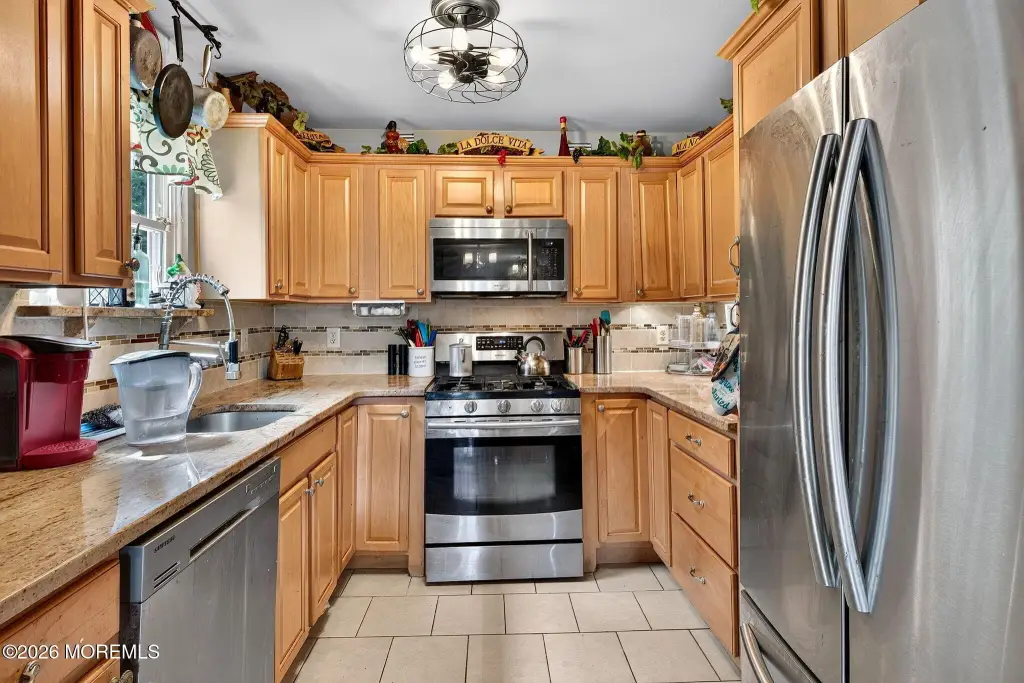
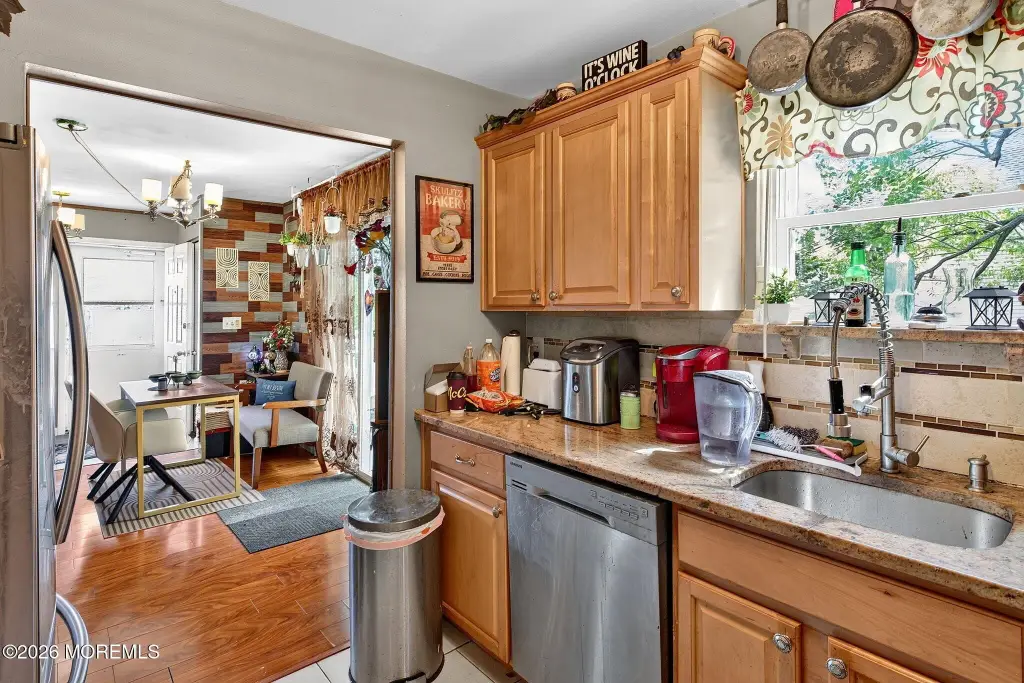
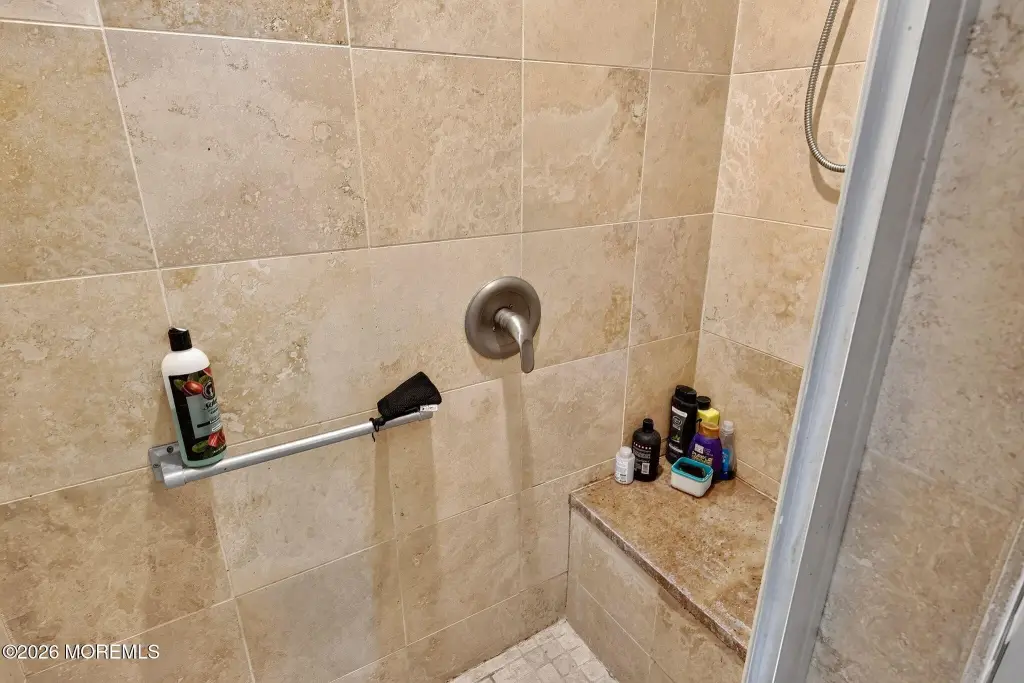
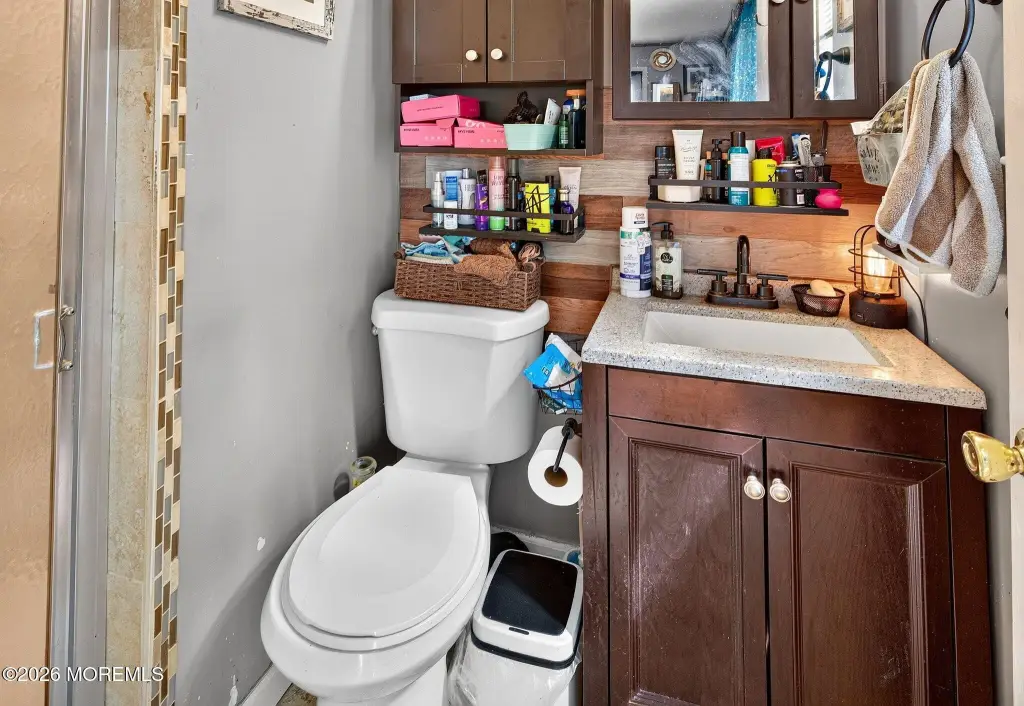
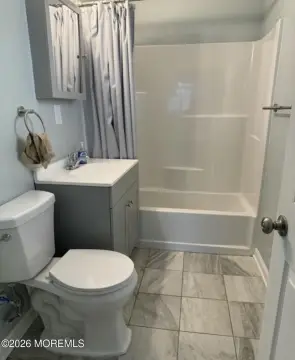
This 1,152-square-foot duplex sits on a 0.27-acre lot and was built in 1987 with a ranch-style design. The residence offers two bedrooms and two bathrooms, an open-concept living arrangement, a renovated kitchen with quartz countertops and stainless steel appliances, and a stone fireplace extending from floor to ceiling. Both bathrooms have been remodeled. Additional features include central air, forced-air natural gas heat, a walk-up attic, laundry and utility rooms, and a low-maintenance exterior.
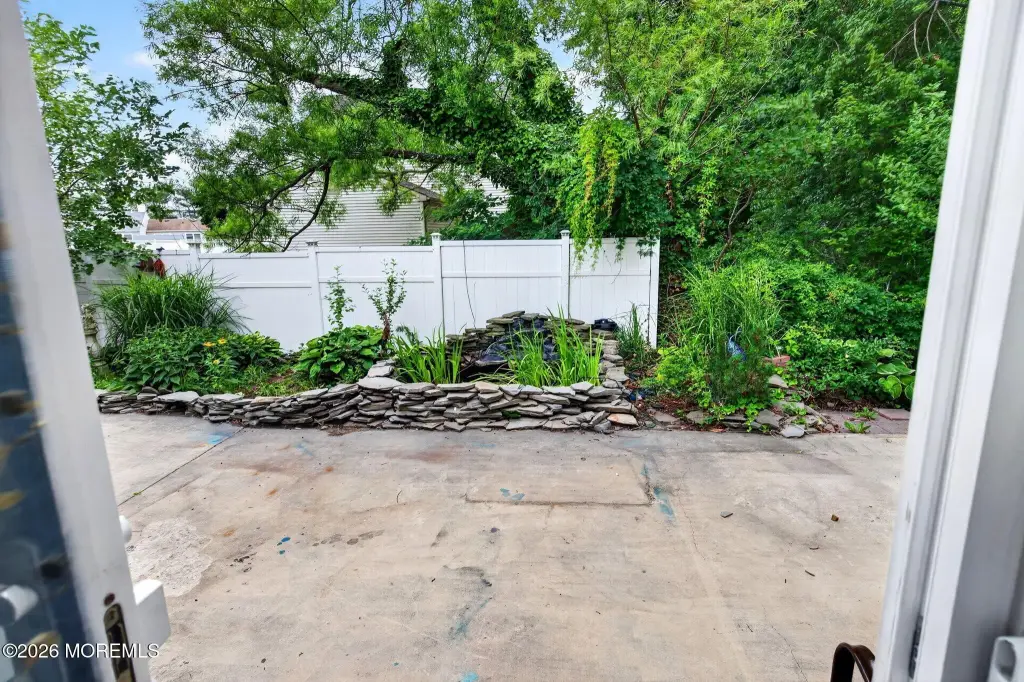
Outdoor improvements include a multi-level deck, concrete patio, koi pond, pergola-covered hot tub, detached storage shed, and driveway parking. The property is served by public water and public sewer and includes a shingle roof. Its Toms River setting is near marinas, beaches, Island Beach State Park, and the Seaside boardwalk.
Outdoor improvements include a multi-level deck, concrete patio, koi pond, pergola-covered hot tub, detached storage shed, and driveway parking. The property is served by public water and public sewer and includes a shingle roof. Its Toms River setting is near marinas, beaches, Island Beach State Park, and the Seaside boardwalk.
Key Highlights
- 1,152‑square‑foot duplex on a 0.27‑acre lot
- Two‑bedroom, two‑bathroom layout with open‑concept living space
- Renovated kitchen with quartz countertops and stainless steel appliances
Financial Insights
Estimated NOI and Cap Rate
NOI / Yr
$19,280
Cap Rate
5.69%
Suggested Prices Based on Cap Rates
Cap Rate 5%
$385,600
$385.6K
Cap Rate 7%
$275,429
$275.4K
Cap Rate 9%
$214,222
$214.2K
Market Conditions
NOI Build-Up for 1,152 SF
Gross rent
$29.4K $25.56/SF
− Vacancy
−$1.9K −$1.65/SF
EGI
$27.5K $23.91/SF
− OpEx
−$8.3K −$7.17/SF
NOI
$19.3K $16.74/SF
Area
Ocean County, NJ
Vacancy
6.46%
Lease Rate
$25.56 /SF/Yr
Expense Ratio
30.00%
Simulate Cap Rate and NOI
Suggested Prices Based on Cap Rates
Cap Rate 5%
$385,600
Cap Rate 7%
$275,429
Cap Rate 9%
$214,222
Alternative Uses
Best Use
Multifamily LT 5
$275.4K
$241.0K – $321.3K
NOI $19,280 @ 7.0% cap · market cap 5.69%
Second Best
Apartment 5plus
$253.1K
$221.4K – $295.3K
NOI $17,715 @ 7.0% cap · market cap 5.23%
Theoretical Best
Office A
$300.8K
$263.2K – $351.0K
NOI $21,057 @ 7.0% cap · market cap 6.21%
Zoning and permitted uses should be independently verified with authorities.
How Realmo checks its estimates
Property Analytics
Unlock full access to Insights
Subscribe to Realmo Intelligence
Open Analytics
Current Use
Lease Details
2
Residential units
Location Intelligence
Trade Area within ½ mile
251
Businesses Nearby
Explore this area
Business Placement
Demographics for 08753, NJ
64,369
Population
27,900
Households
2.3
Avg Household Size
42
Median Age
36%
College-Educated
94%
High-School Grad
23.0 sq mi
ZIP Area
2,799
Density / Sq Mi
$101,648
Median Household Income
$54,291
Median Earnings
$1,742
Median Rent
$377,200
Median Home Value
Check the figures for this property
Cap Rate, Value Estimation, Potential NOI and more
View Realmo Analytics
Market
Vacancy Rate% for Multifamily in Northeast region


Frequently Asked Questions
What type of property is this?
Duplex - Ranch-style residence with a remodeled kitchen, two bathrooms, and multiple outdoor gathering areas.
Where is this duplex located?
The property is located at 536 Iron Kettle Road Toms River, NJ.
What is the asking price?
The asking price for this property is $339,000.
What are key features of this property?
This property features: 1,152‑square‑foot duplex on a 0.27‑acre lot; Two‑bedroom, two‑bathroom layout with open‑concept living space; Renovated kitchen with quartz countertops and stainless steel appliances


