Four-Unit Quadplex with Private
For Sale
$699,999
5333 Wayne St, Raleigh, NC 27606
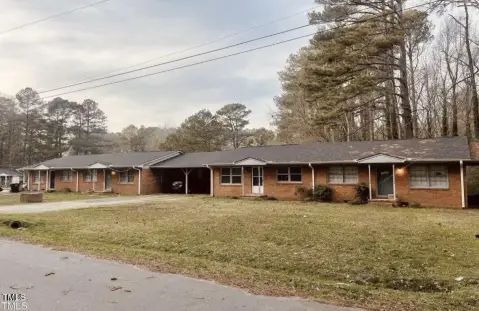
Each residence offers a two-bedroom, two-bath layout with flexible month-to-month lease terms.
Property Size3,981 SF
Price / SF$175.83
Days on Market87
Property Features for 5333 Wayne St
General Information
Standard status
Active
Size
3,981 SF
Property subtype
Multi-Family
Units
Unit Mix
4 x 2BR/2BA
Multifamily Units
4
Additional Details
Highway Access
Yes
Amenities
private deck
Building Details
Year Built
1984
Buildings
1
Listing Agency:
Keller Williams Elite Realty
Listed By:
Aaron Moon · License #255501
(919) 906-6317
Source:
Rubyhenderson
Added: Jul 20
Changed: Oct 3
Last Checked: Oct 7 at 5:02PM
Displayed information is deemed reliable but is not guaranteed and should be independently verified. All listing content including descriptions, pricing, images are the copyrighted material of Keller Williams Elite Realty
Investment Insights
Based on property information with market context.
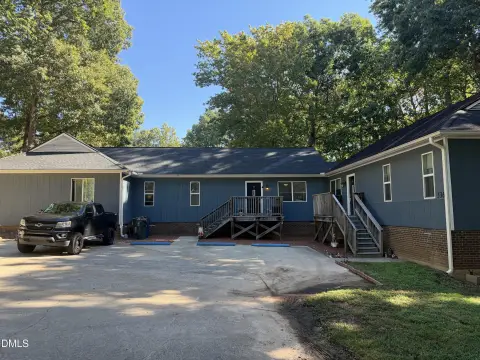
Built in 1984, this 3,981-square-foot quadplex contains four residences, each configured with two bedrooms, two bathrooms, and a private deck. All units are leased month to month, allowing lease terms to remain flexible while improvements are completed over time. The property is positioned next to Lake Johnson Park, with direct access to the Raleigh Greenway system. Nearby outdoor amenities include 1.5 miles of unpaved trails, 2.8 miles of paved greenway, a nature preserve, and an outdoor swimming pool. Regional access includes I-40, NC State, RDU International Airport, and Research Triangle Park.
Key Highlights
- Four units, each with 2 bedrooms, 2 bathrooms, and a private deck
- 3,981 SF quadplex built in 1984
- All 4 units are leased on a month‑to‑month basis
Financial Insights
Estimated NOI and Cap Rate
NOI / Yr
$45,497
Cap Rate
6.50%
Suggested Prices Based on Cap Rates
Cap Rate 5%
$909,940
$909.9K
Cap Rate 7%
$649,957
$650.0K
Cap Rate 9%
$505,522
$505.5K
Market Conditions
NOI Build-Up for 3,981 SF
Gross rent
$69.3K $17.40/SF
− Vacancy
−$4.3K −$1.07/SF
EGI
$65.0K $16.33/SF
− OpEx
−$19.5K −$4.90/SF
NOI
$45.5K $11.43/SF
Area
Raleigh, NC
Vacancy
6.17%
Lease Rate
$17.40 /SF/Yr
Expense Ratio
30.00%
Simulate Cap Rate and NOI
Suggested Prices Based on Cap Rates
Cap Rate 5%
$909,940
Cap Rate 7%
$649,957
Cap Rate 9%
$505,522
Alternative Uses
Best Use
Multifamily LT 5
$650.0K
$568.7K – $758.3K
NOI $45,497 @ 7.0% cap · market cap 6.50%
Second Best
Apartment 5plus
$579.1K
$506.7K – $675.6K
NOI $40,535 @ 7.0% cap · market cap 5.79%
Theoretical Best
Specialty Retail
$1.09M
$957.3K – $1.28M
NOI $76,584 @ 7.0% cap · market cap 10.94%
Zoning and permitted uses should be independently verified with authorities.
How Realmo checks its estimates
Property Analytics
Unlock full access to Insights
Subscribe to Realmo Intelligence
Open Analytics
Current Use
Lease Details
4
Residential units
Yes
Highway access
Location Intelligence
Trade Area within ½ mile
695
Businesses Nearby
Explore this area
Business Placement
Demographics for 27606, NC
48,343
Population
22,199
Households
2.2
Avg Household Size
29
Median Age
59%
College-Educated
93%
High-School Grad
24.5 sq mi
ZIP Area
1,973
Density / Sq Mi
$75,640
Median Household Income
$40,950
Median Earnings
$1,369
Median Rent
$423,900
Median Home Value
Check the figures for this property
Cap Rate, Value Estimation, Potential NOI and more
View Realmo Analytics
Market
Vacancy Rate% for Multifamily in South region

Questions? Ask Rey
Realmo’s AI knows this listing — price, zoning, demand, history. Ask anything.





Frequently Asked Questions
What type of property is this?
Quadplex - Each residence offers a two-bedroom, two-bath layout with flexible month-to-month lease terms.
Where is this quadplex located?
The property is located at 5333 Wayne St Raleigh, NC.
What is the asking price?
The asking price for this property is $699,999.
What are key features of this property?
This property features: Four units, each with 2 bedrooms, 2 bathrooms, and a private deck; 3,981 SF quadplex built in 1984; All 4 units are leased on a month‑to‑month basis


