Single-Family Villa with Screened
5333 Surrey Lane Sebring, FL 33875
New
For Sale
$319,900
SINGLE_FAMILY - Sebring, FL
Property Size2,497 SF
Price / SF$128.11
Days on Market4
Property Features for 5333 Surrey Lane
General Information
Property type
Residential
Property subtype
Duplex
Zoning
R3FUD
Bedrooms
2
Bathrooms
2
Rooms
Bathroom 1, Bedroom 1, Bedroom 2, Bathroom 2
Parking features
Garage
Interior features
BB / HS Internet Available, Blinds, Cable TV Available, Ceiling Fans, Garage Door Opener, Tray Ceilings
Exterior features
Central Irrigation, Stucco
Appliances
Dishwasher, Disposal, Dryer, Microwave, Refrigerator(s), Stove(s) / Range(s) Oven(s), Washer, Wtr Heater-Electric
Standard status
Active
APN
C-09-35-28-200-0050-00A0
Size
2,497 SF
Taxes and HOA fees
Tax Year
2025
Tax Description
COUNTRY CLUB DOWNS UNREC BUILDING 5 UNIT A + INT IN COMMON AREA
Tax Annual Amount
3417
Utilities
Sewer type
Public Sewer
Heating system
Central, Electric (Heating)
Cooling system
Electric, Central Air
Building Details
Year built
2006
Floors in Building
1
Flooring type
Carpet, Tile
Building materials
Concrete Block
Roof type
Shingle
Architectural style
Other
Listing Agency:
BHHS Florida Properties Group
(863) 402-5701
Listed By:
Helen Ferry
(863) 381-1089
Added: Jul 24
Changed: Jul 26
Last Checked: Jul 27 at 10:06PM
MLS# 326797
Copyright © 2026 Heartland Multiple Listing Service, Inc. All rights reserved. All information provided by the listing agent/broker is deemed reliable but is not guaranteed and should be independently verified.
Investment Insights
Based on property information with market context.
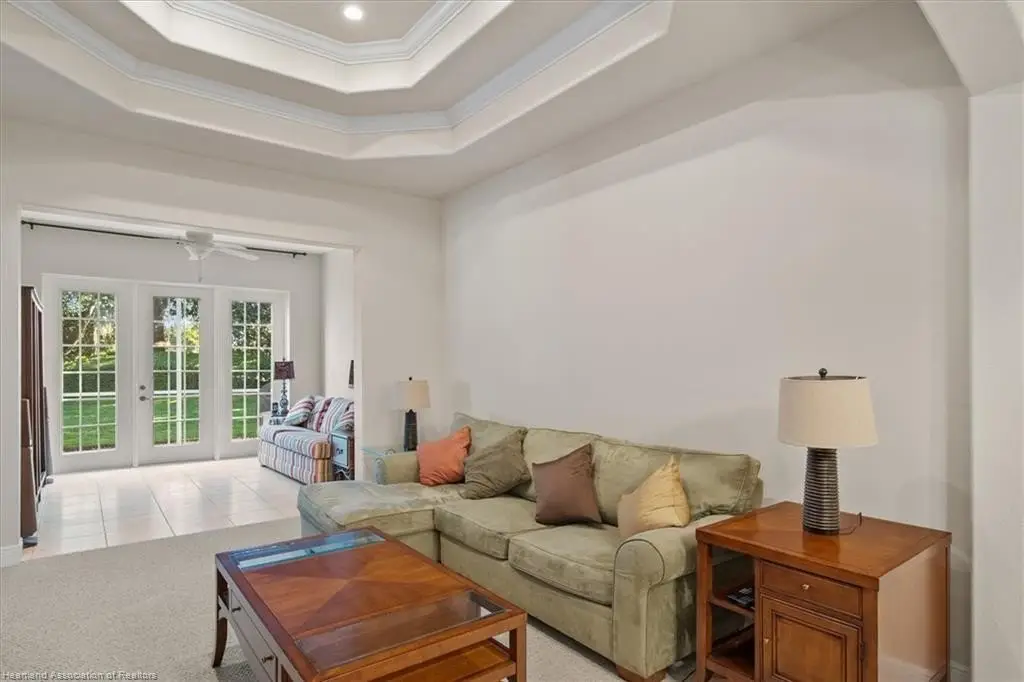
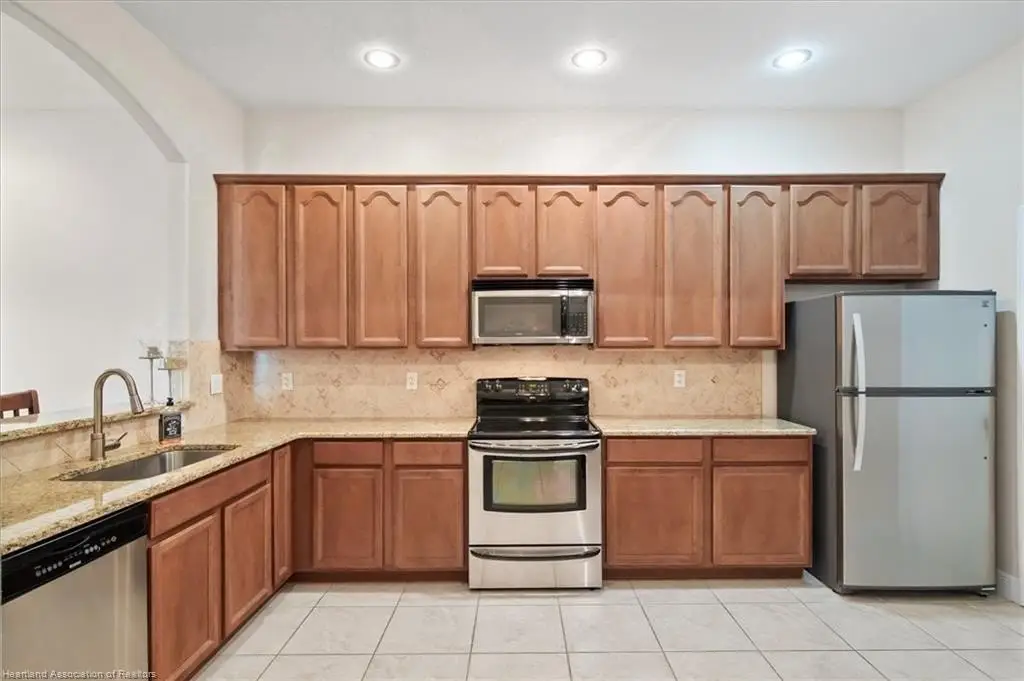
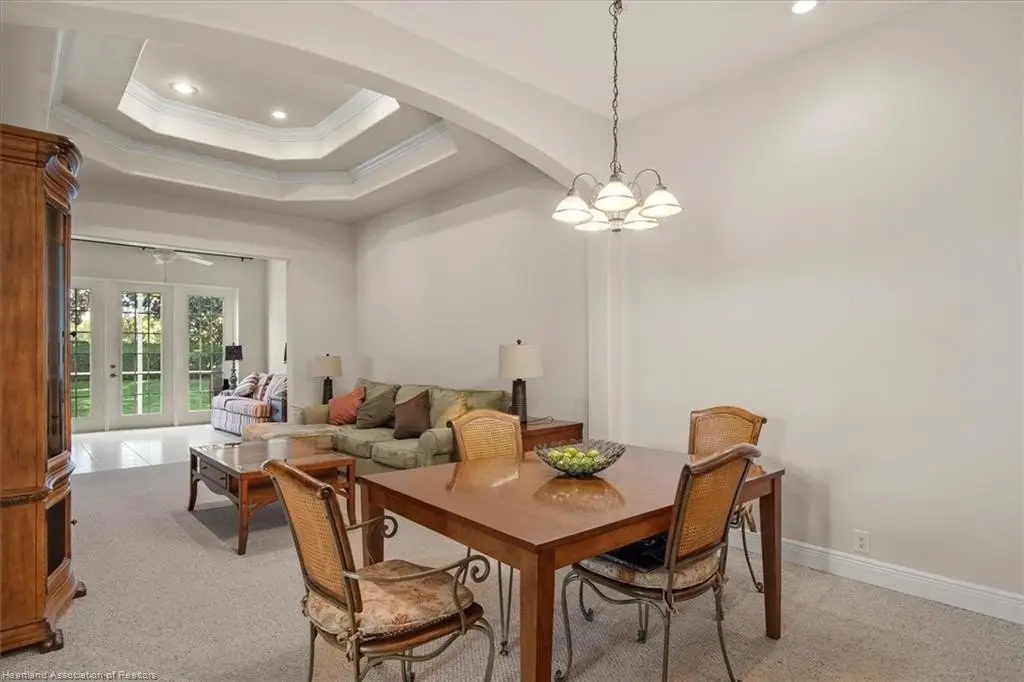
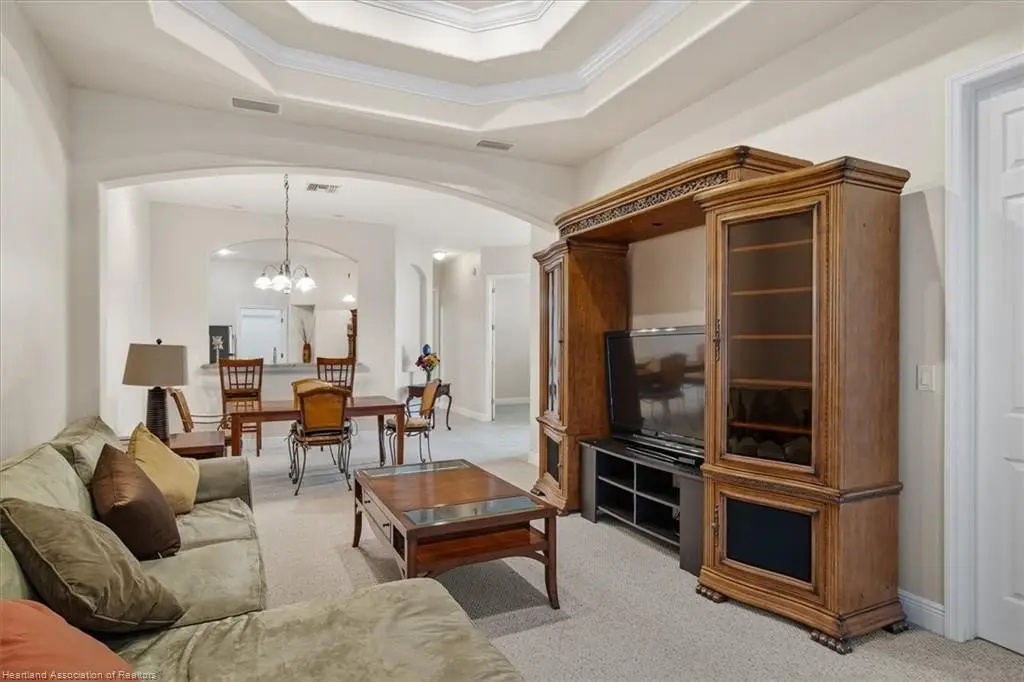
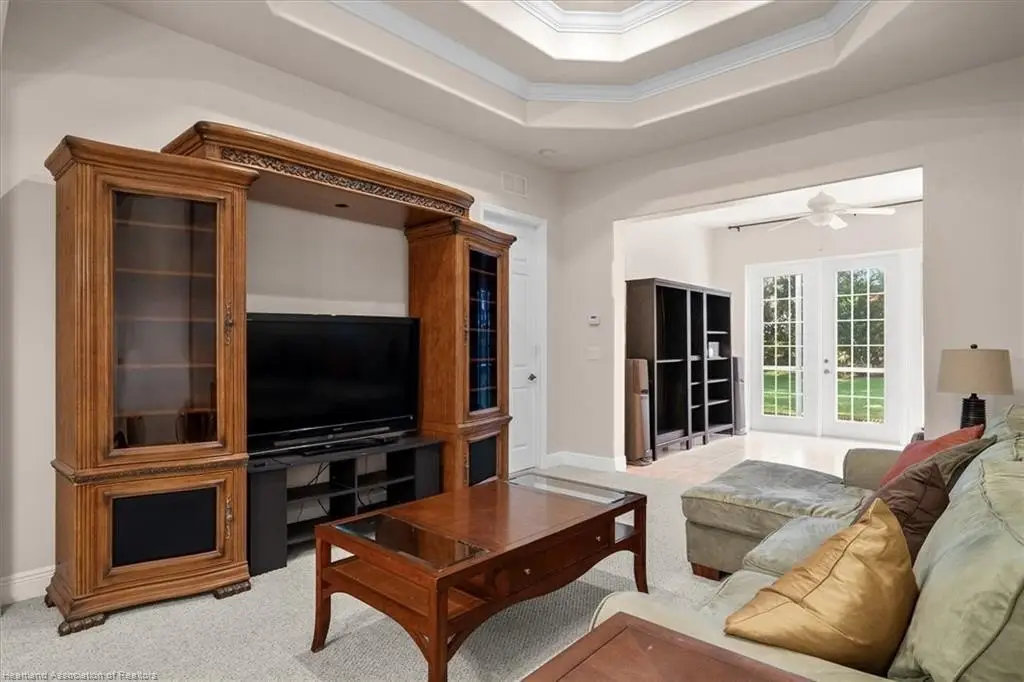
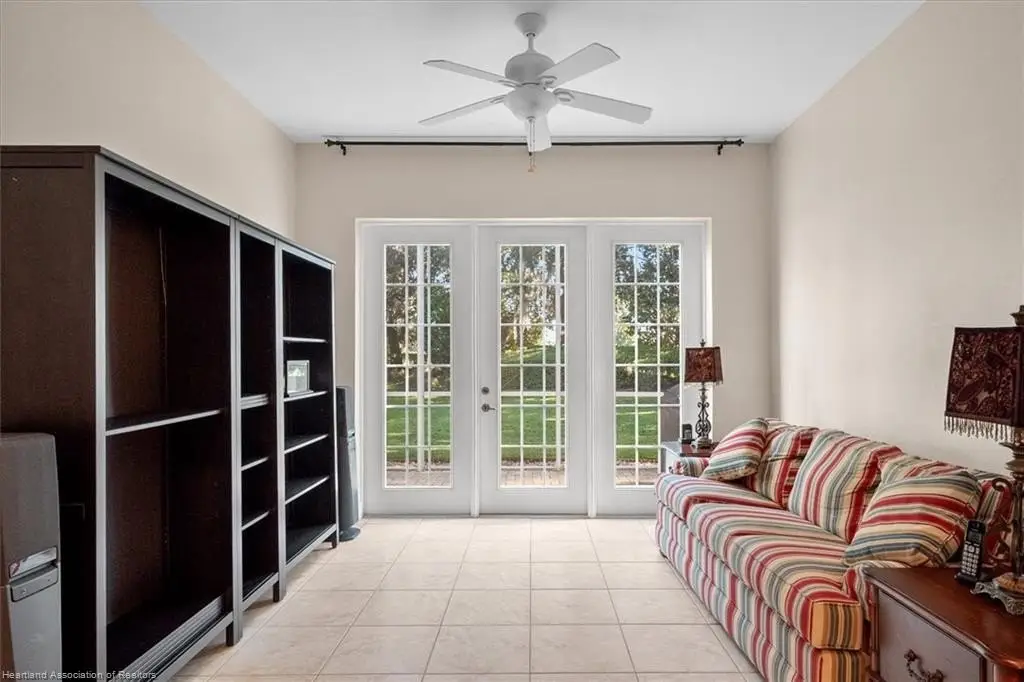
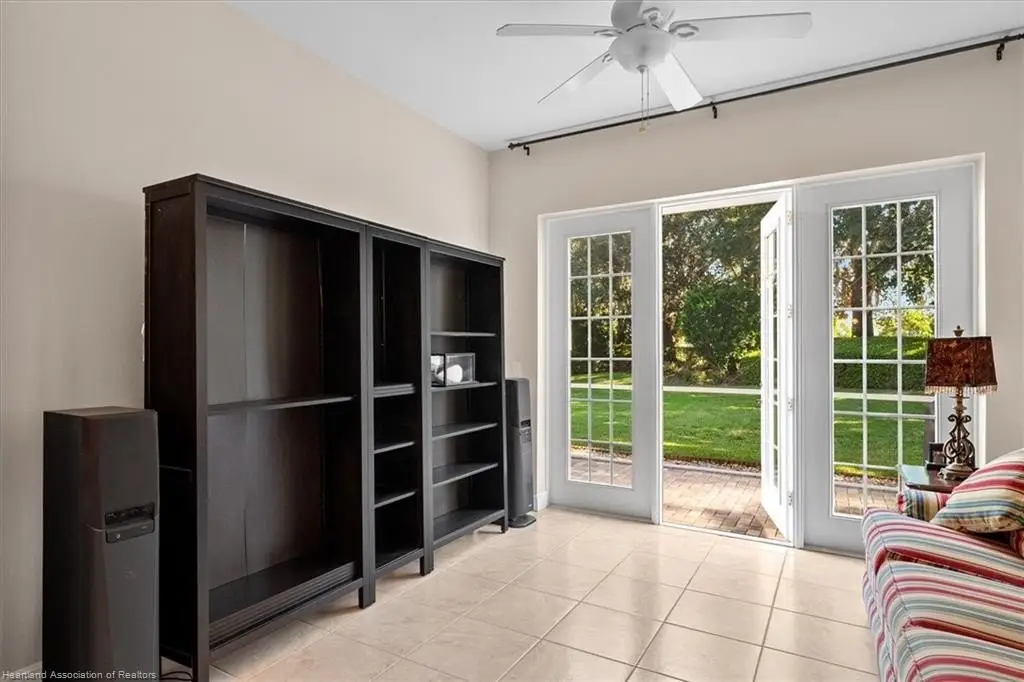
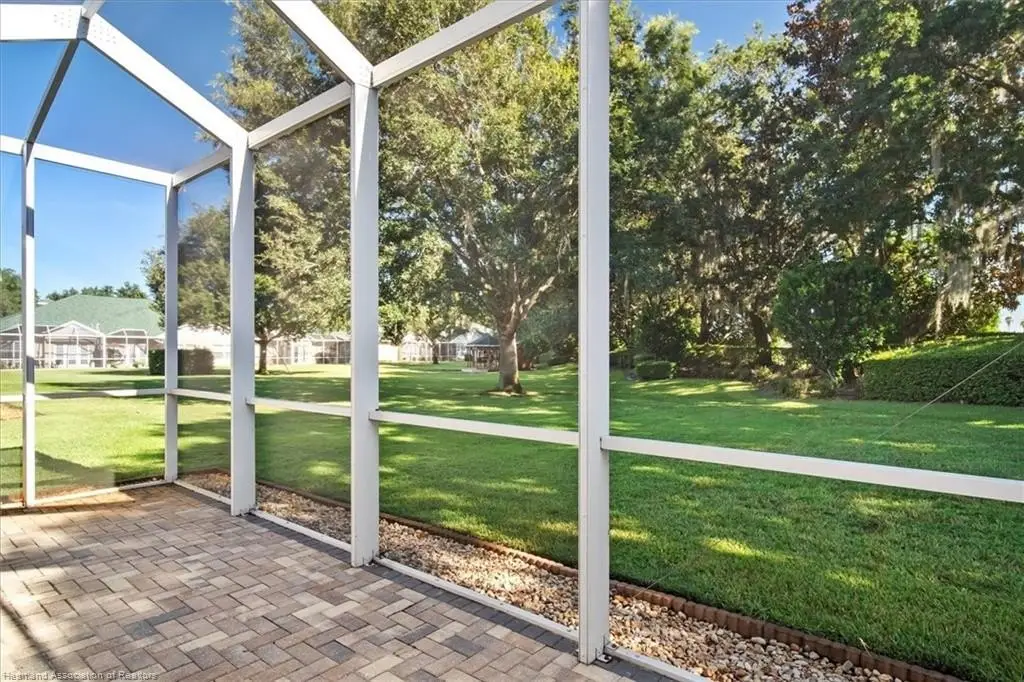
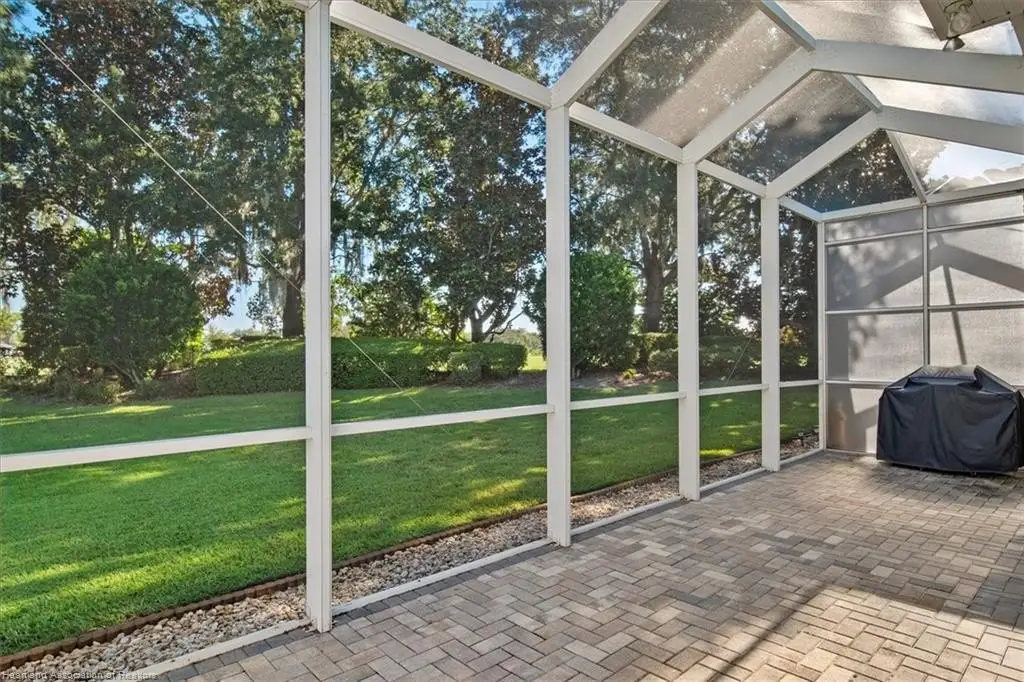
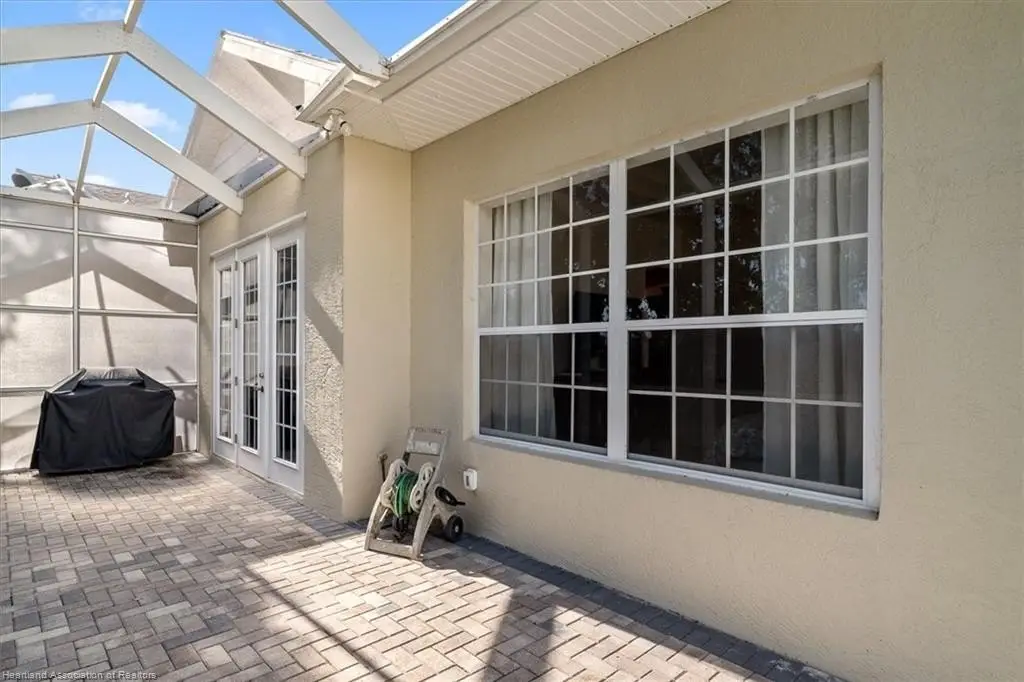
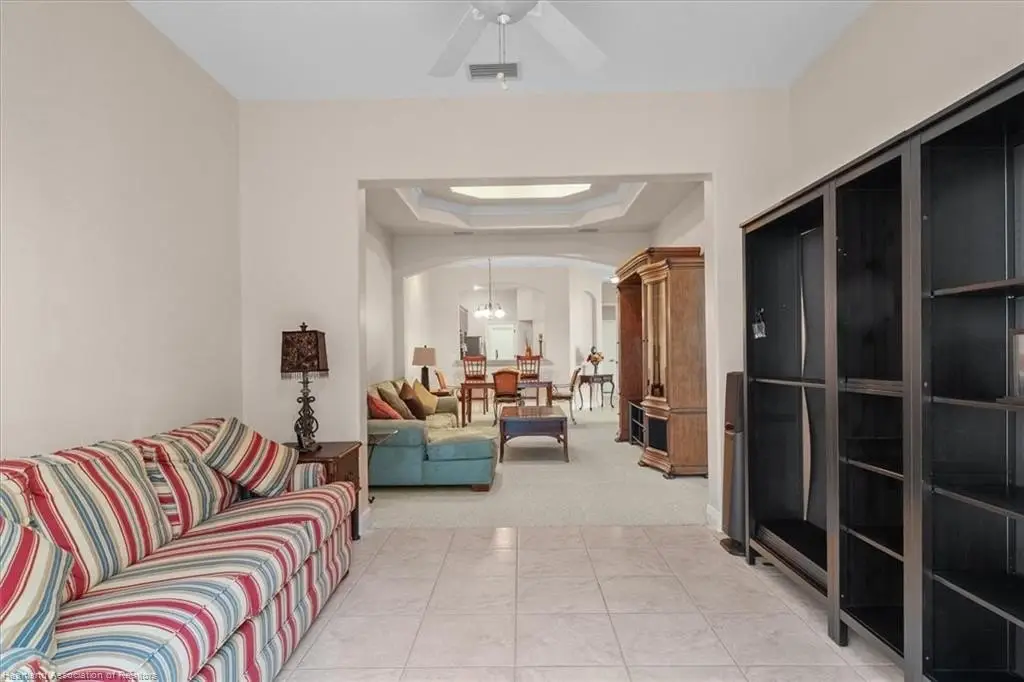
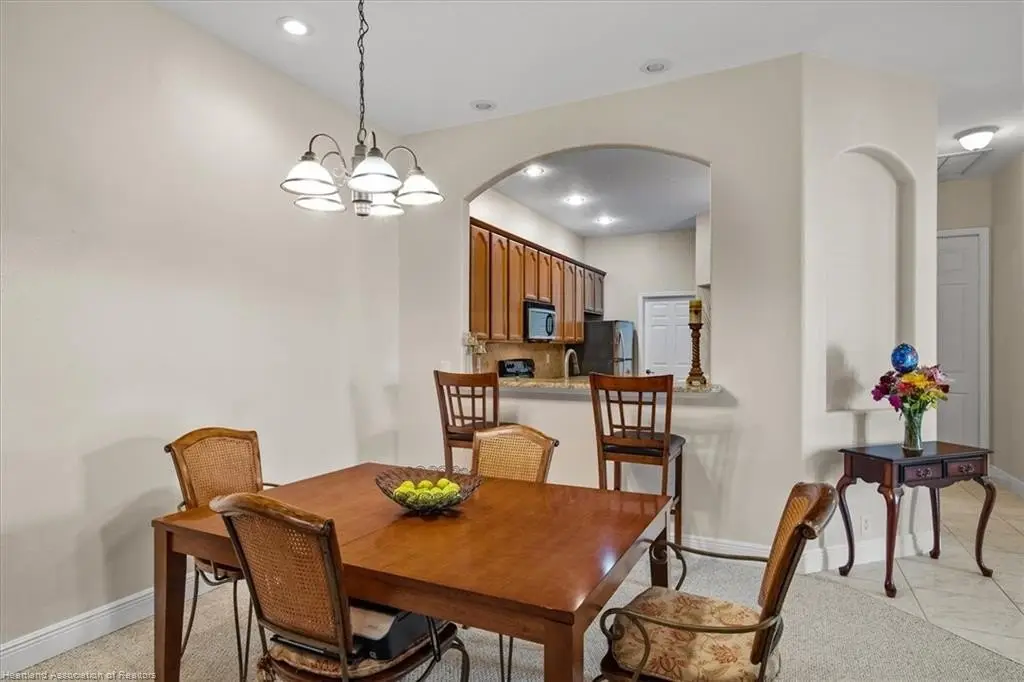
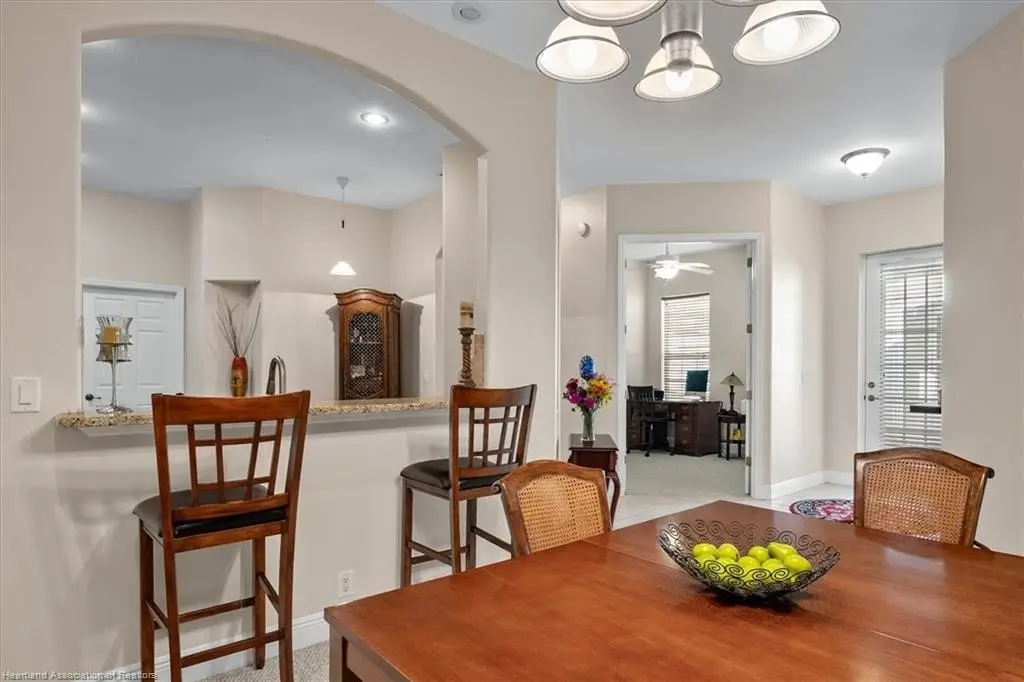
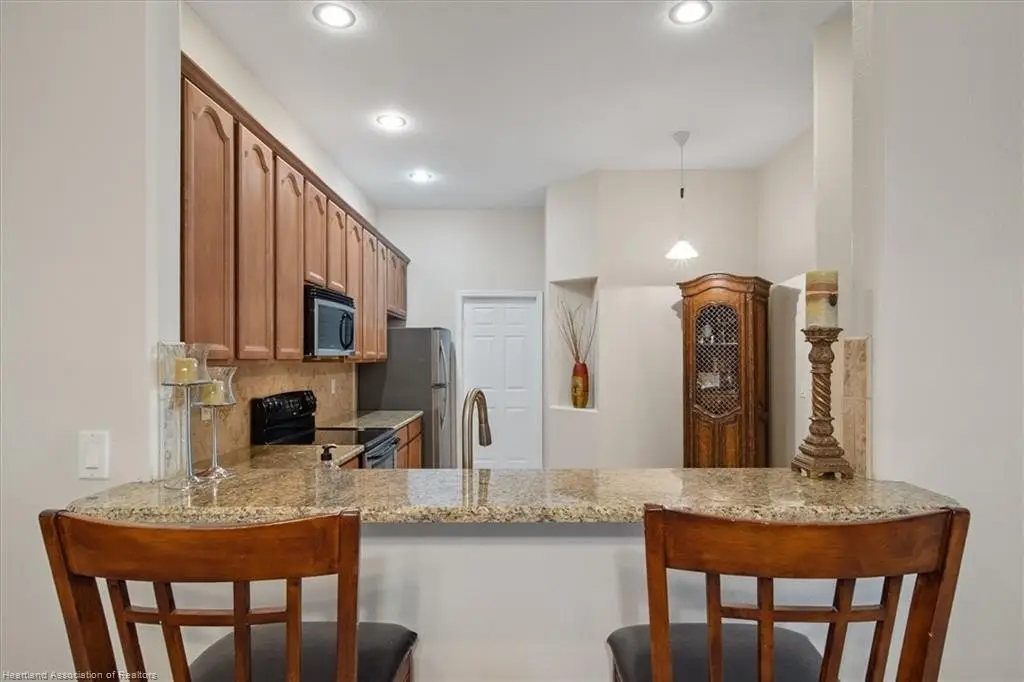
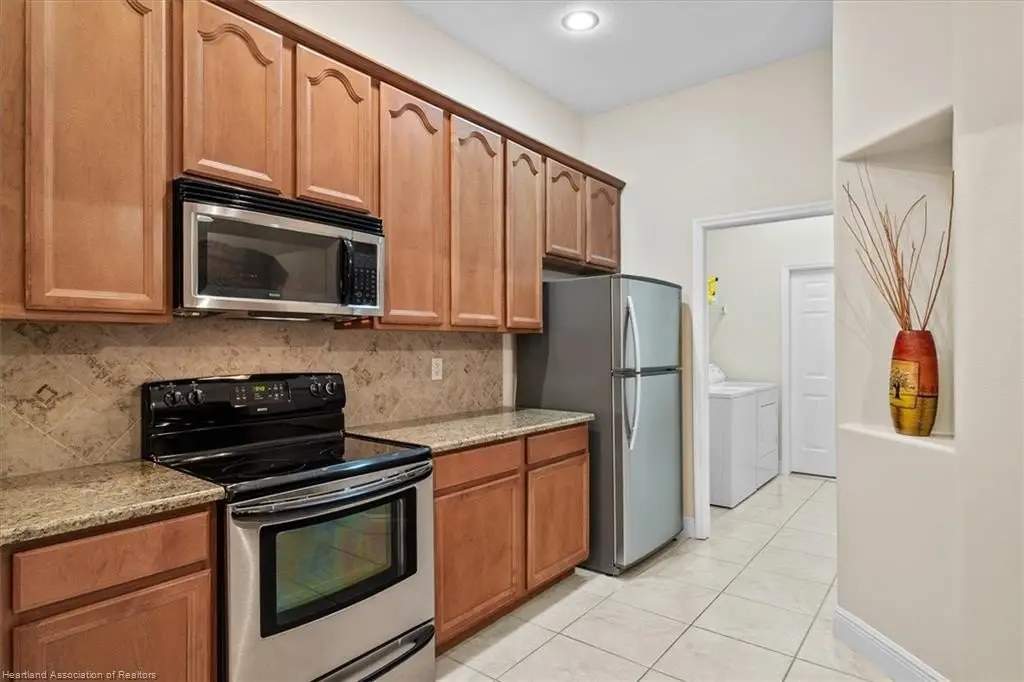
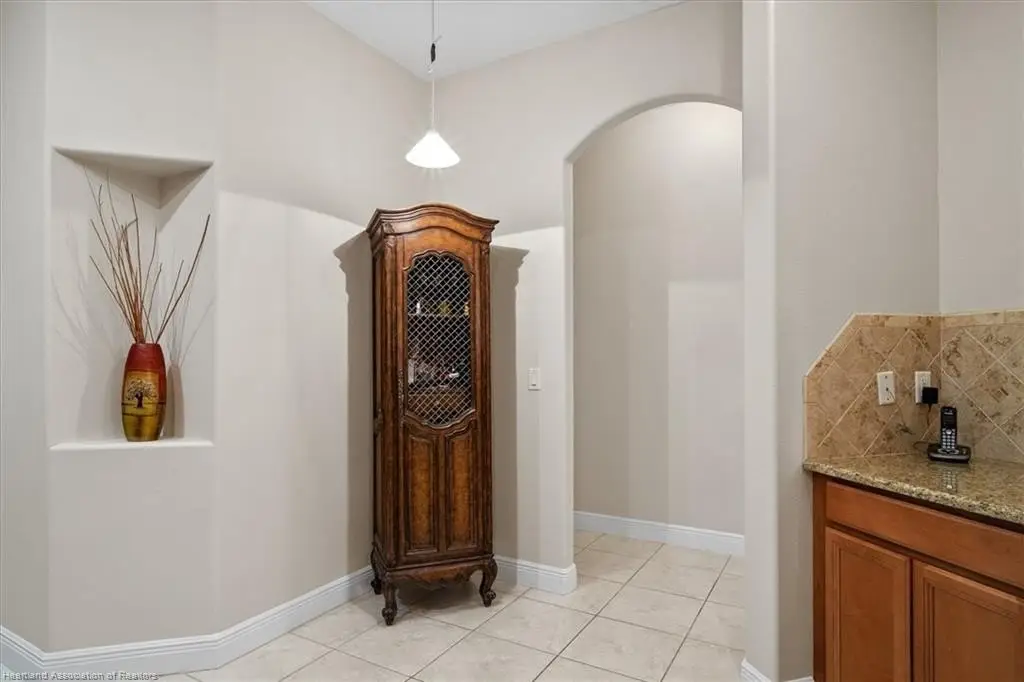
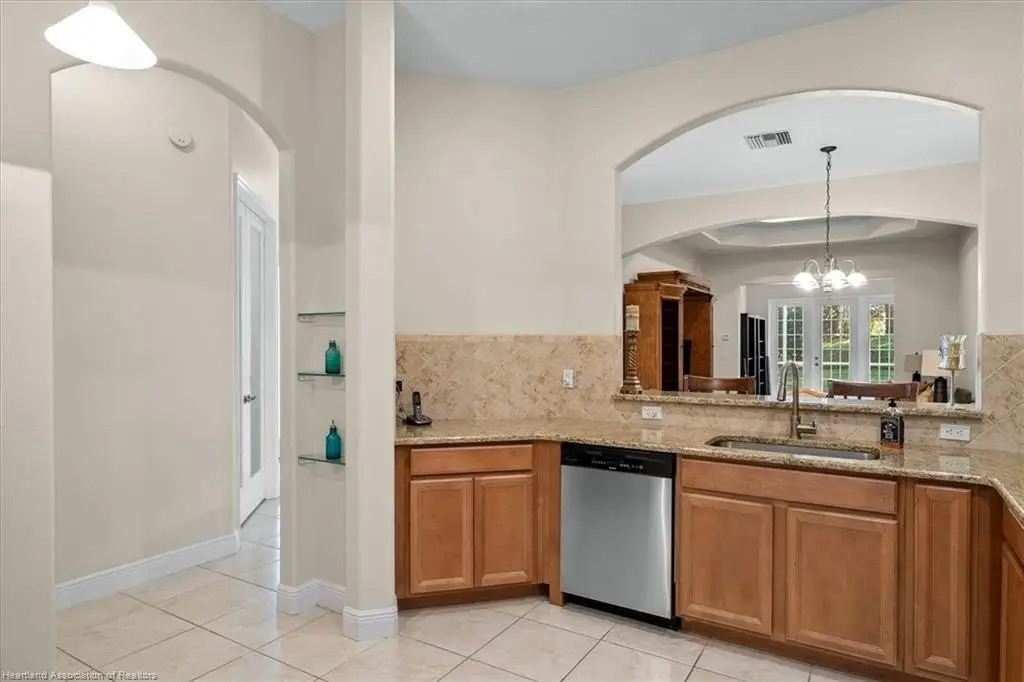
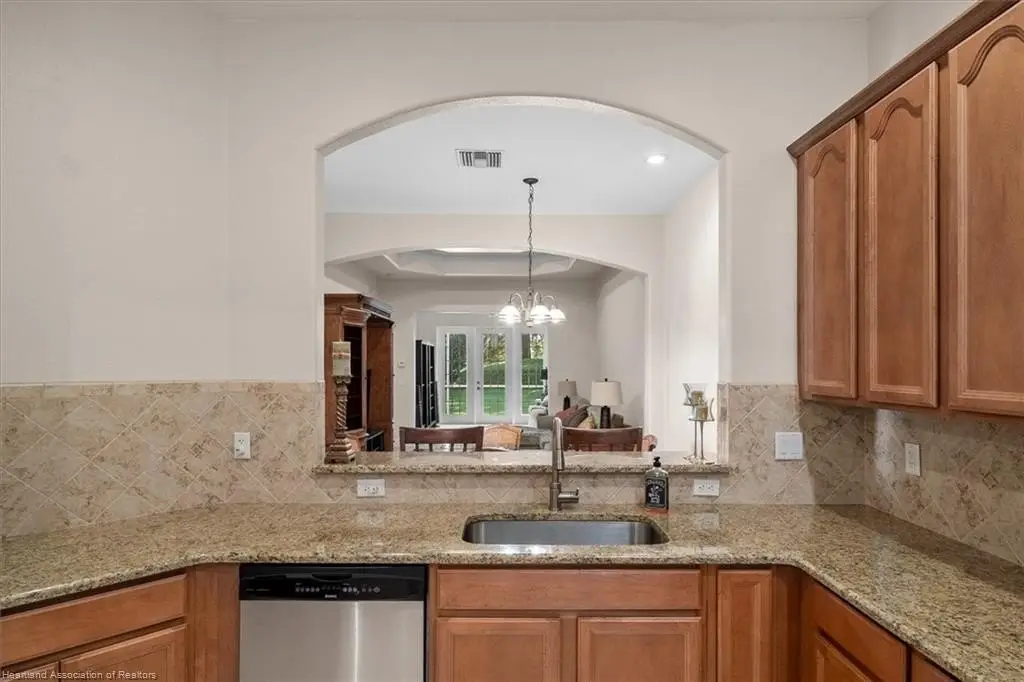
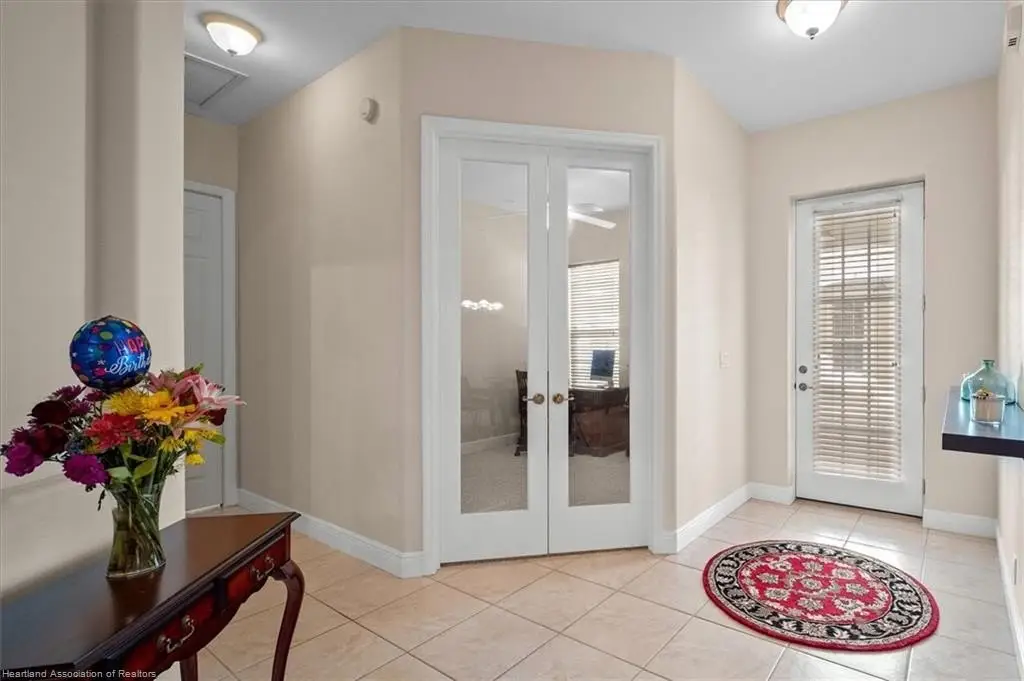
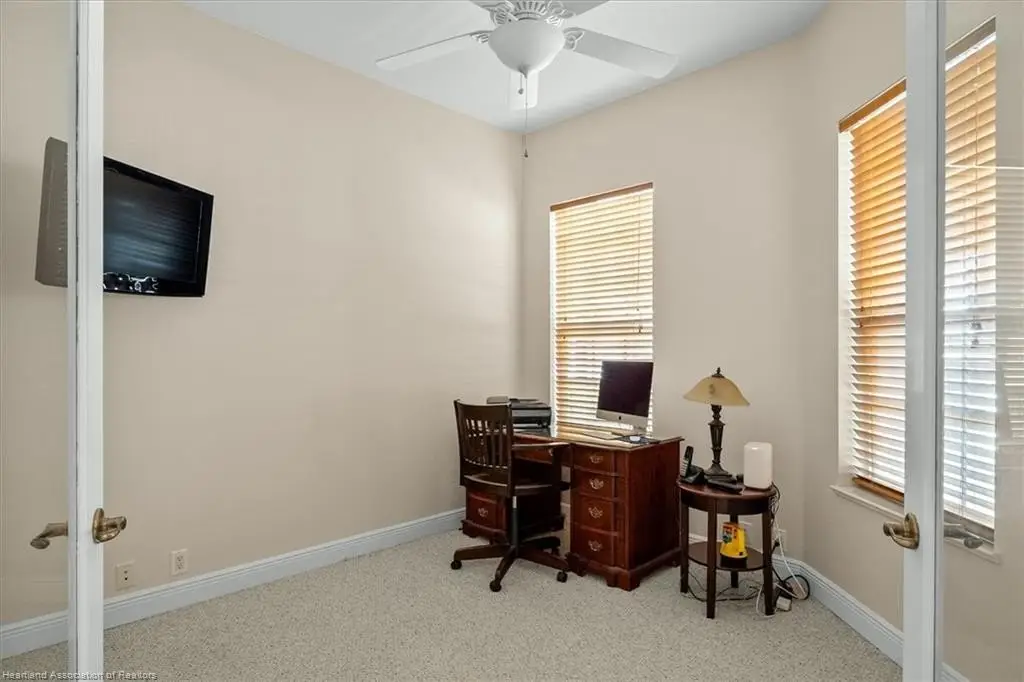
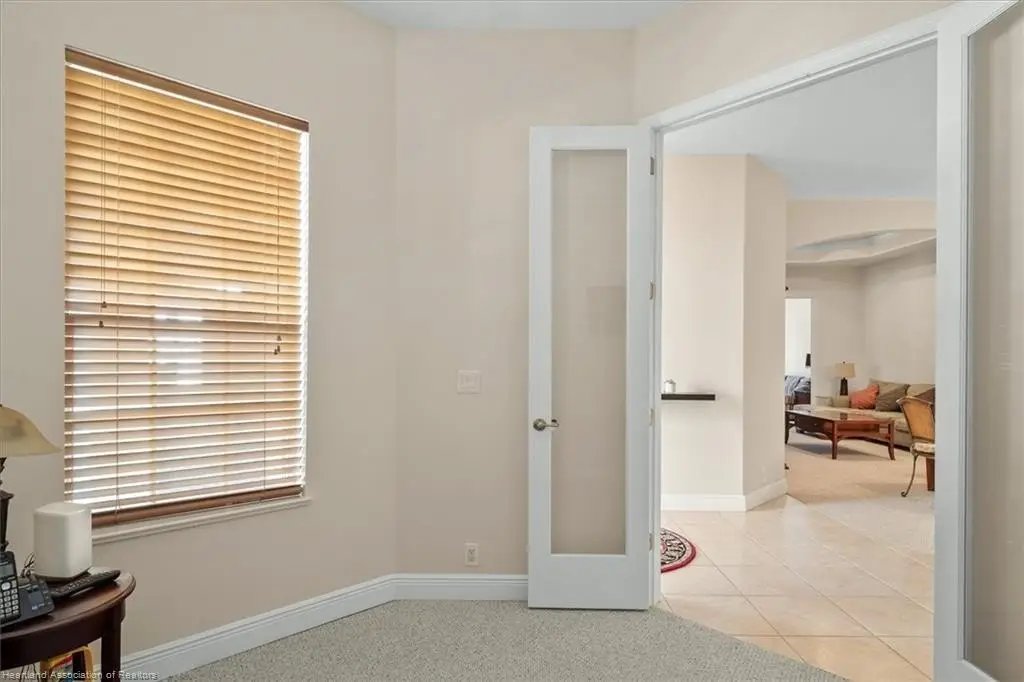
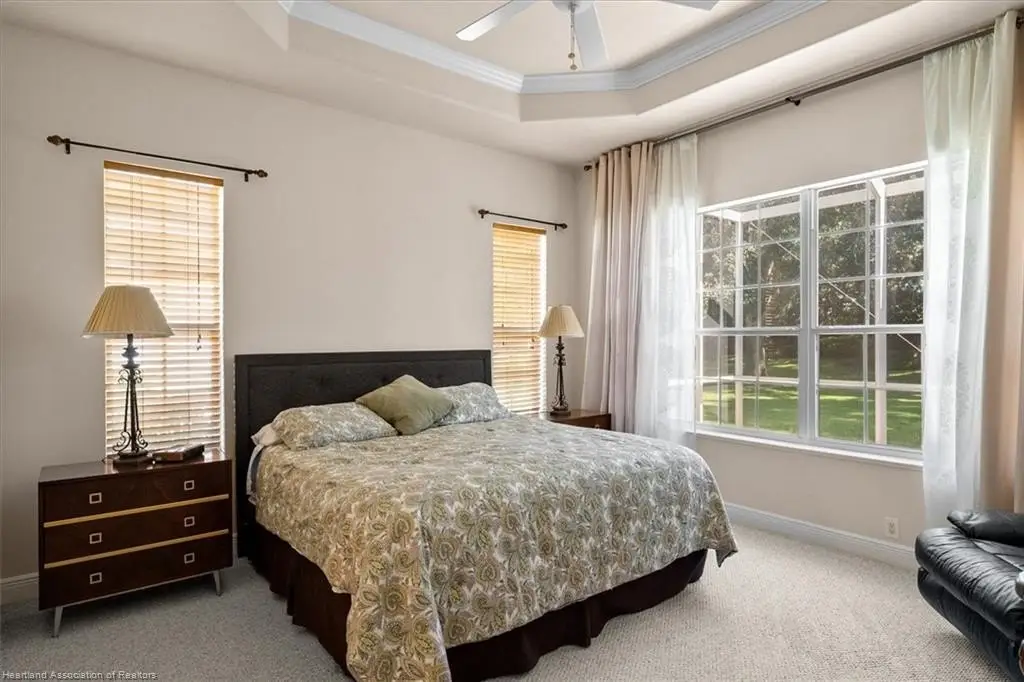
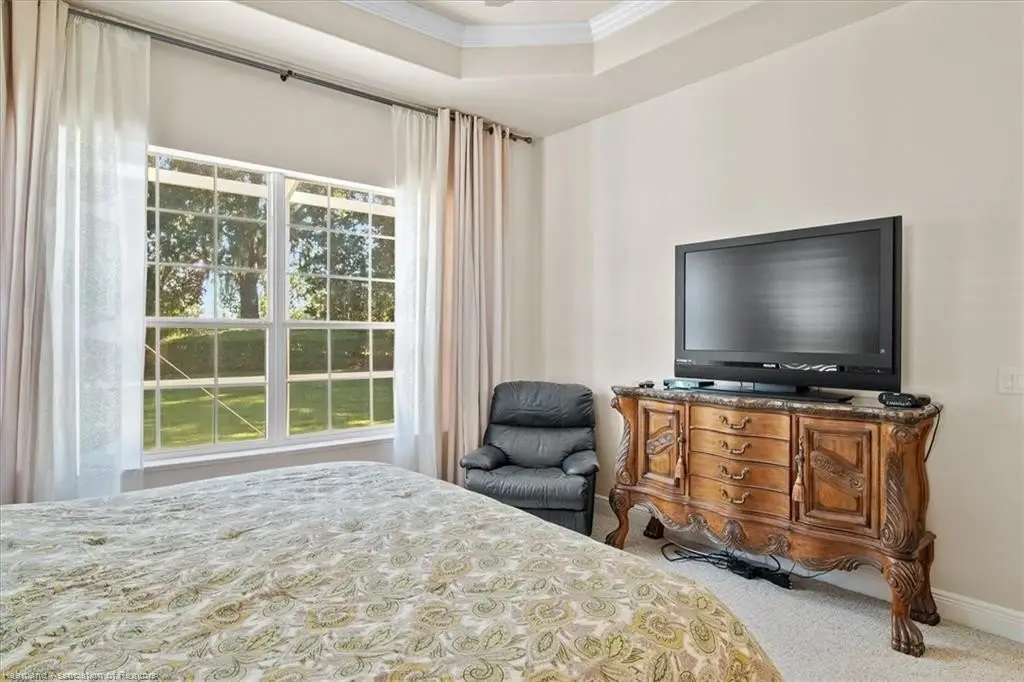
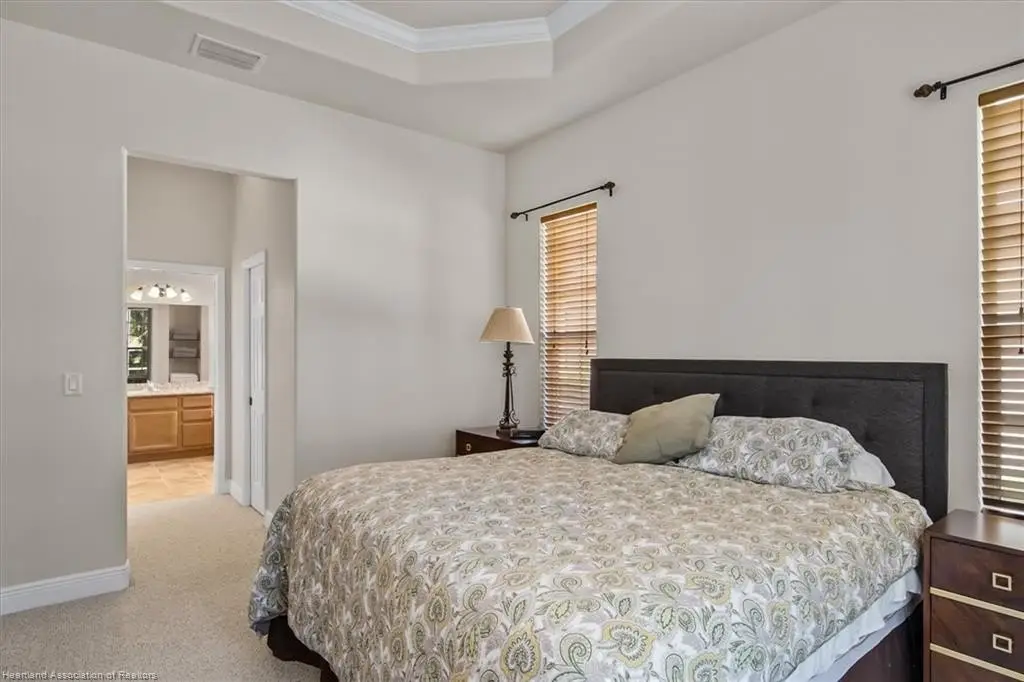
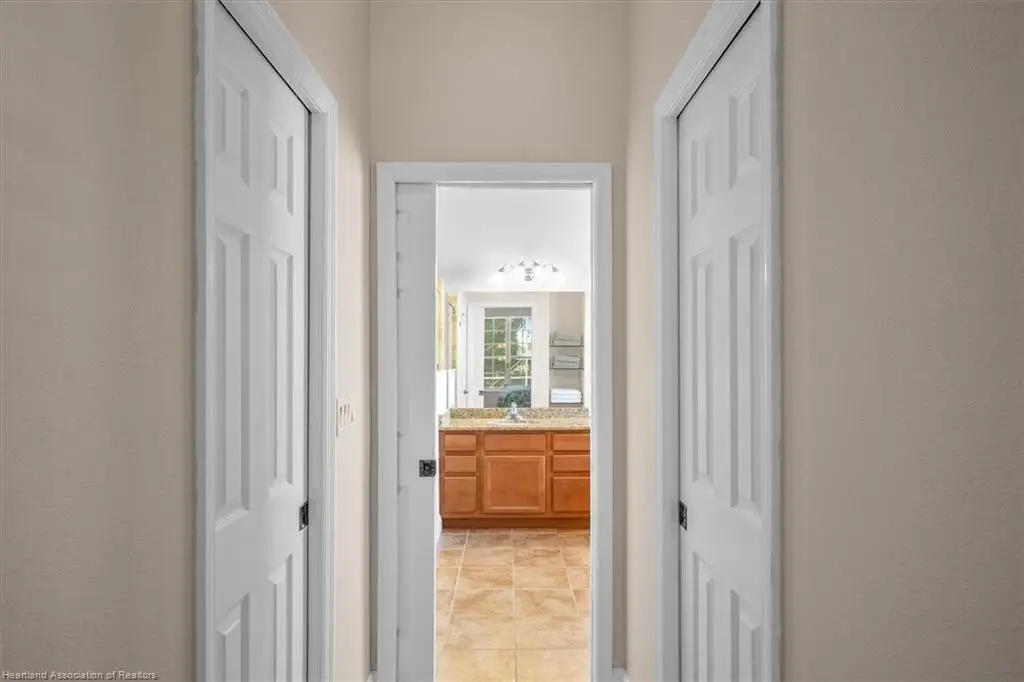
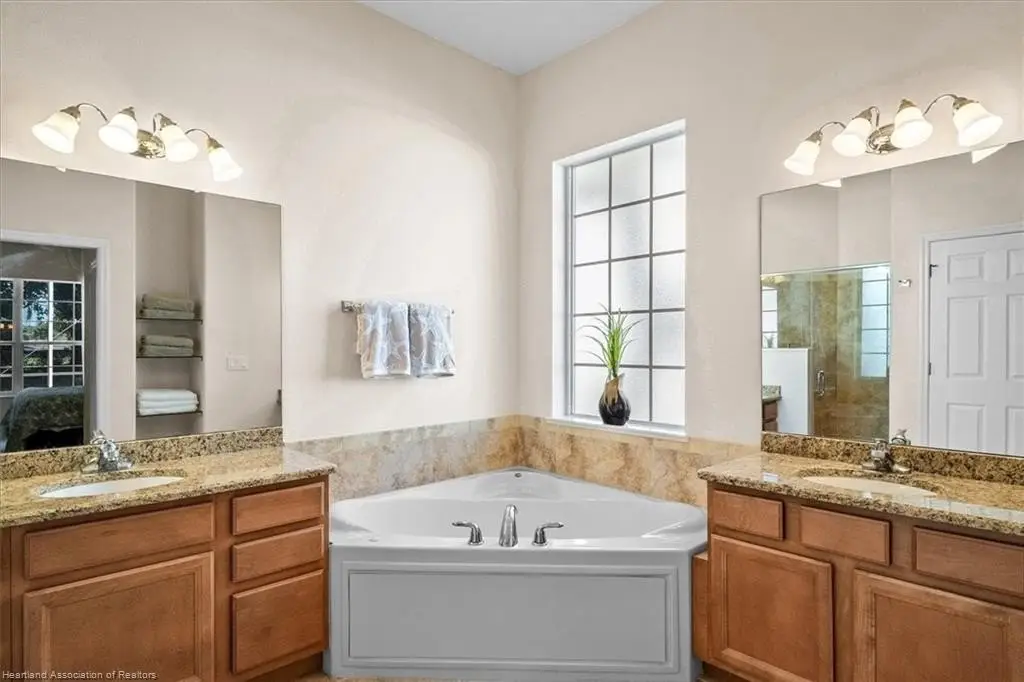
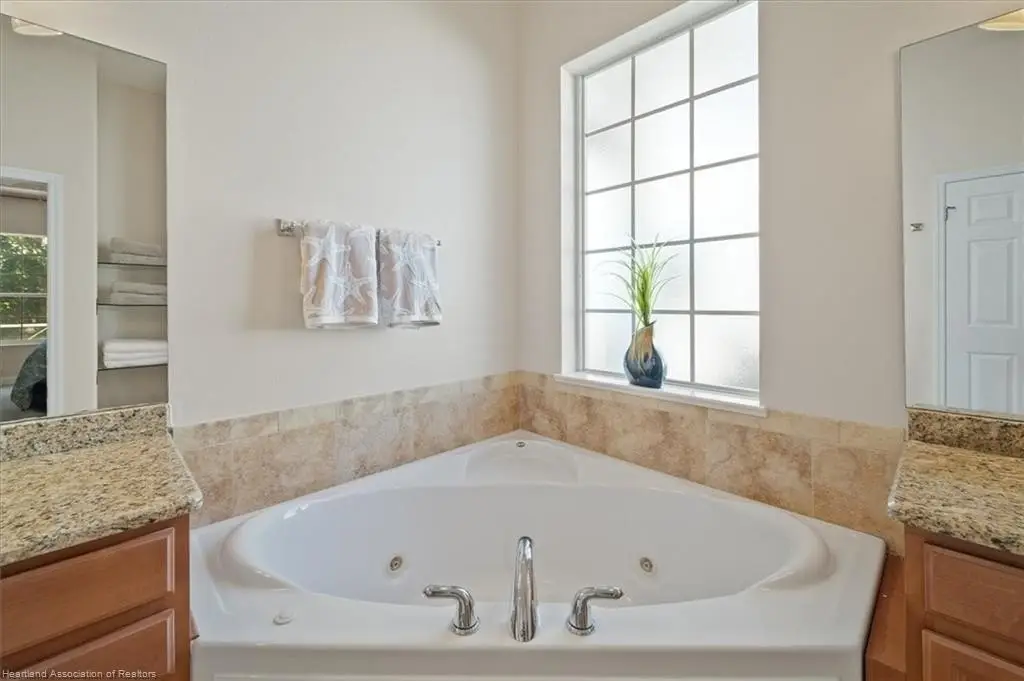
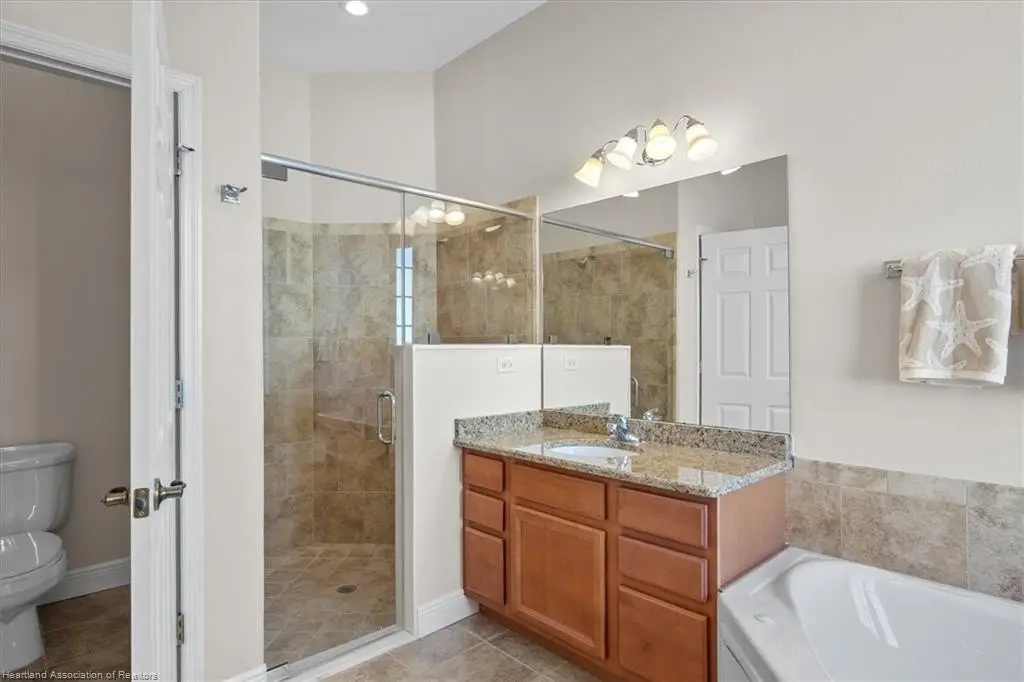
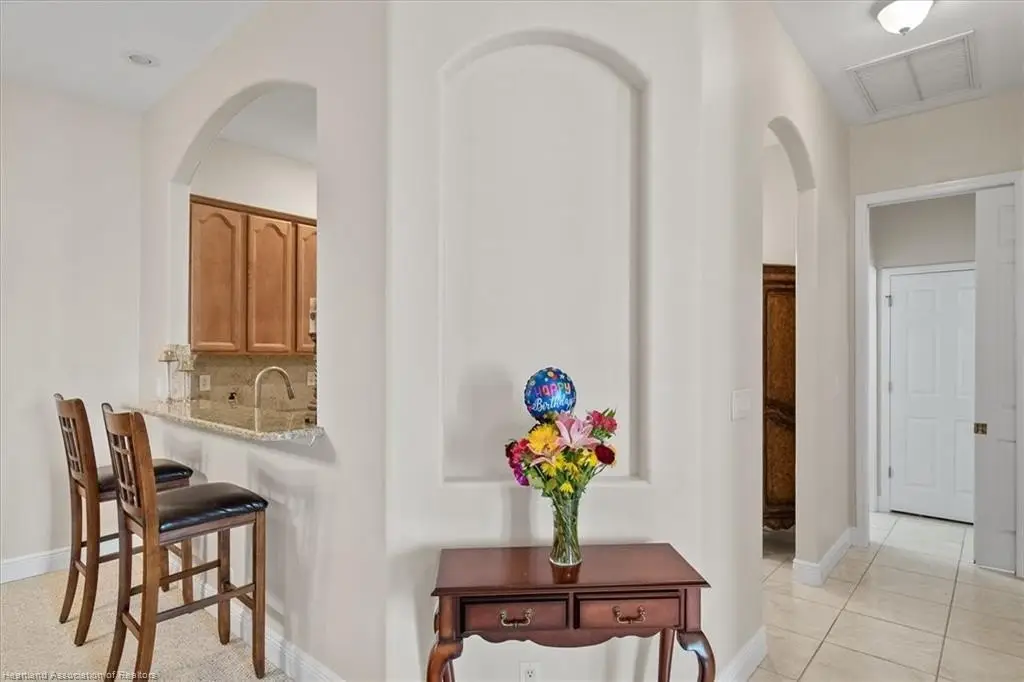
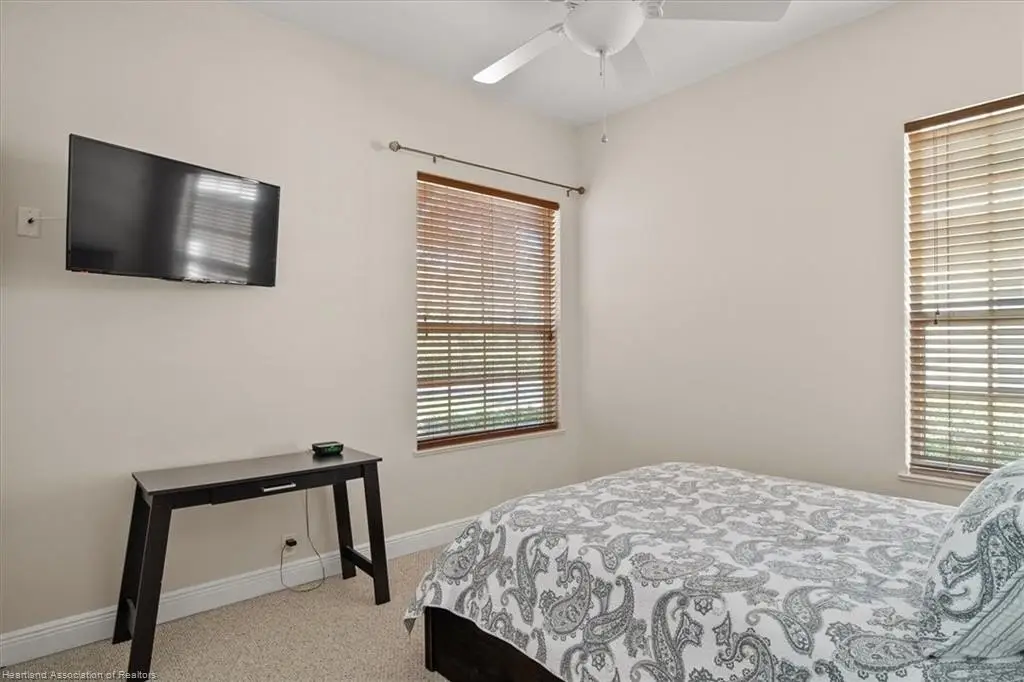
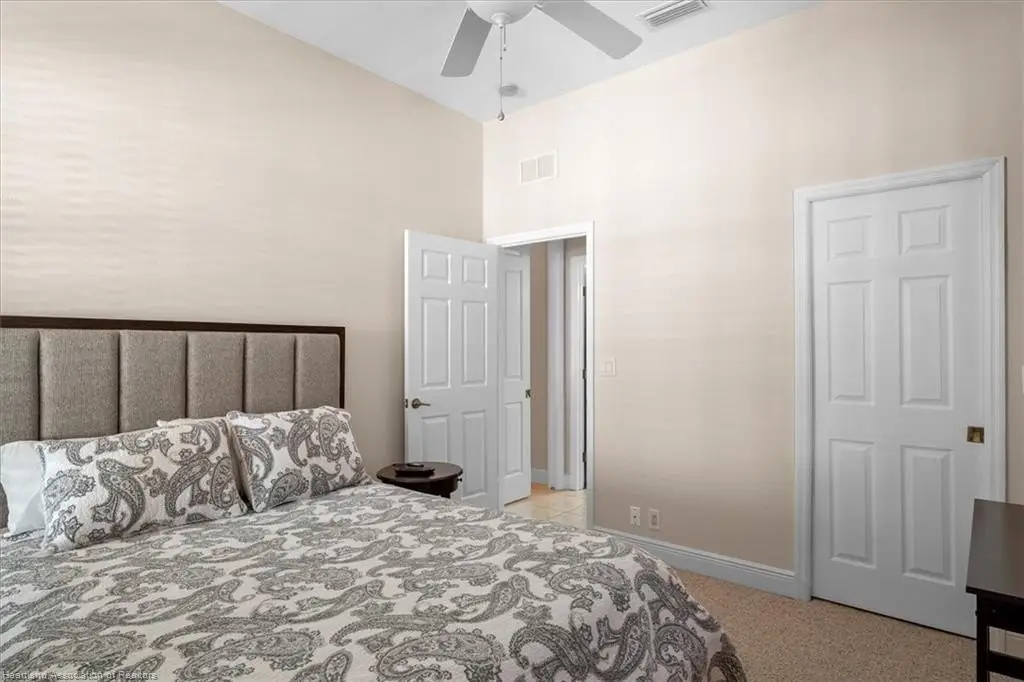
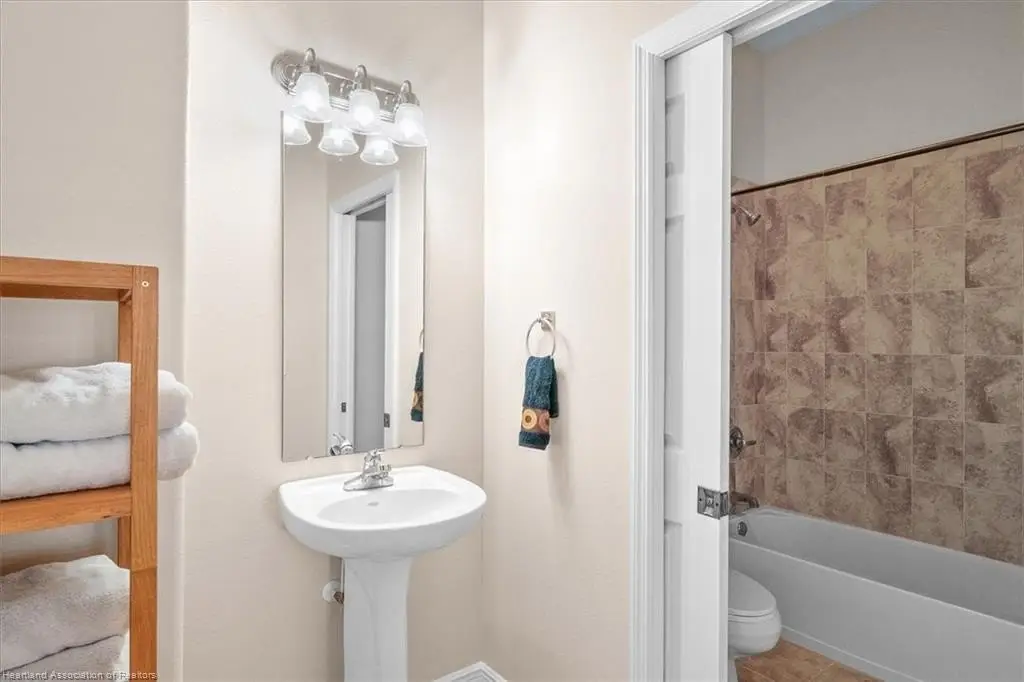
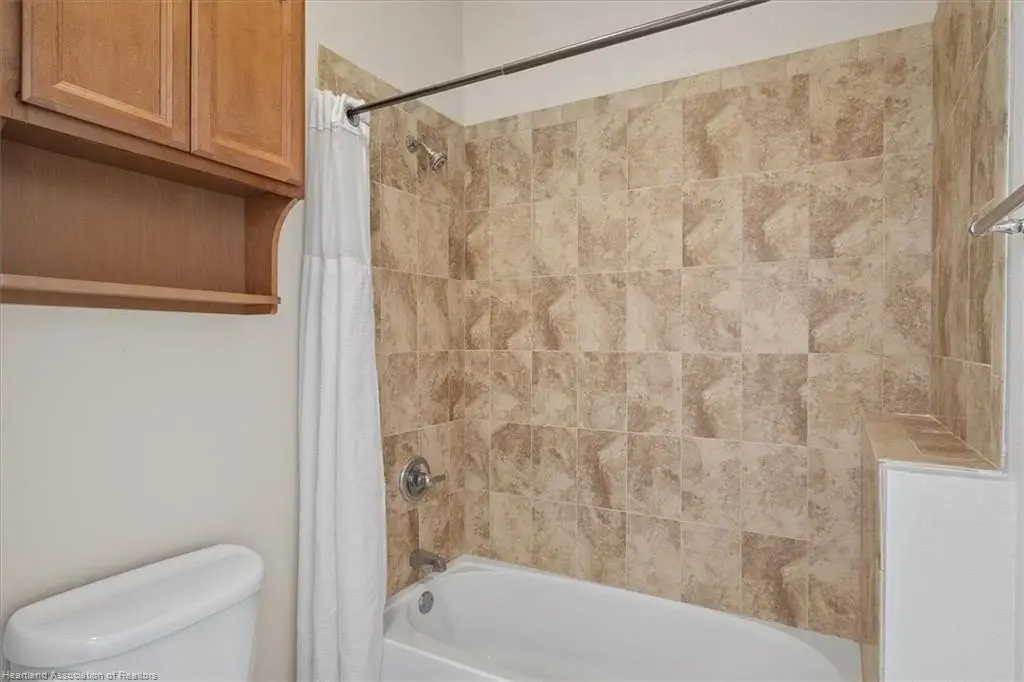
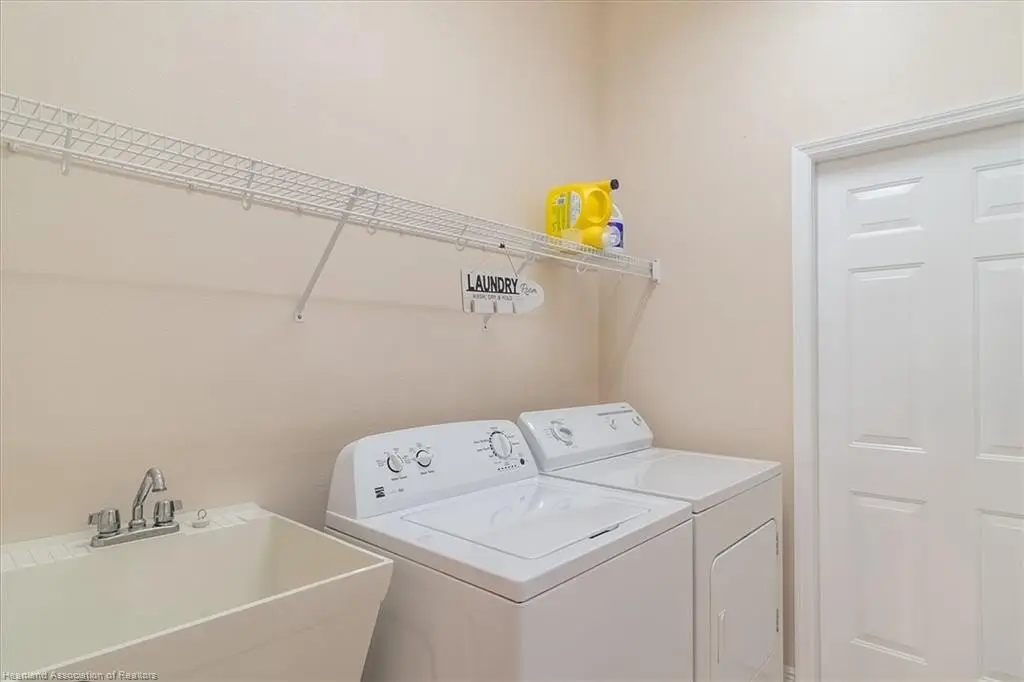
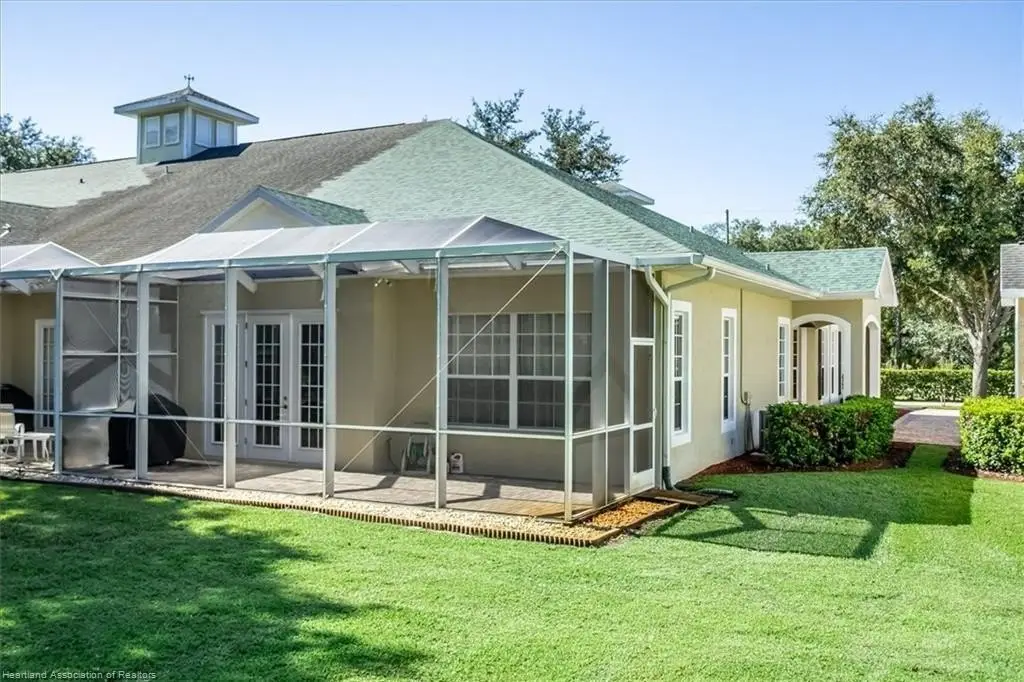
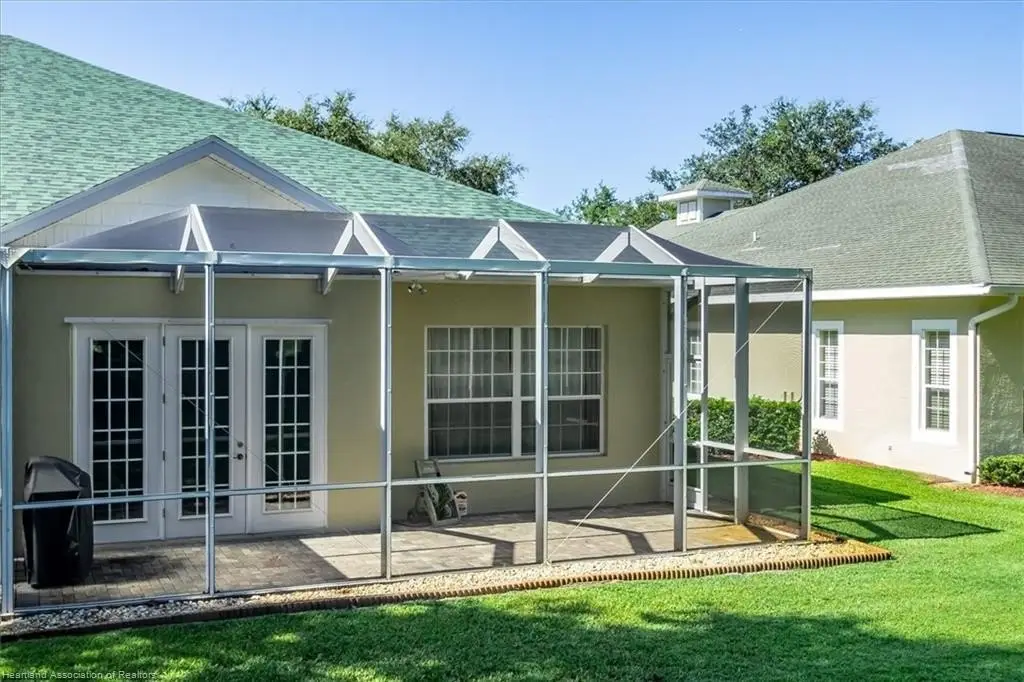
Located at 5333 Surrey Lane in Sebring, this well-maintained single-family villa offers an open, spacious floor plan with 10' ceilings and 8' doors. The interior includes a kitchen with tile flooring, rich wood cabinetry, granite countertops, a tile backsplash, and stainless steel appliances, plus a large breakfast bar. An arched opening connects the dining area to the living room, and a den with French doors leads to a spacious screened lanai. The primary suite includes tray ceilings, two walk-in closets, and an ensuite bath with a jetted soaking tub, walk-in shower, dual vanities, and a private water closet. Additional features include a versatile bonus room with French doors and an inside laundry room.
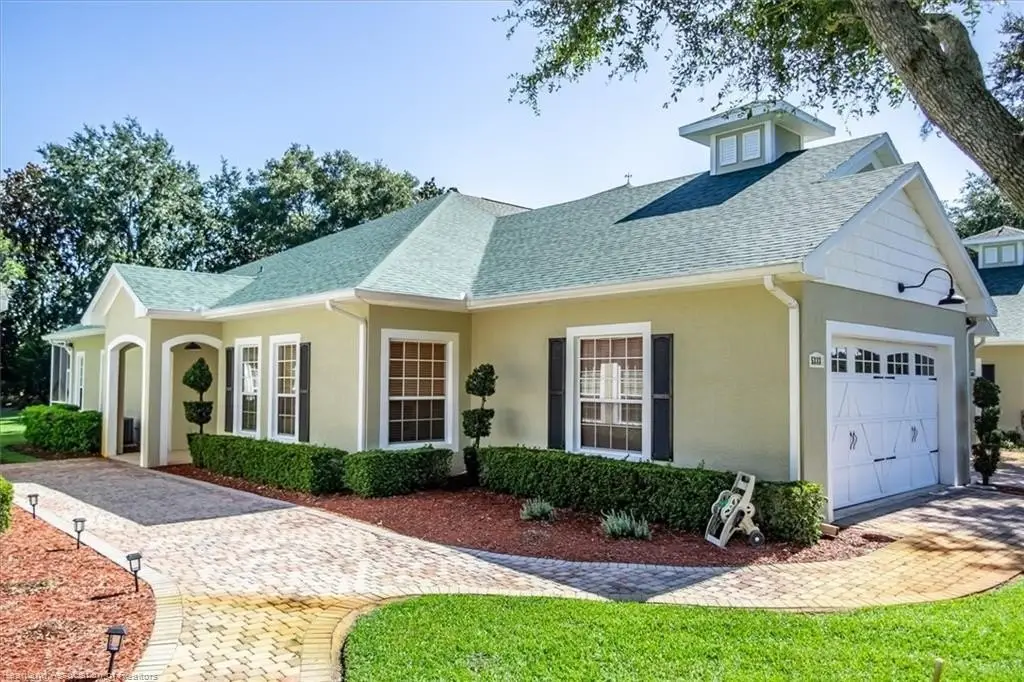
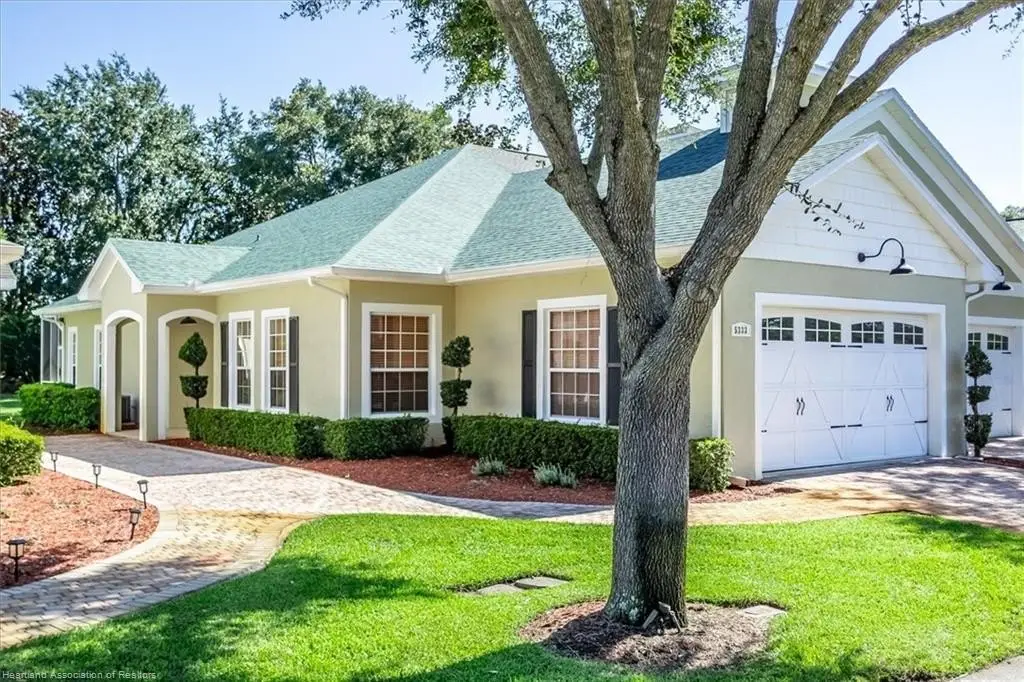
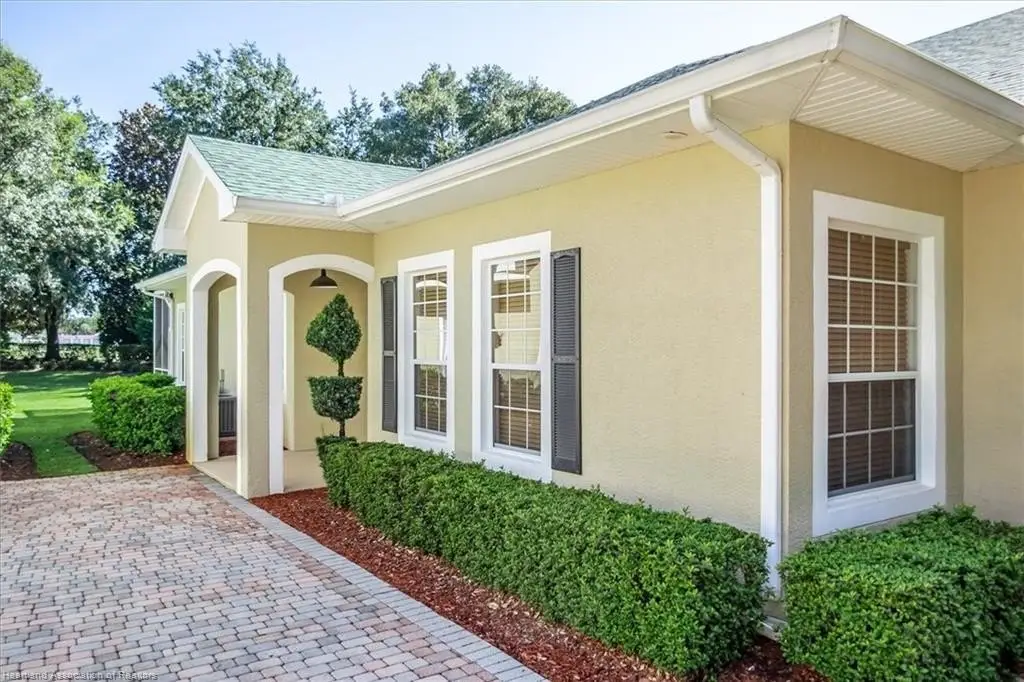
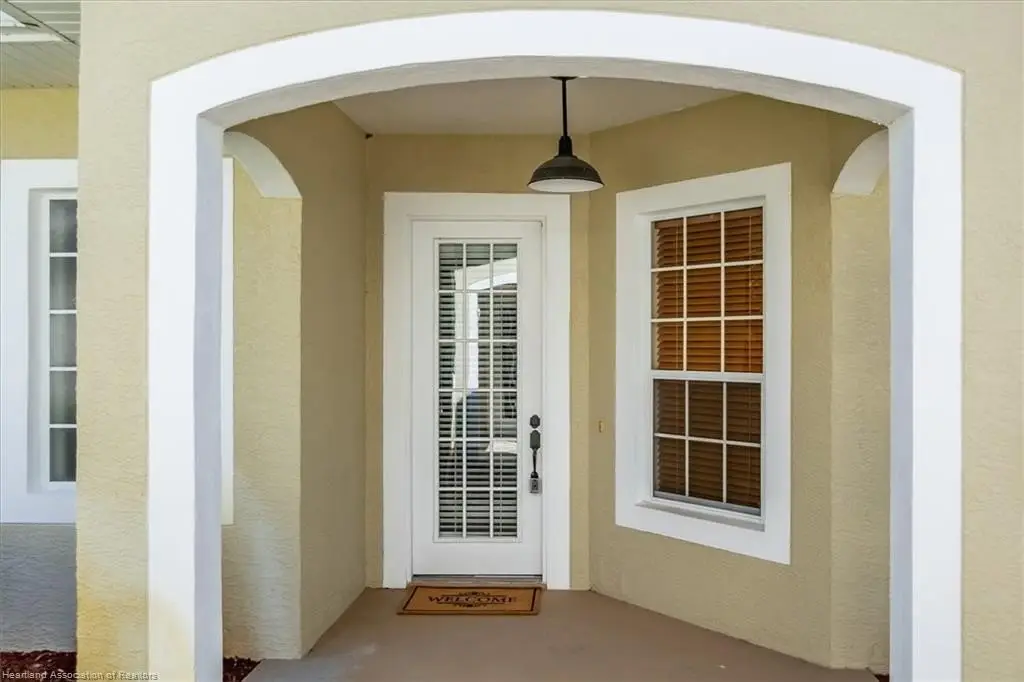
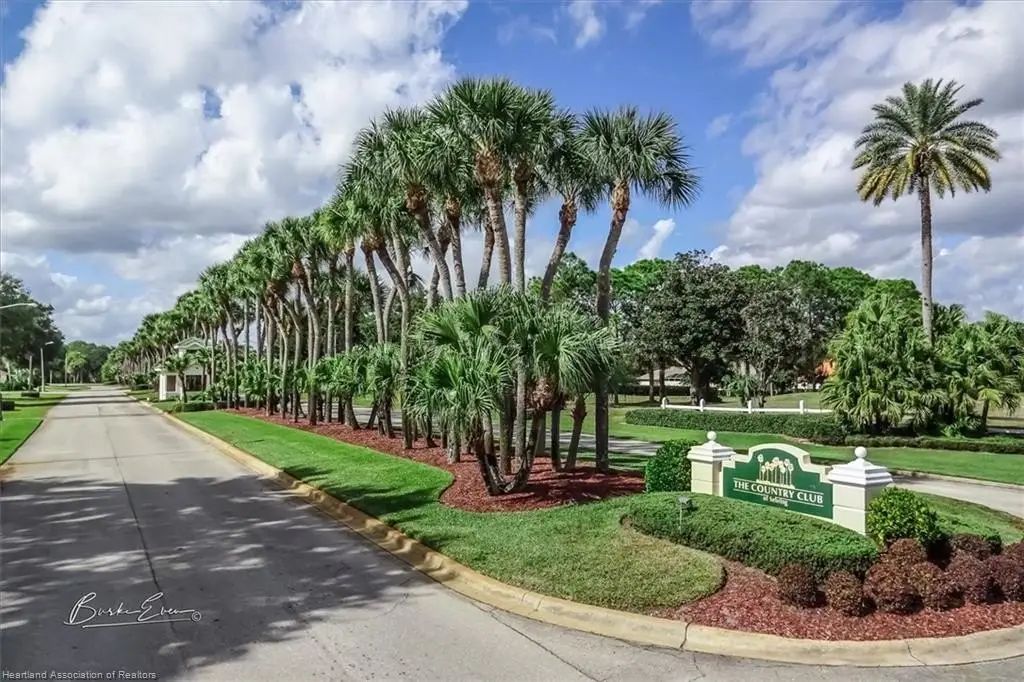
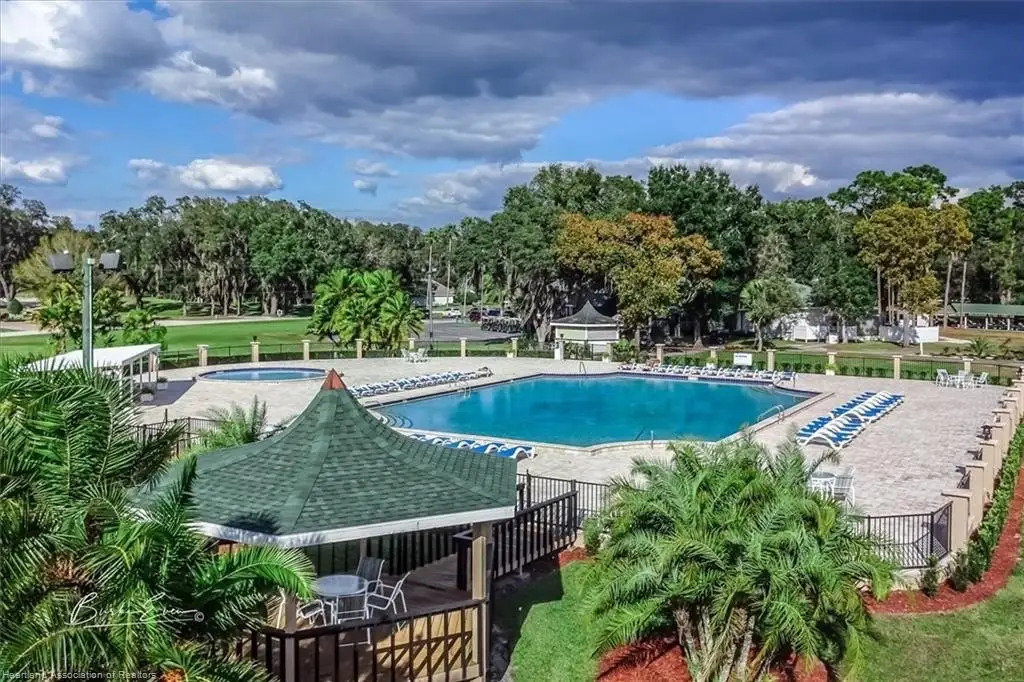
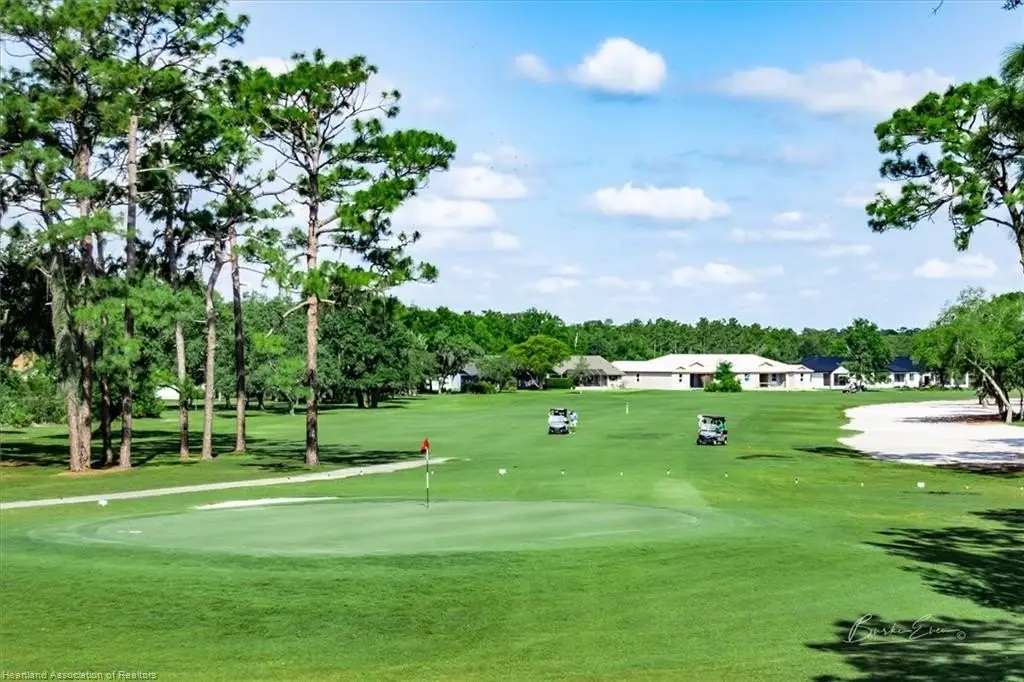
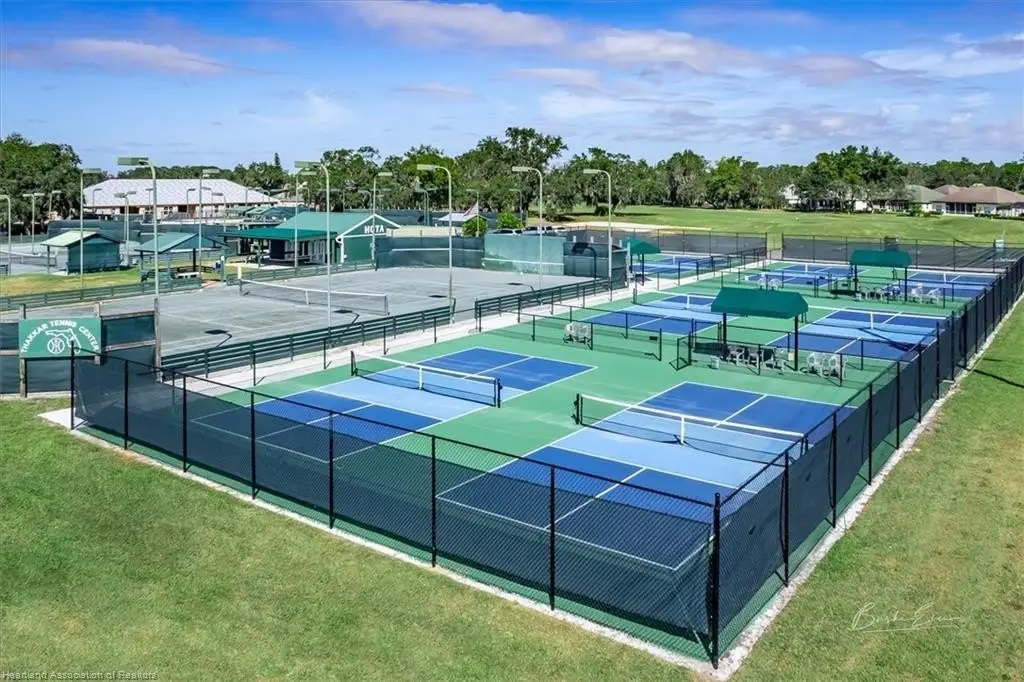
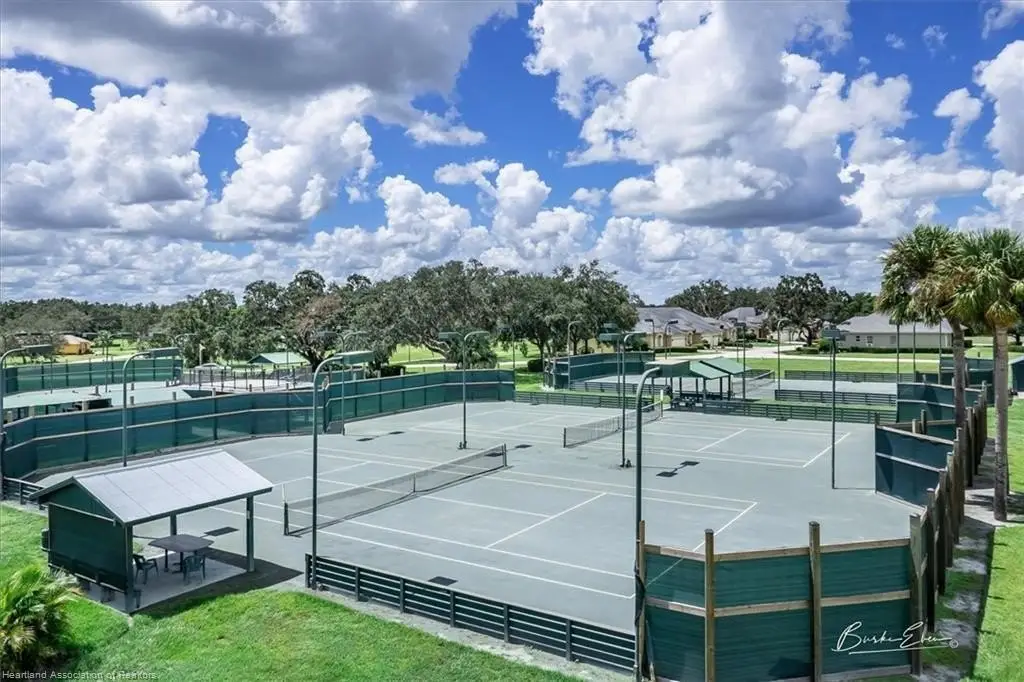
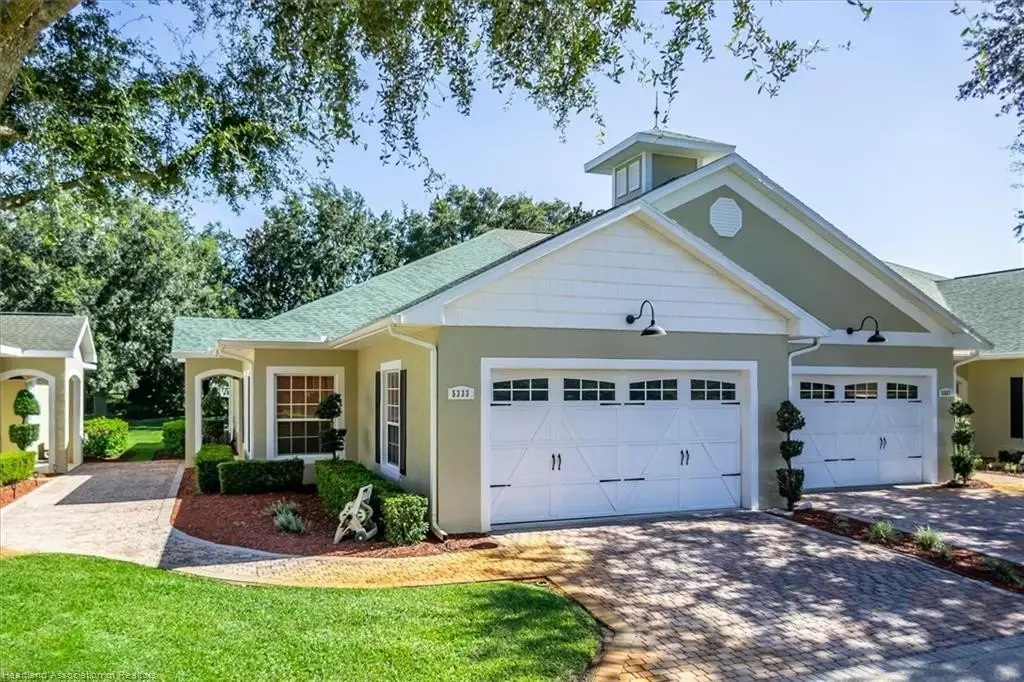
Outside, the home is presented with a covered front porch entry, a paver driveway and walkway, and a carriage-style garage door. The property is described as part of The Country Club of Sebring, with access to a community pool, golf course, pro shop, tennis and pickleball courts, and a restaurant.
The property is currently listed for sale in zoning R3FUD.
Outside, the home is presented with a covered front porch entry, a paver driveway and walkway, and a carriage-style garage door. The property is described as part of The Country Club of Sebring, with access to a community pool, golf course, pro shop, tennis and pickleball courts, and a restaurant.
The property is currently listed for sale in zoning R3FUD.
Key Highlights
- 2006‑built stucco villa with concrete block construction, shingle roof, and central A/C (central air and electric cooling)
- Open floor plan with 10' ceilings and 8' doors, plus carpet and tile flooring throughout
- Kitchen includes granite countertops, tile backsplash, stainless steel appliances, and a large breakfast bar
Financial Insights For Multifamily LT 5
Simulate Cap Rate and NOI
NOI Build-Up
- Vacancy
- income lost from leasable area expected to sit empty during the year — subtracted from gross rent.
- EGI (Effective Gross Income)
- gross rent minus vacancy losses — the realistic income before paying operating costs.
- OpEx (Operating Expenses)
- recurring costs to operate the property (property tax, insurance, utilities, maintenance, management) — excludes financing and capital improvements.
- NOI (Net Operating Income)
- income a property generates after operating costs but before financing and taxes.
| Component | $ | $/SF |
|---|---|---|
| Gross rent | $34.5k | $13.80 |
| − Vacancy | −$2.2k | −$0.90 |
| EGI | $32.2k | $12.90 |
| − OpEx | −$9.7k | −$3.87 |
| NOI | $22.6k | $9.03 |
2,497 SF · lease $13.80/SF/yr · vacancy 6.50% · expense 30.00%
Alternative Uses
Best Use
Multifamily LT 5
$322.2K
$281.9K – $375.9K
NOI $22,553 @ 7.0% cap · market cap 7.05%
Second Best
Apartment 5plus
$299.4K
$262.0K – $349.3K
NOI $20,958 @ 7.0% cap · market cap 6.55%
Theoretical Best
Office A
$519.5K
$454.6K – $606.1K
NOI $36,364 @ 7.0% cap · market cap 11.37%
Zoning and permitted uses should be independently verified with authorities.
Property Analytics
Property Profile
Location Intelligence
Current Use


Frequently Asked Questions
What type of property is this?
Duplex - Well-maintained villa with screened lanai, 10-foot ceilings, and a primary suite featuring two walk-in closets.
Where is this duplex located?
The property is located at 5333 Surrey Lane Sebring, FL.
What is the asking price?
The asking price for this property is $319,900.
What are key features of this property?
This property features: 2006‑built stucco villa with concrete block construction, shingle roof, and central A/C (central air and electric cooling); Open floor plan with 10' ceilings and 8' doors, plus carpet and tile flooring throughout; Kitchen includes granite countertops, tile backsplash, stainless steel appliances, and a large breakfast bar


