Two-Building Apartment
For Sale
$13,000,000
525 Dean Street, Brooklyn, NY 11217
Residential Income, Brooklyn, NY
Property Size13,628 SF
Lot Size0.14 Acres
Price / SF$953.92
Days on Market120
Property Features for 525 Dean Street
General Information
Property type
Residential Multi Family
Property subtype
Other
Zoning description
Multi-Family
Bedrooms
10
Rooms
Bedroom 9, Bedroom 8, Bedroom 6, Bedroom 5, Bedroom 3, Bedroom 2, Bedroom 7, Bedroom 1, Bedroom 10, Bedroom 4
Subdivision
Prospect Heights
View
City
Standard status
Active
Size
13,628 SF
Lot size
0.14 Acres
Listing Agency:
Tri State Commercial Realty LLC
Listed By:
Shlomi Bagdadi · License #10311204539
(718) 437-6100
Added: Jun 19
Changed: Oct 1
Last Checked: Oct 16 at 2:06PM
MLS# 11950155
Copyright © 2026 My State MLS. All rights reserved. All information provided by the listing agent/broker is deemed reliable but is not guaranteed and should be independently verified.

Ask AI about this property
Review the available facts, identify missing information and prepare questions for the agent.
Investment Insights
Based on property information with market context.
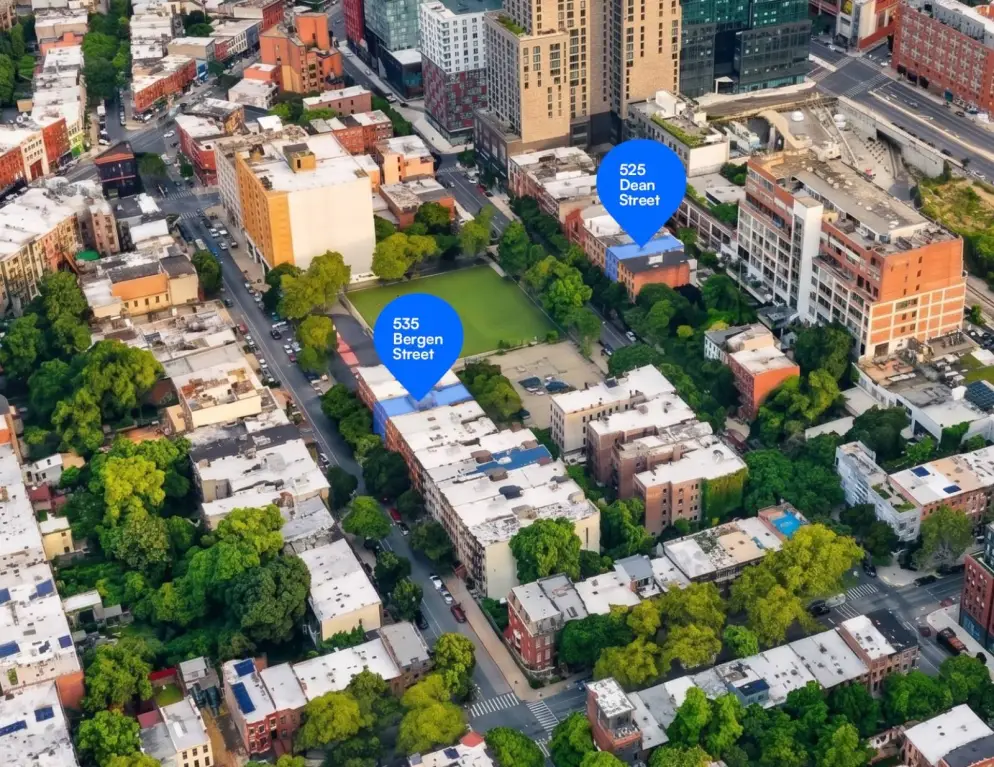
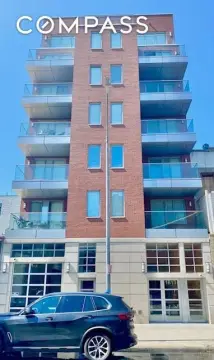
This apartment property comprises two four-story buildings with cellars, totaling 6,500 SF at 535 Bergen Street and 7,000 SF at 525 Dean Street. The buildings contain 8-10 residential units and were built in 1930. Upper levels include residential rooms, while the layouts also provide offices, reception areas, a kitchen, dining space, and communal areas. Both buildings are fully sprinklered and currently vacant.
An existing Certificate of Occupancy supports children's shelter use, reflecting the property's established institutional configuration. The buildings sit on separate 2,970 SF lots, each with 27 feet of width, and carry R6B zoning. Potential educational, community facility, residential, and institutional applications are identified in the source information, subject to approvals.
The property is located at 525 Dean Street and 535 Bergen Street in Brooklyn's Prospect Heights area, with access to the 2, 3, B, and Q subway lines and the LIRR at Atlantic Terminal. Prospect Park, Grand Army Plaza, the Brooklyn Museum, and Brooklyn Botanic Garden are within walking distance.
An existing Certificate of Occupancy supports children's shelter use, reflecting the property's established institutional configuration. The buildings sit on separate 2,970 SF lots, each with 27 feet of width, and carry R6B zoning. Potential educational, community facility, residential, and institutional applications are identified in the source information, subject to approvals.
The property is located at 525 Dean Street and 535 Bergen Street in Brooklyn's Prospect Heights area, with access to the 2, 3, B, and Q subway lines and the LIRR at Atlantic Terminal. Prospect Park, Grand Army Plaza, the Brooklyn Museum, and Brooklyn Botanic Garden are within walking distance.
Key Highlights
- Two four‑story buildings with cellars and 8‑10 residential units
- 6,500 SF building at 535 Bergen Street plus 7,000 SF building at 525 Dean Street
- Existing Certificate of Occupancy supporting children's shelter use
Financial Insights
Estimated NOI and Cap Rate
NOI / Yr
$416,049
Cap Rate
3.20%
Suggested Prices Based on Cap Rates
Cap Rate 5%
$8,320,980
$8.3M
Cap Rate 7%
$5,943,557
$5.9M
Cap Rate 9%
$4,622,767
$4.6M
Market Conditions
NOI Build-Up for 13,628 SF
Gross rent
$771.9K $56.64/SF
− Vacancy
−$15.4K −$1.13/SF
EGI
$756.5K $55.51/SF
− OpEx
−$340.4K −$24.98/SF
NOI
$416.0K $30.53/SF
Area
Brooklyn, NY
Vacancy
2.00%
Lease Rate
$56.64 /SF/Yr
Expense Ratio
45.00%
Simulate Cap Rate and NOI
Suggested Prices Based on Cap Rates
Cap Rate 5%
$8,320,980
Cap Rate 7%
$5,943,557
Cap Rate 9%
$4,622,767
Alternative Uses
Best Use
Apartment 5plus
$5.94M
$5.20M – $6.93M
NOI $416,049 @ 7.0% cap · market cap 3.20%
Second Best
—
—
no second resolved use
Theoretical Best
Specialty Retail
$11.28M
$9.87M – $13.16M
NOI $789,879 @ 7.0% cap · market cap 6.08%
Zoning and permitted uses should be independently verified with authorities.
How Realmo checks its estimates
Property Analytics
Unlock full access to Insights
Subscribe to Realmo Intelligence
Open Analytics
Current Use
Lease Details
10
Residential units
Yes
Sprinkler system
Yes
Highway access
Location Intelligence
Trade Area within ½ mile
8,517
Businesses Nearby
Explore this area
Business Placement
Demographics for 11217, NY
42,417
Population
21,590
Households
2
Avg Household Size
36
Median Age
73%
College-Educated
93%
High-School Grad
0.7 sq mi
ZIP Area
60,596
Density / Sq Mi
$158,314
Median Household Income
$95,067
Median Earnings
$2,800
Median Rent
$1,614,200
Median Home Value
Check the figures for this property
Cap Rate, Value Estimation, Potential NOI and more
View Realmo Analytics
Market
Vacancy Rate% for Multifamily in Northeast region




Frequently Asked Questions
What type of property is this?
Apartment building - Four-story Brooklyn buildings with residential rooms, shared facilities, and existing shelter-use approvals.
Where is this apartment building located?
The property is located at 525 Dean Street Brooklyn, NY.
What is the asking price?
The asking price for this property is $13,000,000.
What are key features of this property?
This property features: Two four‑story buildings with cellars and 8‑10 residential units; 6,500 SF building at 535 Bergen Street plus 7,000 SF building at 525 Dean Street; Existing Certificate of Occupancy supporting children's shelter use



