Legal 8-Bed Quadplex
For Sale
$533,500
5230 Schuyler St, Philadelphia, PA 19144
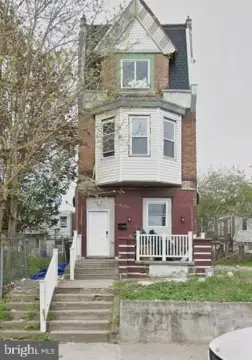
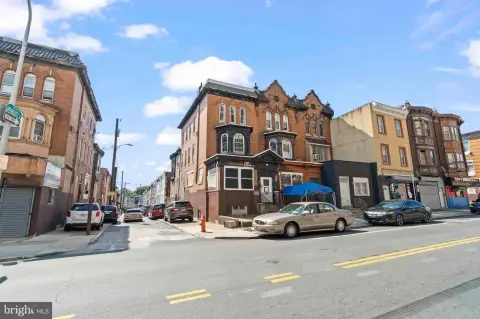
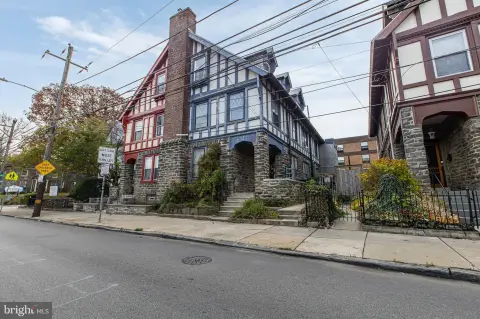
Turnkey legal quadplex with 8 bedrooms and 8 full baths, separate electric meters, and long-term tenants through 2026–2027.
Property Size3,100 SF
Price / SF$172.10
Days on Market124
Property Features for 5230 Schuyler St
General Information
Standard status
Active
Size
3,100 SF
Property subtype
Residential Income
Zoning
RM1
Occupancy
100%
Net Operating Income
$40,985
Additional Details
Cap Rate
7.5%
Highway Access
Yes
Multifamily Units
4
Taxes and HOA fees
Annual Taxes
$4,928
Amenities
Window Unit(s)
Radiant, Natural Gas
Dishwasher, Dryer, Refrigerator, Cooktop, Washer
Other
Building Details
Building Size
3,100 SF
Year Built
1900
Tenancy
Multi
Listing Agency:
RE/MAX Plus
Listed By:
Toma Holovatskyy · License #PARS345287
(484) 868-9234
Source:
Evrealestate
Added: Jun 22
Changed: Oct 15
Last Checked: Oct 20 at 8:39PM
Displayed information is deemed reliable but is not guaranteed and should be independently verified. All listing content including descriptions, pricing, images are the copyrighted material of RE/MAX Plus

Ask AI about this property
Review the available facts, identify missing information and prepare questions for the agent.
Investment Insights
Based on property information with market context.
This fully occupied, legal quadplex offers an 8-bed and 8-bath layout with separate electric meters for the units. The basement includes 2 bedrooms and 2 bathrooms and features stainless steel appliances, a bar area, two fireplaces, a washer and dryer, and renovated finishes including updated bathrooms. Unit 1 is a 3-bedroom and 3-bath home with backyard access and in-unit washer/dryer. Unit 2F provides 1 bedroom and 1 bathroom, and Unit 2R offers 2 bedrooms and 2 bathrooms; both second-floor units have backyard access but do not include washer/dryer.
The property is described as having an active rental license and is near Queen Lane train station. It is also noted to be close to William Penn Charter School, Germantown Friends School field, Thomas Jefferson East Falls campus, and provides quick access to Route 1 and I-76.
Tenants have been in place since 2023–2024. Lease end dates listed include 06/30/2027 for the basement and Unit 1, 06/30/2027 for Unit 2F, and 11/30/2026 for Unit 2R, which may renew. Annual gross income is reported as $60,636, with the owner paying gas heating and water, as well as insurance expenses.
The property is described as having an active rental license and is near Queen Lane train station. It is also noted to be close to William Penn Charter School, Germantown Friends School field, Thomas Jefferson East Falls campus, and provides quick access to Route 1 and I-76.
Tenants have been in place since 2023–2024. Lease end dates listed include 06/30/2027 for the basement and Unit 1, 06/30/2027 for Unit 2F, and 11/30/2026 for Unit 2R, which may renew. Annual gross income is reported as $60,636, with the owner paying gas heating and water, as well as insurance expenses.
Key Highlights
- Legal quadplex with 8 beds and 8 full baths in a 1900‑built property
- Fully occupied with long‑term tenants in place through 2026–2027; leases end 06/30/2027 (basement), 09/30/2027 (Unit 1), 06/30/2027 (Unit 2F), and 11/30/2026 (Unit 2R)
- Annual gross income of $60,636 and NOI of $40,985, reflecting an estimated 7.5% cap rate
Financial Insights
Estimated NOI and Cap Rate
NOI / Yr
$48,761
Cap Rate
9.14%
Suggested Prices Based on Cap Rates
Cap Rate 5%
$975,220
$975.2K
Cap Rate 7%
$696,586
$696.6K
Cap Rate 9%
$541,789
$541.8K
Market Conditions
NOI Build-Up for 3,100 SF
Gross rent
$94.1K $30.36/SF
− Vacancy
−$5.5K −$1.76/SF
EGI
$88.7K $28.60/SF
− OpEx
−$39.9K −$12.87/SF
NOI
$48.8K $15.73/SF
Area
Philadelphia, PA
Vacancy
5.80%
Lease Rate
$30.36 /SF/Yr
Expense Ratio
45.00%
Simulate Cap Rate and NOI
Suggested Prices Based on Cap Rates
Cap Rate 5%
$975,220
Cap Rate 7%
$696,586
Cap Rate 9%
$541,789
Alternative Uses
Best Use
Multifamily LT 5
$755.7K
$661.3K – $881.7K
NOI $52,901 @ 7.0% cap · market cap 9.92%
Second Best
Apartment 5plus
$696.6K
$609.5K – $812.7K
NOI $48,761 @ 7.0% cap · market cap 9.14%
Theoretical Best
—
—
same as Best Use
Zoning and permitted uses should be independently verified with authorities.
How Realmo checks its estimates
Property Analytics
Unlock full access to Insights
Subscribe to Realmo Intelligence
Open Analytics
Lease Details
4
Residential units
100%
Occupancy
Multi-tenant
Tenancy
Yes
Highway access
Location Intelligence
Trade Area within ½ mile
923
Businesses Nearby
Explore this area
Business Placement
Demographics for 19144, PA
44,481
Population
23,583
Households
1.9
Avg Household Size
37
Median Age
35%
College-Educated
90%
High-School Grad
3.6 sq mi
ZIP Area
12,356
Density / Sq Mi
$45,727
Median Household Income
$36,020
Median Earnings
$1,110
Median Rent
$224,600
Median Home Value
Check the figures for this property
Cap Rate, Value Estimation, Potential NOI and more
View Realmo Analytics
Market
Vacancy Rate% for Multifamily in Northeast region






Frequently Asked Questions
What type of property is this?
Quadplex - Turnkey legal quadplex with 8 bedrooms and 8 full baths, separate electric meters, and long-term tenants through 2026–2027.
Where is this quadplex located?
The property is located at 5230 Schuyler St Philadelphia, PA.
What is the asking price?
The asking price for this property is $533,500.
What are key features of this property?
This property features: Legal quadplex with 8 beds and 8 full baths in a 1900‑built property; Fully occupied with long‑term tenants in place through 2026–2027; leases end 06/30/2027 (basement), 09/30/2027 (Unit 1), 06/30/2027 (Unit 2F), and 11/30/2026 (Unit 2R); Annual gross income of $60,636 and NOI of $40,985, reflecting an estimated 7.5% cap rate


