Office-Warehouse Investment
For Sale
Contact for pricing
5228 US-421, Wilmington, NC 28401
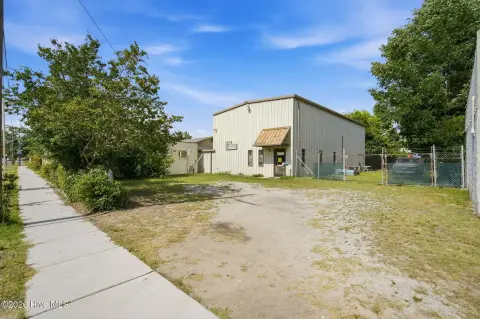
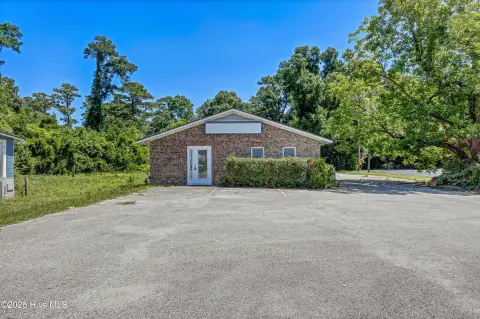
Well-appointed office and warehouse space on a sizable site, currently fully occupied by a single logistics-related tenant.
Property Size32,000 SF
Lot Size2.80 Acres
Days on Market104
Property Features for 5228 US-421
General Information
Standard status
Active
Size
32,000 SF
Lot size
2.80 Acres
Property subtype
INDUSTRIAL
Occupancy
100%
Building Details
Year Built
1987
Tenancy
Single
Listing Agency:
BlueCoast Commercial, LLC
(910) 427-0000
Listed By:
Connor Bennett
(910) 443-5368
Source:
Mullarkeycreg
Added: Jun 23
Changed: Oct 2
Last Checked: Oct 4 at 6:22AM
Displayed information is deemed reliable but is not guaranteed and should be independently verified. All listing content including descriptions, pricing, images are the copyrighted material of BlueCoast Commercial, LLC
Investment Insights
Based on property information with market context.
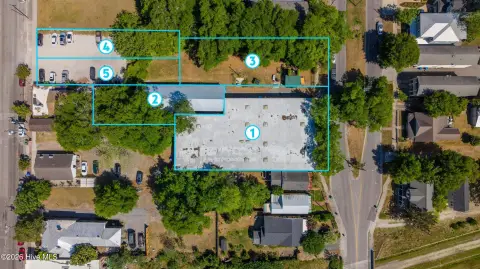
This offering combines well-appointed office space with warehouse distribution space in a single, cohesive property. The site totals approximately +/-32,000 square feet of improvements on roughly +/-2.8 acres, with ample rear acreage that may support additional outdoor storage needs or future development options. The property is 100% occupied by one tenant.
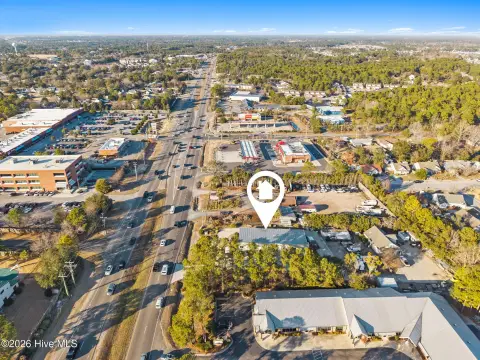
Located at 5228 US-421 in Wilmington, North Carolina, the facility sits within an industrial corridor described as one of Southeastern North Carolina’s most active. The public remarks also reference regional logistics growth tied to ongoing port expansion and last-mile and regional distribution demand.
For buyers looking for an operational asset, the property is currently leased and occupied by Miracle Movers, an established local moving and logistics operator in the Wilmington market since 2012. The tenant operates multiple locations across North and South Carolina, bringing a regional footprint to the business. Please contact the listing broker to review lease terms and coordinate showings; the tenant should not be disturbed and all tours must be arranged through the broker.
Located at 5228 US-421 in Wilmington, North Carolina, the facility sits within an industrial corridor described as one of Southeastern North Carolina’s most active. The public remarks also reference regional logistics growth tied to ongoing port expansion and last-mile and regional distribution demand.
For buyers looking for an operational asset, the property is currently leased and occupied by Miracle Movers, an established local moving and logistics operator in the Wilmington market since 2012. The tenant operates multiple locations across North and South Carolina, bringing a regional footprint to the business. Please contact the listing broker to review lease terms and coordinate showings; the tenant should not be disturbed and all tours must be arranged through the broker.
Key Highlights
- Approximately +/-32,000 SF of well‑appointed office and warehouse space
- About +/-2.8 acres with rear acreage for outdoor storage or potential future development
- 100% occupied by a single logistics‑related tenant (Miracle Movers)
Property Analytics
Unlock full access to Insights
Subscribe to Realmo Intelligence
Open Analytics
Current Use
Lease Details
100%
Occupancy
Single-tenant
Tenancy
Location Intelligence
Trade Area within ½ mile
28
Businesses Nearby
Well-served
Demand for This Use
Explore this area
Business Placement
Demographics for 28401, NC
22,204
Population
13,017
Households
1.7
Avg Household Size
41
Median Age
34%
College-Educated
88%
High-School Grad
31.0 sq mi
ZIP Area
716
Density / Sq Mi
$52,159
Median Household Income
$35,739
Median Earnings
$1,183
Median Rent
$263,000
Median Home Value
Check the figures for this property
Cap Rate, Value Estimation, Potential NOI and more
View Realmo Analytics
Market
Vacancy Rate% for Industrial in South region

Questions? Ask Rey
Realmo’s AI knows this listing — price, zoning, demand, history. Ask anything.





Frequently Asked Questions
What type of property is this?
Flex space - Well-appointed office and warehouse space on a sizable site, currently fully occupied by a single logistics-related tenant.
Where is this flex space located?
The property is located at 5228 US-421 Wilmington, NC.
What are key features of this property?
This property features: Approximately +/-32,000 SF of well‑appointed office and warehouse space; About +/-2.8 acres with rear acreage for outdoor storage or potential future development; 100% occupied by a single logistics‑related tenant (Miracle Movers)