Built-Out Neighborhood
For Sale
Contact for pricing
518 N HARRISON ST, Alexandria, IN 46001
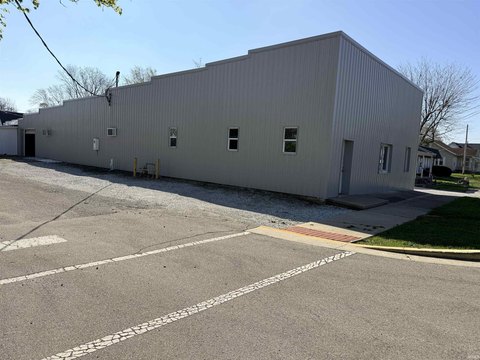
Established hospitality property with bar infrastructure, commercial kitchen facilities, and a fenced outdoor patio.
Property Size2,072 SF
Price / SF$139.48
Days on Market176
Property Features for 518 N HARRISON ST
General Information
Standard status
Active
Size
2,072 SF
Property subtype
Retail, Hospitality, Special Purpose
Zoning
B1
Restaurant
Patio
Yes
Equipment Included
Yes
Additional Details
Furnished
Yes
Building Details
Year Built
1930
Stories
1
Units
1
Listing Agency:
RP Lux Company
Listed By:
Stephen Flanagan · License #IN rb16001253
Source:
Crexi
Added: Apr 24
Changed: Oct 10
Last Checked: Oct 16 at 6:37AM
Displayed information is deemed reliable but is not guaranteed and should be independently verified. All listing content including descriptions, pricing, images are the copyrighted material of RP Lux Company

Ask AI about this property
Review the available facts, identify missing information and prepare questions for the agent.
Investment Insights
Based on property information with market context.
This 1930 hospitality property is configured for bar and restaurant operations, with a complete bar area, serving stations, and a draft beer system. The improvements also include a commercial prep kitchen, food-service area, walk-in refrigeration, coolers, ice equipment, indoor dining and bar seating, televisions, signage, décor, and related furniture, fixtures, and equipment. A fenced outdoor patio provides additional space for smoking or overflow seating.
The property is positioned at 518 N Harrison St in Alexandria, Indiana, with B1 zoning. Its existing hospitality-oriented improvements and included equipment support continued tavern or restaurant use, as well as other venue concepts such as a social club, private event space, or entertainment operation.
The property is positioned at 518 N Harrison St in Alexandria, Indiana, with B1 zoning. Its existing hospitality-oriented improvements and included equipment support continued tavern or restaurant use, as well as other venue concepts such as a social club, private event space, or entertainment operation.
Key Highlights
- Complete bar buildout with serving stations and draft beer system
- Commercial prep kitchen with food‑service area and walk‑in refrigeration
- Fenced outdoor patio for smoking or overflow seating
Financial Insights
Estimated NOI and Cap Rate
NOI / Yr
$8,561
Cap Rate
2.96%
Suggested Prices Based on Cap Rates
Cap Rate 5%
$171,220
$171.2K
Cap Rate 7%
$122,300
$122.3K
Cap Rate 9%
$95,122
$95.1K
Market Conditions
NOI Build-Up for 2,072 SF
Gross rent
$12.6K $6.06/SF
− Vacancy
−$326 −$0.16/SF
EGI
$12.2K $5.90/SF
− OpEx
−$3.7K −$1.77/SF
NOI
$8.6K $4.13/SF
Area
Madison County, IN
Vacancy
2.60%
Lease Rate
$6.06 /SF/Yr
Expense Ratio
30.00%
Simulate Cap Rate and NOI
Suggested Prices Based on Cap Rates
Cap Rate 5%
$171,220
Cap Rate 7%
$122,300
Cap Rate 9%
$95,122
Alternative Uses
Best Use
Specialty Retail
$413.8K
$362.0K – $482.7K
NOI $28,963 @ 7.0% cap · market cap 10.02%
Second Best
Industrial
$122.3K
$107.0K – $142.7K
NOI $8,561 @ 7.0% cap · market cap 2.96%
Theoretical Best
Office A
$477.6K
$417.9K – $557.2K
NOI $33,430 @ 7.0% cap · market cap 11.57%
Zoning and permitted uses should be independently verified with authorities.
How Realmo checks its estimates
Property Analytics
Unlock full access to Insights
Subscribe to Realmo Intelligence
Open Analytics
Current Use
Location Intelligence
Trade Area within ½ mile
249
Businesses Nearby
25k
Monthly Visits Nearby
Balanced
Demand for This Use
Explore this area
Business Placement
Foot Traffic Nearby
Shops & Services 79%
Dining 15%
Groceries 6%
Dollar General
Shops & Services
6,137 visits/mo
0.2 miles
Family Dollar
Shops & Services
3,963 visits/mo
0.4 miles
SUBWAY
Dining
3,925 visits/mo
0.5 miles
PNC Bank
Shops & Services
2,819 visits/mo
0.4 miles
O'Reilly Auto Parts
Shops & Services
2,575 visits/mo
0.3 miles
Demographics for 46001, IN
10,676
Population
5,065
Households
2.1
Avg Household Size
43
Median Age
21%
College-Educated
91%
High-School Grad
77.2 sq mi
ZIP Area
138
Density / Sq Mi
$66,379
Median Household Income
$42,283
Median Earnings
$875
Median Rent
$136,500
Median Home Value
Check the figures for this property
Cap Rate, Value Estimation, Potential NOI and more
View Realmo Analytics
Market
Vacancy Rate% for Retail in Midwest region


Similar Off Market Nearby
- Curve Bar Grill — IN-9, Alexandria, IN 46001
- The Curve — 114 S Park Ave, Alexandria, IN 46001
- Tillies Icon — 724 W Washington St, Alexandria, IN 46001
- Quinn's Corner — 518 N Harrison St, Alexandria, IN 46001
Frequently Asked Questions
What type of property is this?
Bar & Pub - Established hospitality property with bar infrastructure, commercial kitchen facilities, and a fenced outdoor patio.
Where is this bar & pub located?
The property is located at 518 N HARRISON ST Alexandria, IN.
What is the asking price?
The asking price for this property is $289,000.
What are key features of this property?
This property features: Complete bar buildout with serving stations and draft beer system; Commercial prep kitchen with food‑service area and walk‑in refrigeration; Fenced outdoor patio for smoking or overflow seating


