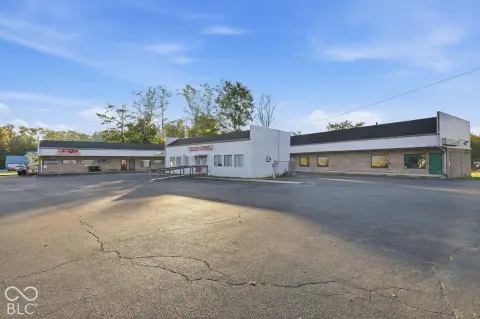
Two-Story Mixed-Use
For Sale
$2,500,000
517 E Walnut St, Indianapolis, IN 46202
C4 zoning supports office, retail, food and beverage, personal service, and healthcare uses.
Property Size9,400 SF
Price / SF$265.96
Days on Market70
Property Features for 517 E Walnut St
General Information
Standard status
Active
Size
9,400 SF
Building Details
Year Built
1900
Listing Agency:
Keller Williams Indy Metro NE
Listed By:
Robert Butcher · License #18000445,INDIANA
(317) 281-2514
Source:
Megandusing
Added: Aug 6
Changed: Oct 11
Last Checked: Oct 7 at 5:03PM
Displayed information is deemed reliable but is not guaranteed and should be independently verified. All listing content including descriptions, pricing, images are the copyrighted material of Keller Williams Indy Metro NE
Investment Insights
Based on property information with market context.
This 9,400-square-foot mixed-use building includes two stories and a full basement, providing a combination of above-grade and lower-level space. Constructed in 1900, the property is zoned C4, with supported use categories including office, retail, food and beverage, personal services, and healthcare.
The building is located just off Massachusetts Avenue in Indianapolis’ Chatham Arch neighborhood. A rooftop addition is identified as a potential improvement, with skyline views associated with that concept.
The building is located just off Massachusetts Avenue in Indianapolis’ Chatham Arch neighborhood. A rooftop addition is identified as a potential improvement, with skyline views associated with that concept.
Key Highlights
- 9,400‑square‑foot mixed‑use building
- Two‑story configuration with a full basement
- C4 zoning supports office, retail, food and beverage, personal services, and healthcare
Financial Insights
Estimated NOI and Cap Rate
NOI / Yr
$114,210
Cap Rate
4.57%
Suggested Prices Based on Cap Rates
Cap Rate 5%
$2,284,200
$2.3M
Cap Rate 7%
$1,631,571
$1.6M
Cap Rate 9%
$1,269,000
$1.3M
Market Conditions
NOI Build-Up for 9,400 SF
Gross rent
$203.0K $21.60/SF
− Vacancy
−$20.3K −$2.16/SF
EGI
$182.7K $19.44/SF
− OpEx
−$68.5K −$7.29/SF
NOI
$114.2K $12.15/SF
Area
Indianapolis, IN
Vacancy
10.00%
Lease Rate
$21.60 /SF/Yr
Expense Ratio
37.50%
Simulate Cap Rate and NOI
Suggested Prices Based on Cap Rates
Cap Rate 5%
$2,284,200
Cap Rate 7%
$1,631,571
Cap Rate 9%
$1,269,000
Alternative Uses
Best Use
Mixed Use
$1.63M
$1.43M – $1.90M
NOI $114,210 @ 7.0% cap · market cap 4.57%
Second Best
Retail
$1.44M
$1.26M – $1.69M
NOI $101,148 @ 7.0% cap · market cap 4.05%
Theoretical Best
Office A
$2.34M
$2.05M – $2.73M
NOI $163,786 @ 7.0% cap · market cap 6.55%
Zoning and permitted uses should be independently verified with authorities.
How Realmo checks its estimates
Property Analytics
Unlock full access to Insights
Subscribe to Realmo Intelligence
Open Analytics
Current Use
Location Intelligence
Trade Area within ½ mile
4,102
Businesses Nearby
Explore this area
Business Placement
Demographics for 46202, IN
22,217
Population
12,297
Households
1.8
Avg Household Size
29
Median Age
62%
College-Educated
91%
High-School Grad
5.5 sq mi
ZIP Area
4,039
Density / Sq Mi
$61,082
Median Household Income
$40,499
Median Earnings
$1,258
Median Rent
$420,200
Median Home Value
Check the figures for this property
Cap Rate, Value Estimation, Potential NOI and more
View Realmo Analytics
Market
Vacancy Rate% for Retail in Indianapolis, IN

Questions? Ask Rey
Realmo’s AI knows this listing — price, zoning, demand, history. Ask anything.




Frequently Asked Questions
What type of property is this?
Mixed-use property - C4 zoning supports office, retail, food and beverage, personal service, and healthcare uses.
Where is this mixed-use property located?
The property is located at 517 E Walnut St Indianapolis, IN.
What is the asking price?
The asking price for this property is $2,500,000.
What are key features of this property?
This property features: 9,400‑square‑foot mixed‑use building; Two‑story configuration with a full basement; C4 zoning supports office, retail, food and beverage, personal services, and healthcare


