Renovated Mixed-Use
For Sale
$1,350,000
5164 Ridge Ave, Philadelphia, PA 19128
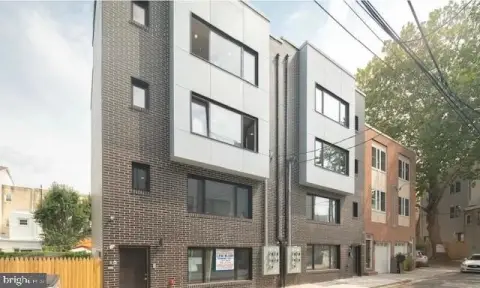
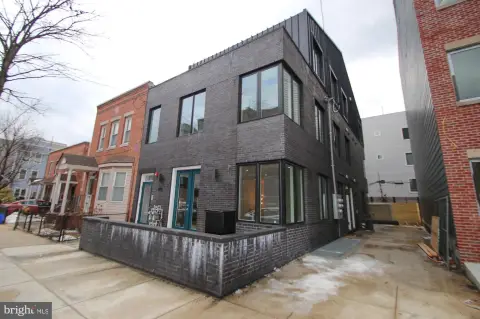
Historic building combines flexible commercial space with separately accessed residential units and updated interior finishes.
Property Size5,484 SF
Price / SF$246.17
Days on Market62
Property Features for 5164 Ridge Ave
General Information
Standard status
Active
Size
5,484 SF
Property subtype
Multi-Family
Units
Unit Mix
2 x 1BR/1BA, 1 x 4BR/2BA
Multifamily Units
3
Office Units
2
Additional Details
Road Access
Yes
Building Details
Year Built
1877
Year Renovated
2023
Buildings
1
Tenancy
Multi
Listing Agency:
Victory Real Estate, LLC
Listed By:
Leron K Grossman · License #RM423874
(215) 709-6699
Source:
Upgradebymichaud
Added: Aug 18
Changed: Oct 17
Last Checked: Oct 16 at 1:05PM
Displayed information is deemed reliable but is not guaranteed and should be independently verified. All listing content including descriptions, pricing, images are the copyrighted material of Victory Real Estate, LLC

Ask AI about this property
Review the available facts, identify missing information and prepare questions for the agent.
Investment Insights
Based on property information with market context.
Originally built in 1877 and renovated in 2023, this 5,484-square-foot mixed-use property combines commercial and residential components within one historic building. The ground level contains two separately entered business spaces, with access from Ridge Avenue and Vassar Street; the spaces may also be joined. Each includes a kitchen and bathroom, while one commercial area adds a lower-level room suitable for office or storage use.
A distinct residential entry leads to two second-floor apartments, each with one bedroom and one bathroom. One includes a den that can serve as a home office. The uppermost residence provides four bedrooms, two bathrooms, and formal living and dining rooms. Full kitchens with stainless steel appliances are installed throughout the residential units.
The property is within walking distance of the retail, dining, and nightlife offerings along Main Street Manayunk and Ridge Avenue. Center City, the Main Line, and East Falls are accessible by a short drive.
A distinct residential entry leads to two second-floor apartments, each with one bedroom and one bathroom. One includes a den that can serve as a home office. The uppermost residence provides four bedrooms, two bathrooms, and formal living and dining rooms. Full kitchens with stainless steel appliances are installed throughout the residential units.
The property is within walking distance of the retail, dining, and nightlife offerings along Main Street Manayunk and Ridge Avenue. Center City, the Main Line, and East Falls are accessible by a short drive.
Key Highlights
- 5,484‑square‑foot mixed‑use property built in 1877 and renovated in 2023
- Two ground‑floor commercial spaces with separate entrances on Ridge Avenue and Vassar Street
- Commercial spaces may be combined; each includes a kitchen and bathroom
Financial Insights
Estimated NOI and Cap Rate
NOI / Yr
$86,261
Cap Rate
6.39%
Suggested Prices Based on Cap Rates
Cap Rate 5%
$1,725,220
$1.7M
Cap Rate 7%
$1,232,300
$1.2M
Cap Rate 9%
$958,456
$958.5K
Market Conditions
NOI Build-Up for 5,484 SF
Gross rent
$166.5K $30.36/SF
− Vacancy
−$9.7K −$1.76/SF
EGI
$156.8K $28.60/SF
− OpEx
−$70.6K −$12.87/SF
NOI
$86.3K $15.73/SF
Area
Philadelphia, PA
Vacancy
5.80%
Lease Rate
$30.36 /SF/Yr
Expense Ratio
45.00%
Simulate Cap Rate and NOI
Suggested Prices Based on Cap Rates
Cap Rate 5%
$1,725,220
Cap Rate 7%
$1,232,300
Cap Rate 9%
$958,456
Alternative Uses
Best Use
Apartment 5plus
$1.23M
$1.08M – $1.44M
NOI $86,261 @ 7.0% cap · market cap 6.39%
Second Best
Mixed Use
$930.7K
$814.4K – $1.09M
NOI $65,150 @ 7.0% cap · market cap 4.83%
Theoretical Best
Multifamily LT 5
$1.34M
$1.17M – $1.56M
NOI $93,584 @ 7.0% cap · market cap 6.93%
Zoning and permitted uses should be independently verified with authorities.
How Realmo checks its estimates
Property Analytics
Unlock full access to Insights
Subscribe to Realmo Intelligence
Open Analytics
Current Use
Lease Details
2
Office units
3
Residential units
Multi-tenant
Tenancy
Yes
Paved road access
Location Intelligence
Trade Area within ½ mile
1,470
Businesses Nearby
Explore this area
Business Placement
Demographics for 19128, PA
36,808
Population
19,006
Households
1.9
Avg Household Size
36
Median Age
55%
College-Educated
95%
High-School Grad
7.0 sq mi
ZIP Area
5,258
Density / Sq Mi
$89,639
Median Household Income
$64,861
Median Earnings
$1,563
Median Rent
$330,800
Median Home Value
Check the figures for this property
Cap Rate, Value Estimation, Potential NOI and more
View Realmo Analytics
Market
Vacancy Rate% for Multifamily in Northeast region





Frequently Asked Questions
What type of property is this?
Mixed-use property - Historic building combines flexible commercial space with separately accessed residential units and updated interior finishes.
Where is this mixed-use property located?
The property is located at 5164 Ridge Ave Philadelphia, PA.
What is the asking price?
The asking price for this property is $1,350,000.
What are key features of this property?
This property features: 5,484‑square‑foot mixed‑use property built in 1877 and renovated in 2023; Two ground‑floor commercial spaces with separate entrances on Ridge Avenue and Vassar Street; Commercial spaces may be combined; each includes a kitchen and bathroom


