Renovated Office Building For
For Sale
Contact for pricing
5121 S Murray Blvd, Salt Lake City, UT
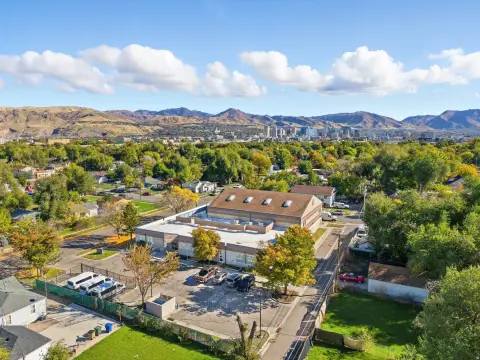
Recently renovated office building with parking and freeway access.
Property Size24,000 SF
Lot Size1.90 Acres
Price / SF$300
Days on Market462
Property Features for 5121 S Murray Blvd
General Information
Standard status
Active
Size
24,000 SF
Lot size
1.90 Acres
Property subtype
OFFICE
Properties For Sale
at 5121 S Murray Blvd Contact us5121 S Murray Blvd AVAILABLE, Now
Floor
1
Size
12,000 SF
Type
OFFICE
Lease Type
FULL_SERVICE
Sublease
No
- Entire building recently renovated
- Covered and fenced in parking
- Dock high door on first floor
- Basement parking/storage area with grade level doors
- Close proximity to transit, shops, restaurants and everyday conveniences
- Immediate freeway access at I-15 & 5300 South
Contact us 5121 S Murray Blvd AVAILABLE, Now
Floor
2
Size
12,000 SF
Type
OFFICE
Lease Type
FULL_SERVICE
Sublease
No
- Entire building recently renovated
- Covered and fenced in parking
- Dock high door on first floor
- Basement parking/storage area with grade level doors
- Close proximity to transit, shops, restaurants and everyday conveniences
- Immediate freeway access at I-15 & 5300 South
Contact us
Listing Agency:
JLL | Salt Lake City
(801) 456-9510
Listed By:
David Nixon · License #8606046-SA00
(801) 456-9518
Source:
Moodyscre
Added: Jul 11, 2025
Changed: Aug 8
Last Checked: Jul 24 at 9:39AM
Displayed information is deemed reliable but is not guaranteed and should be independently verified. All listing content including descriptions, pricing, images are the copyrighted material of JLL | Salt Lake City
Investment Insights
Based on property information with market context.
This is a recently renovated office building offering 24,000 square feet of space. The property features covered and fenced-in parking. A dock-high door is located on the first floor. The basement includes a parking and storage area with grade-level doors. The building is located in close proximity to transit options, shops, restaurants, and other everyday conveniences. It offers immediate freeway access at I-15 and 5300 South. The property is located at 5121 S Murray Blvd, Salt Lake City, UT.
Key Highlights
- Immediate freeway access at I‑15 & 5300 South
- Entire building recently renovated
- Close proximity to transit, shops, restaurants and everyday conveniences
Financial Insights
Estimated NOI and Cap Rate
NOI / Yr
$347,976
Cap Rate
4.83%
Suggested Prices Based on Cap Rates
Cap Rate 5%
$6,959,520
$7.0M
Cap Rate 7%
$4,971,086
$5.0M
Cap Rate 9%
$3,866,400
$3.9M
Market Conditions
NOI Build-Up for 24,000 SF
Gross rent
$515.5K $21.48/SF
− Vacancy
−$51.6K −$2.15/SF
EGI
$464.0K $19.33/SF
− OpEx
−$116.0K −$4.83/SF
NOI
$348.0K $14.50/SF
Area
Salt Lake City, UT
Vacancy
10.00%
Lease Rate
$21.48 /SF/Yr
Expense Ratio
25.00%
Simulate Cap Rate and NOI
Suggested Prices Based on Cap Rates
Cap Rate 5%
$6,959,520
Cap Rate 7%
$4,971,086
Cap Rate 9%
$3,866,400
Alternative Uses
Best Use
Office B
$4.97M
$4.35M – $5.80M
NOI $347,976 @ 7.0% cap · market cap 4.83%
Second Best
—
—
no second resolved use
Theoretical Best
Office A
$6.47M
$5.66M – $7.54M
NOI $452,616 @ 7.0% cap · market cap 6.29%
Zoning and permitted uses should be independently verified with authorities.
How Realmo checks its estimates
Property Analytics
Unlock full access to Insights
Subscribe to Realmo Intelligence
Open Analytics
Current Use
Location Intelligence
Trade Area within ½ mile
1,590
Businesses Nearby
Explore this area
Business Placement
Check the figures for this property
Cap Rate, Value Estimation, Potential NOI and more
View Realmo Analytics
Market
Vacancy Rate% for Office in Salt Lake City, UT

Questions? Ask Rey
Realmo’s AI knows this listing — price, zoning, demand, history. Ask anything.




Frequently Asked Questions
What type of property is this?
Office building - Recently renovated office building with parking and freeway access.
Where is this office building located?
The property is located at 5121 S Murray Blvd Salt Lake City, UT.
What is the asking price?
The asking price for this property is $7,200,000.
What are key features of this property?
This property features: Immediate freeway access at I‑15 & 5300 South; Entire building recently renovated; Close proximity to transit, shops, restaurants and everyday conveniences