Renovated Three-Family
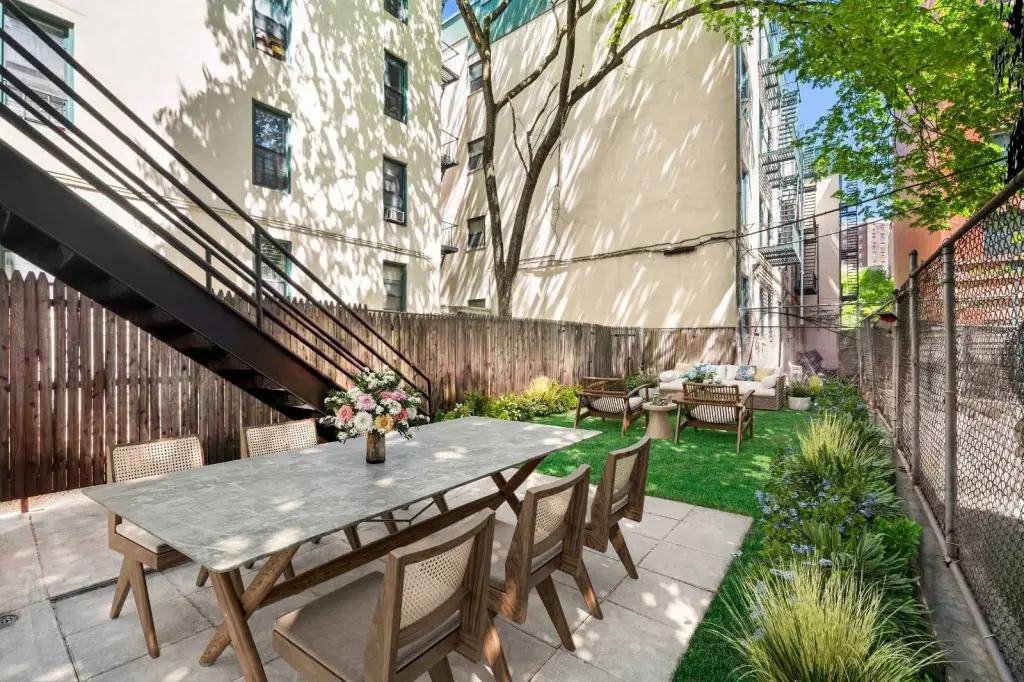
For Sale
$2,385,000
51 E 130th Street, New York, NY 10037
Residential Income, New York, NY
Property Size3,375 SF
Lot Size0.08 Acres
Price / SF$706.67
Days on Market102
Property Features for 51 E 130th Street
General Information
Property type
Residential Multi Family
Property subtype
Other
Bedrooms
5
Bathrooms
4
Full bathrooms
3
Half bathrooms
1
Rooms
Bedroom 4, Bedroom 2, Bathroom 2, Bathroom 3, Bathroom 4, Bedroom 3, Bedroom 5, Bathroom 1, Bedroom 1
Interior features
Entrance Foyer
Standard status
Active
Lot size
0.08 Acres
Taxes and HOA fees
Tax Annual Amount
710
Utilities
Heating system
Baseboard
Amenities
private garden
in-unit washer/dryer
digital keypad entry
Building Details
Floors in Building
4
Flooring type
Hardwood, Tile
Architectural style
Other
Listing Agency:
THE RICKY HADZOVIC GROUP LLC
(469) 323-3699
Listed By:
Ujkan Hadzovic
Added: Jul 6
Changed: Oct 1
Last Checked: Oct 15 at 11:06PM
MLS# 11871283
Copyright © 2026 My State MLS. All rights reserved. All information provided by the listing agent/broker is deemed reliable but is not guaranteed and should be independently verified.

Ask AI about this property
Review the available facts, identify missing information and prepare questions for the agent.
Investment Insights
Based on property information with market context.
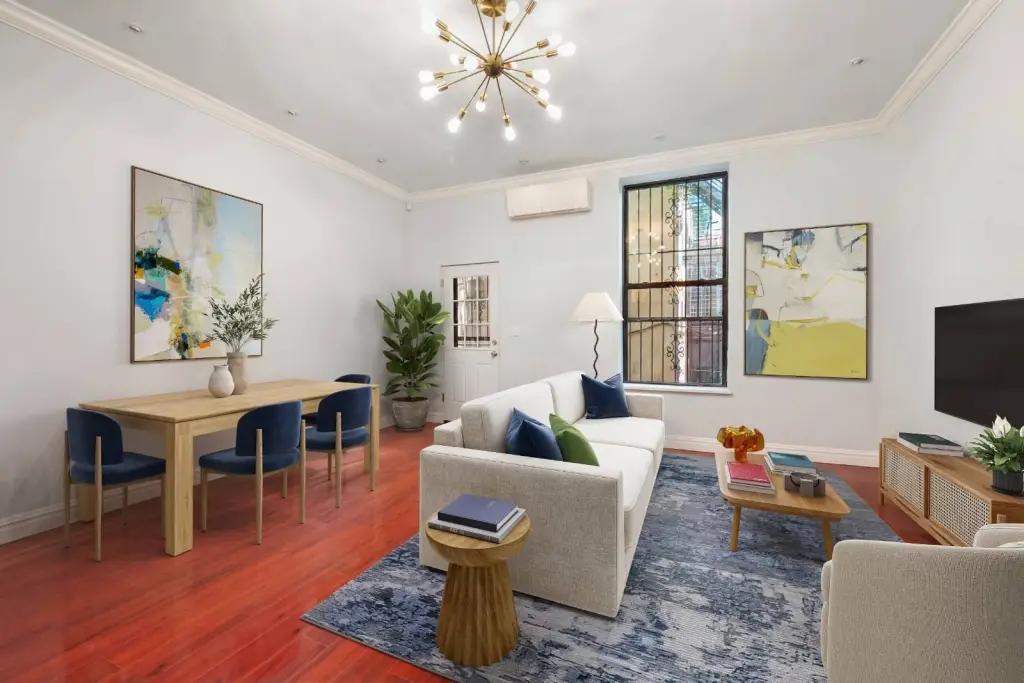
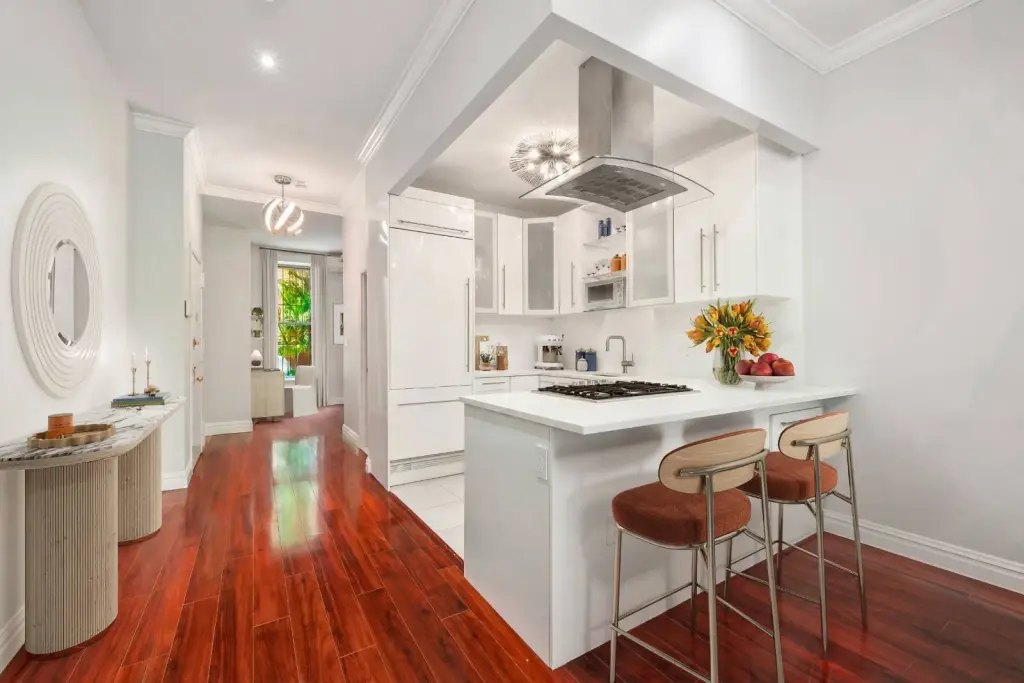
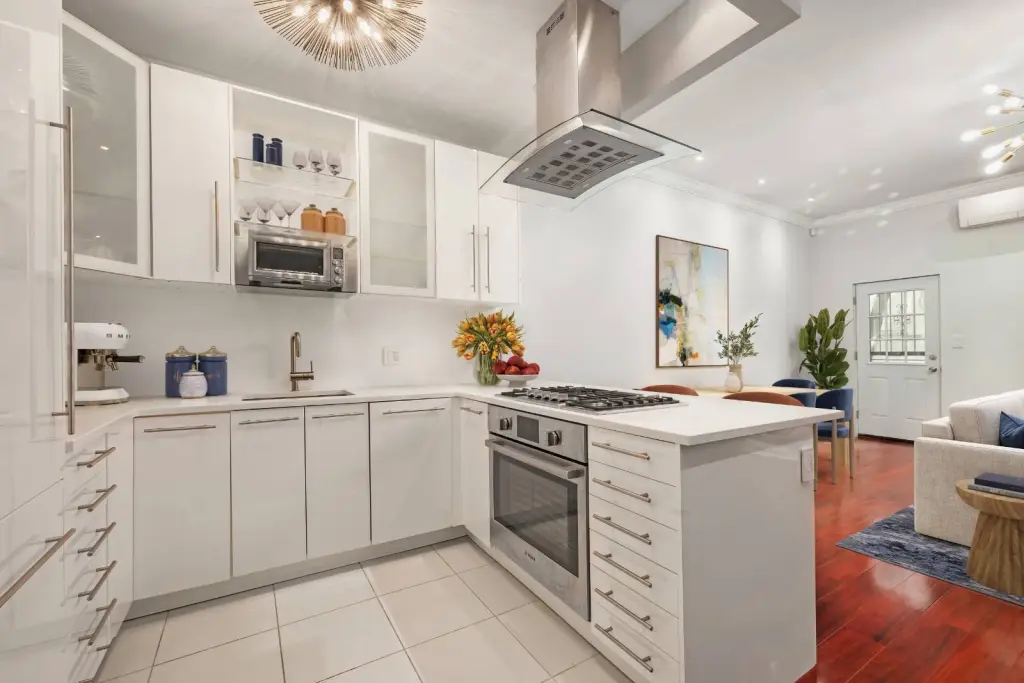
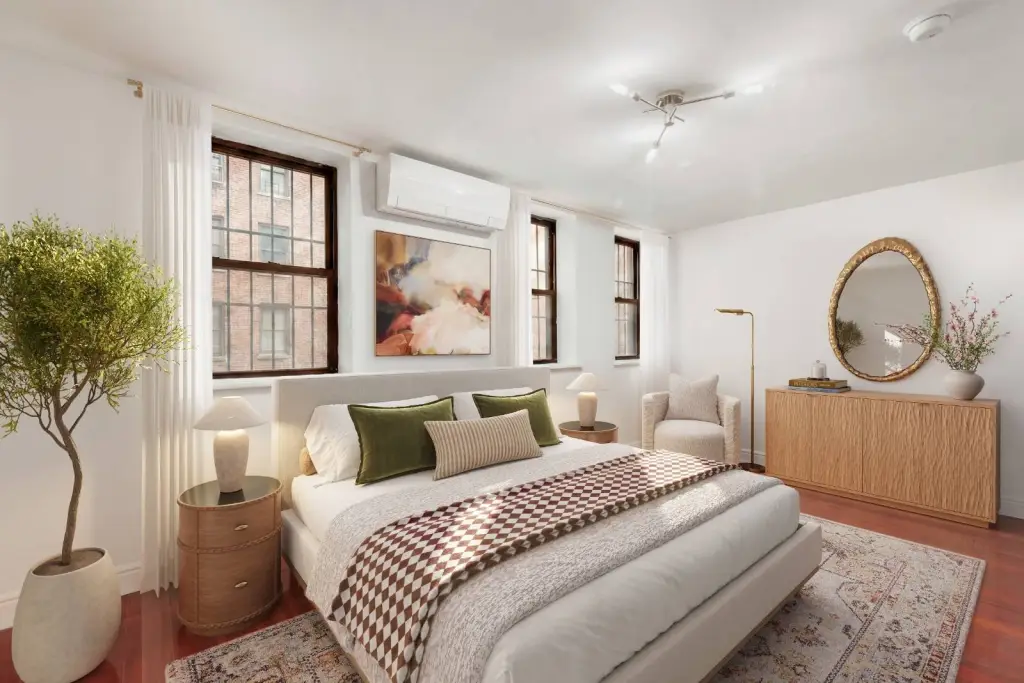
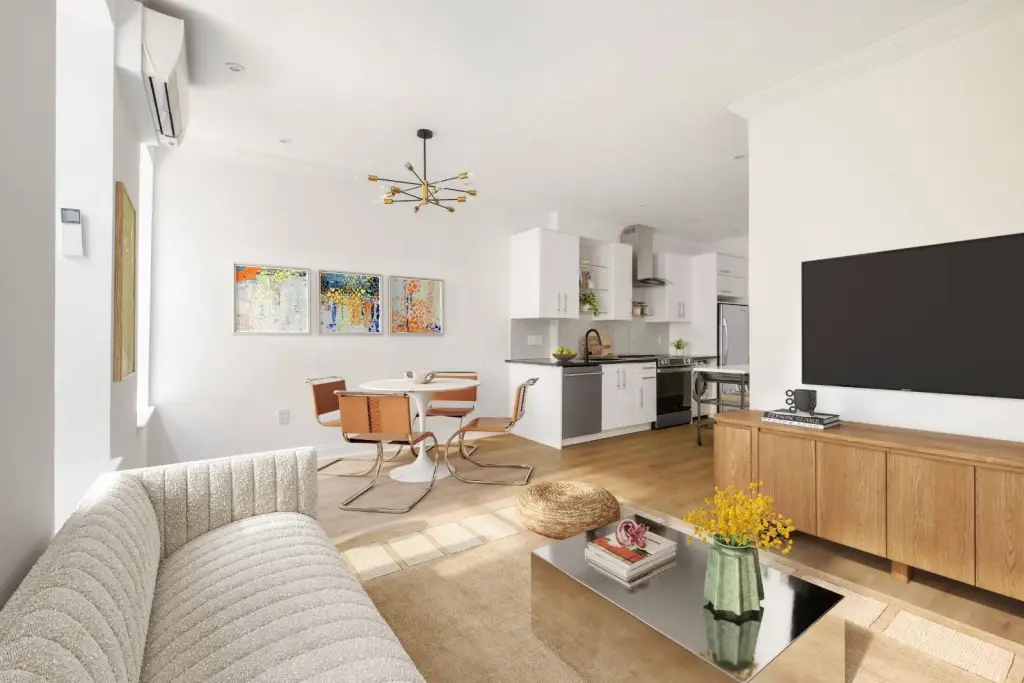
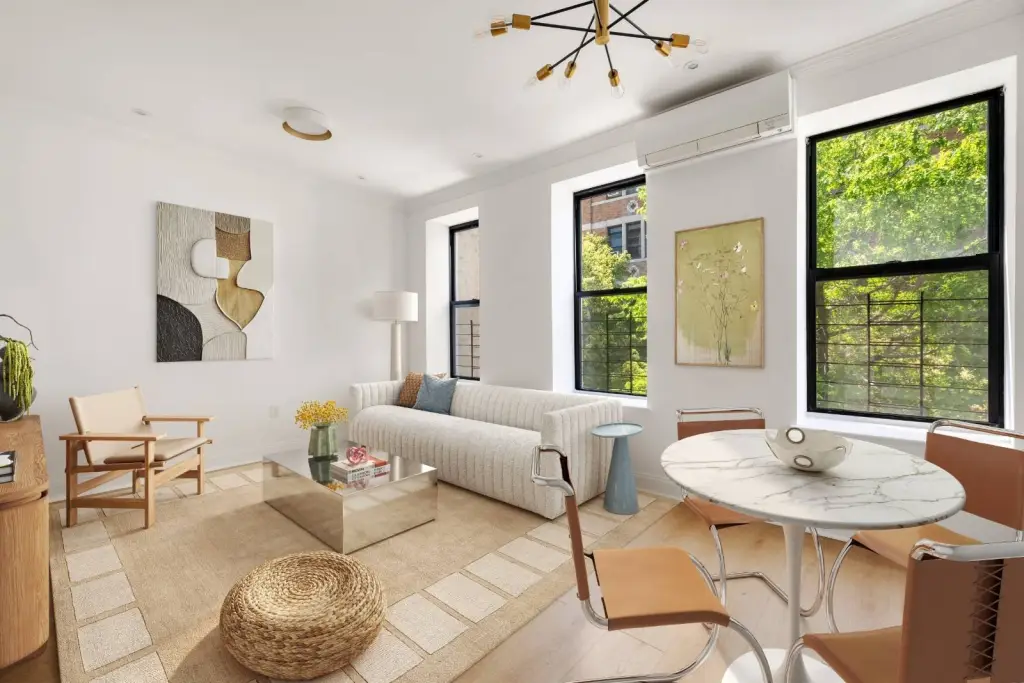
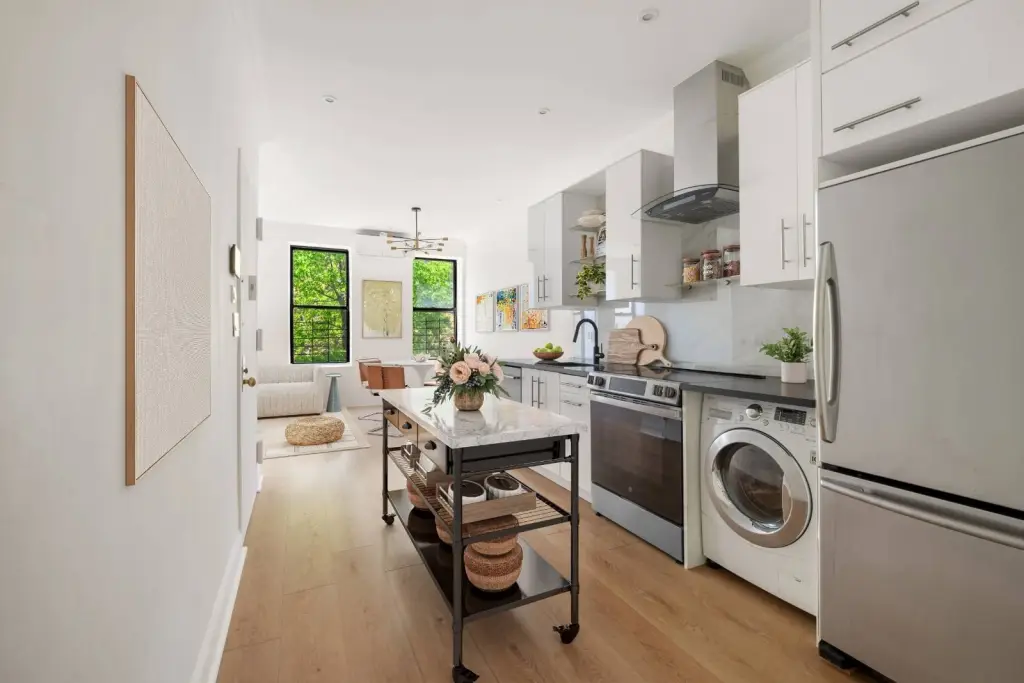
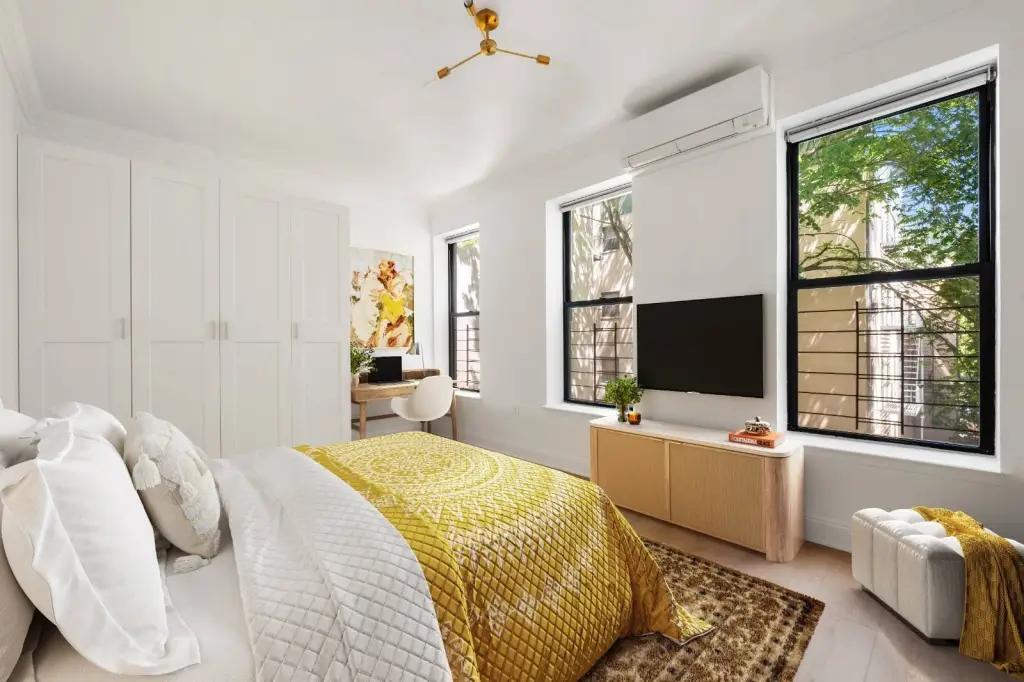
This four-story townhouse contains approximately 3,375 square feet on a 0.0775-acre lot and is configured as three free-market residences under a legal three-family Certificate of Occupancy. The owner’s duplex includes two bedrooms, two full bathrooms, a home office, and garden access. Separate one-bedroom, one-bathroom apartments occupy the second and third floors. Hardwood and tile flooring, high ceilings, oversized windows, in-unit laundry, and a private rear garden are among the existing features.
The property was constructed in 1920 and comprehensively rebuilt by New York City in 1997. Capital work includes Mitsubishi Hyper-Heat systems, updated electrical and plumbing infrastructure, a 2021 roof, 2018 facade and envelope improvements, and apartment renovations completed in 2020 and 2026. Each apartment has independent 200-amp electrical service. More than 3,000 square feet of additional development rights are available, subject to applicable approvals. Architectural plans exploring single-family conversion have been commissioned but are not filed or approved.
The property was constructed in 1920 and comprehensively rebuilt by New York City in 1997. Capital work includes Mitsubishi Hyper-Heat systems, updated electrical and plumbing infrastructure, a 2021 roof, 2018 facade and envelope improvements, and apartment renovations completed in 2020 and 2026. Each apartment has independent 200-amp electrical service. More than 3,000 square feet of additional development rights are available, subject to applicable approvals. Architectural plans exploring single-family conversion have been commissioned but are not filed or approved.
Key Highlights
- Legal three‑family Certificate of Occupancy with three free‑market residences
- Approximately 3,375 square feet across four stories; approximately 19 feet wide
- 0.0775‑acre lot with a private rear garden
Financial Insights
Estimated NOI and Cap Rate
NOI / Yr
$114,222
Cap Rate
4.79%
Suggested Prices Based on Cap Rates
Cap Rate 5%
$2,284,440
$2.3M
Cap Rate 7%
$1,631,743
$1.6M
Cap Rate 9%
$1,269,133
$1.3M
Market Conditions
NOI Build-Up for 3,375 SF
Gross rent
$172.1K $51.00/SF
− Vacancy
−$9.0K −$2.65/SF
EGI
$163.2K $48.35/SF
− OpEx
−$49.0K −$14.50/SF
NOI
$114.2K $33.84/SF
Area
New York, NY
Vacancy
5.20%
Lease Rate
$51.00 /SF/Yr
Expense Ratio
30.00%
Simulate Cap Rate and NOI
Suggested Prices Based on Cap Rates
Cap Rate 5%
$2,284,440
Cap Rate 7%
$1,631,743
Cap Rate 9%
$1,269,133
Alternative Uses
Best Use
Multifamily LT 5
$1.63M
$1.43M – $1.90M
NOI $114,222 @ 7.0% cap · market cap 4.79%
Second Best
Apartment 5plus
$1.51M
$1.32M – $1.76M
NOI $105,595 @ 7.0% cap · market cap 4.43%
Theoretical Best
Specialty Retail
$8.40M
$7.35M – $9.80M
NOI $588,060 @ 7.0% cap · market cap 24.66%
Zoning and permitted uses should be independently verified with authorities.
How Realmo checks its estimates
Property Analytics
Unlock full access to Insights
Subscribe to Realmo Intelligence
Open Analytics
Current Use
Lease Details
3
Residential units
Yes
Utilities to site
Location Intelligence
Trade Area within ½ mile
7,266
Businesses Nearby
Explore this area
Business Placement
Demographics for 10037, NY
19,670
Population
11,218
Households
1.8
Avg Household Size
39
Median Age
43%
College-Educated
86%
High-School Grad
0.2 sq mi
ZIP Area
98,350
Density / Sq Mi
$51,250
Median Household Income
$54,349
Median Earnings
$1,406
Median Rent
Check the figures for this property
Cap Rate, Value Estimation, Potential NOI and more
View Realmo Analytics
Market
Vacancy Rate% for Multifamily in Northeast region


Frequently Asked Questions
What type of property is this?
Triplex - Legal three-family townhouse with a private garden, updated systems, and an owner’s duplex plus two additional residences.
Where is this triplex located?
The property is located at 51 E 130th Street New York, NY.
What is the asking price?
The asking price for this property is $2,385,000.
What are key features of this property?
This property features: Legal three‑family Certificate of Occupancy with three free‑market residences; Approximately 3,375 square feet across four stories; approximately 19 feet wide; 0.0775‑acre lot with a private rear garden


