Three-Story Colonial
For Sale
$998,000
508 New Dorp Lane, Staten Island, NY 10306
Residential Income, Staten Island, NY
Property Size1,150 SF
Lot Size0.07 Acres
Price / SF$867.83
Days on Market481
Property Features for 508 New Dorp Lane
General Information
Property type
Residential Multi Family
Property subtype
Duplex
Zoning
R3-1
Bedrooms
3
Bathrooms
5
Full bathrooms
3
Rooms
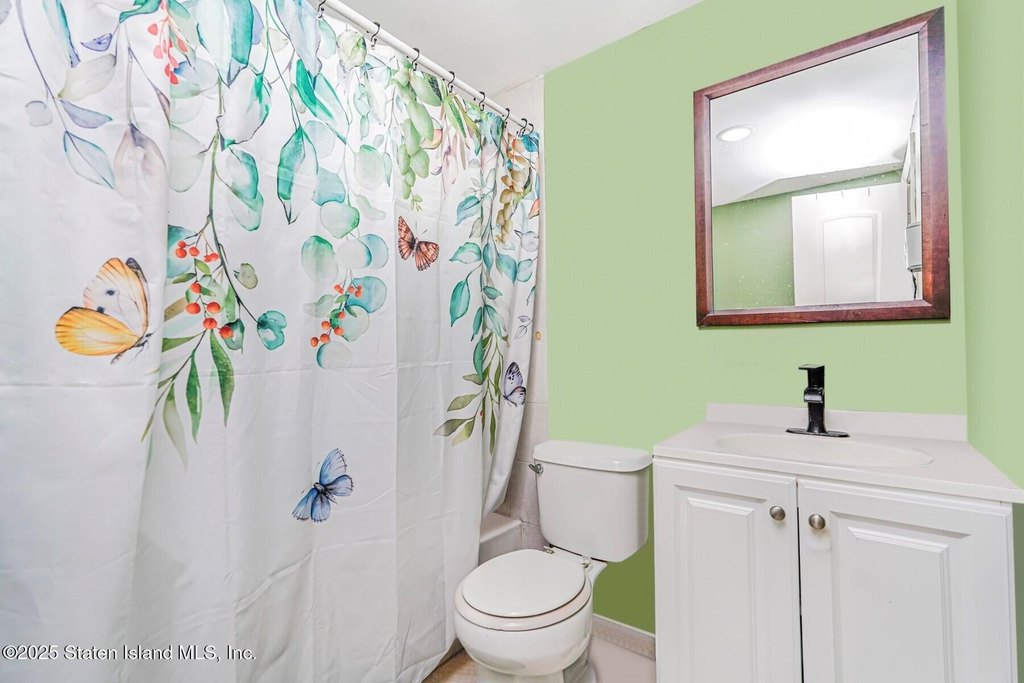
Bathroom 1, Bedroom 2, Bathroom 4, Bathroom 2, Bedroom 1, Bedroom 3, Bathroom 3, Bathroom 5
Parking features
Carport, On Street
Basement
Full, Apartment
Lot features
Front Yard, Back Yard
Subdivision
New Dorp
Standard status
Active
APN
04031-0109
Size
1,150 SF
Lot size
0.07 Acres
Taxes and HOA fees
Tax Annual Amount
6112
Utilities
Sewer type
Public Sewer
Heating system
Forced Air, Natural Gas
Cooling system
Central Air
Amenities
pool
front porch
garden area
Building Details
Year built
2004
Floors in Building
2
Number of units
2
Building materials
Stone, Stucco, Vinyl Siding
Listing Agency:
Anne Lopa Real Estate
(718) 227-1111
Listed By:
Ann Lopa
(917) 364-4755
Added: Jun 19, 2025
Changed: Oct 12
Last Checked: Oct 12 at 9:06PM
MLS# 2503597
Copyright © 2026 Staten Island Board of Realtors. All rights reserved. All information provided by the listing agent/broker is deemed reliable but is not guaranteed and should be independently verified.
Investment Insights
Based on property information with market context.
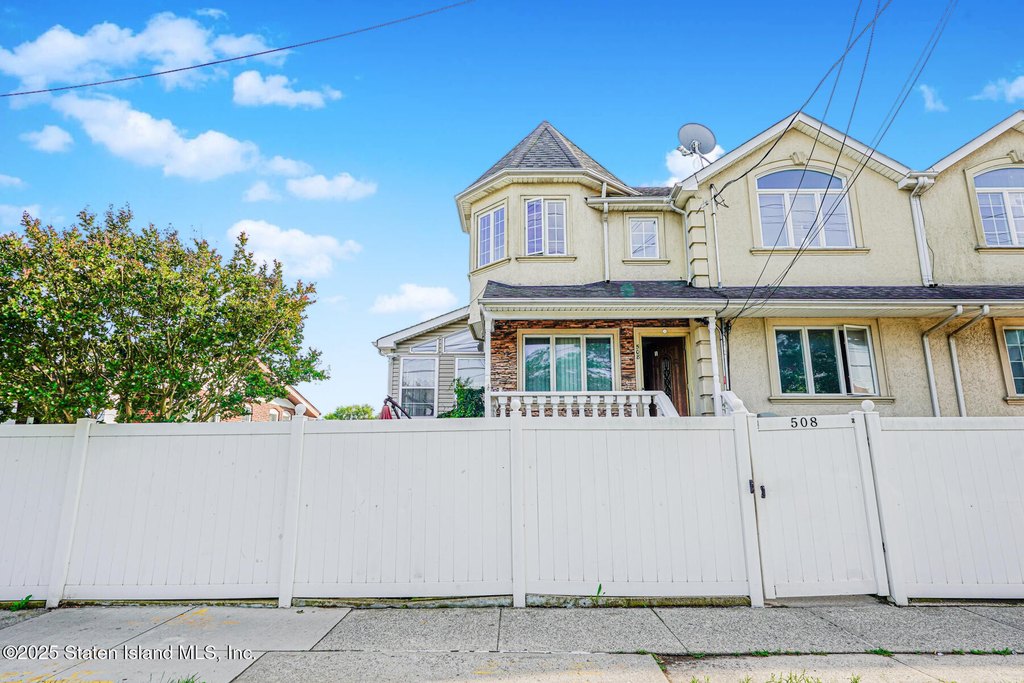
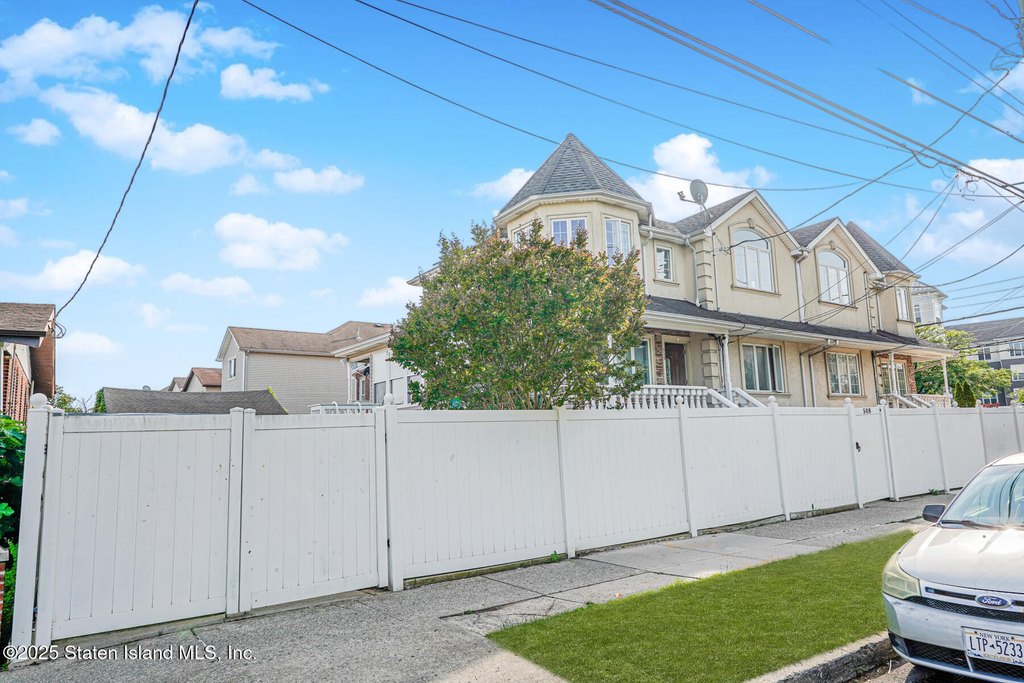
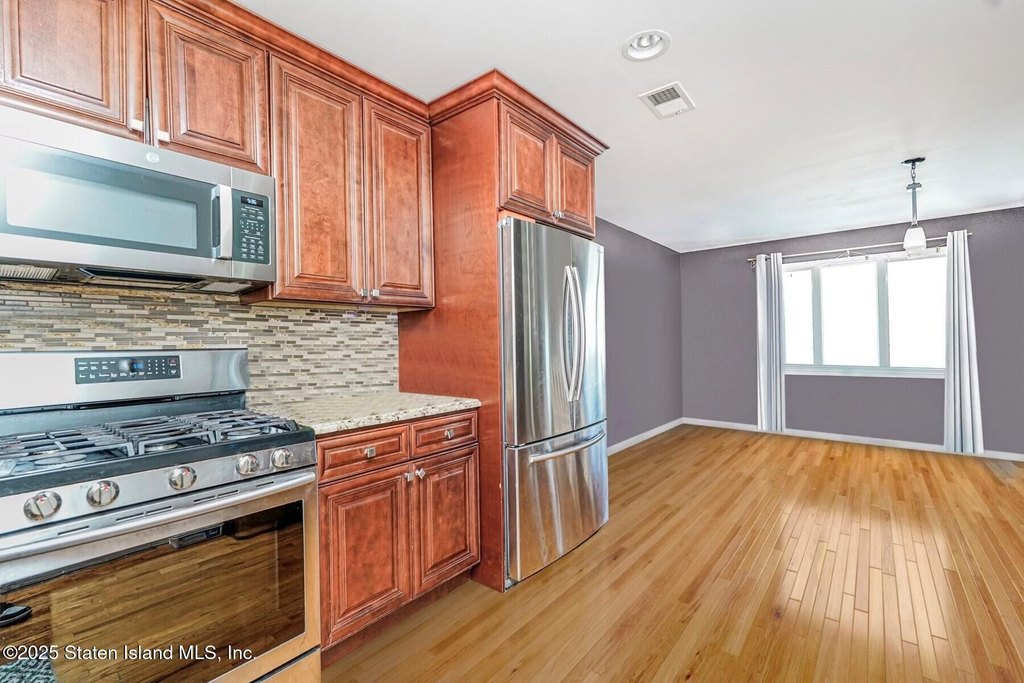
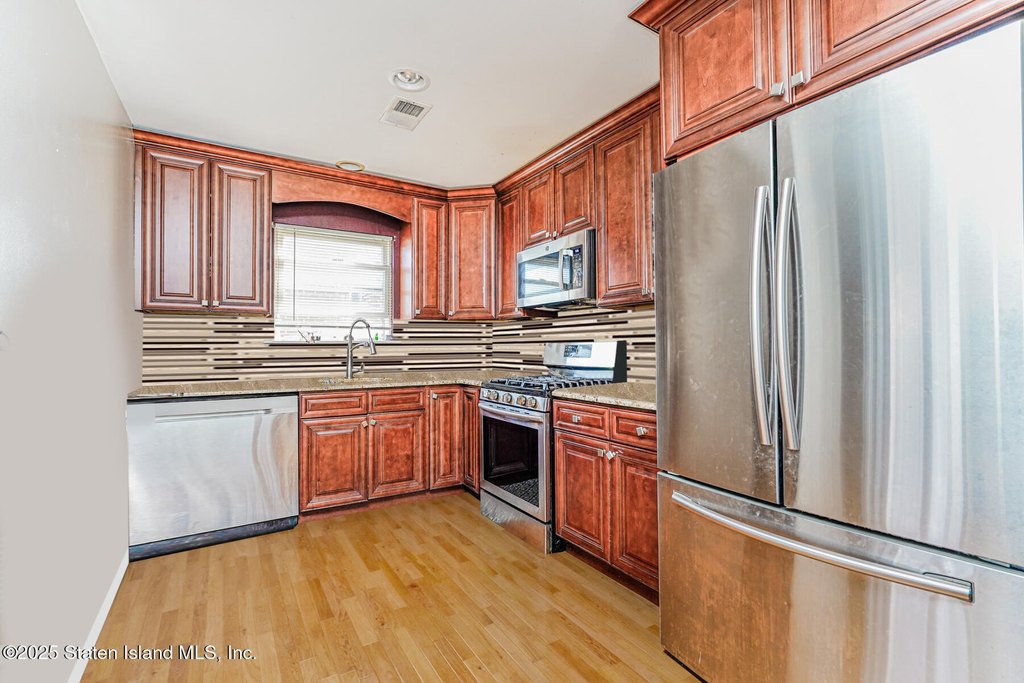
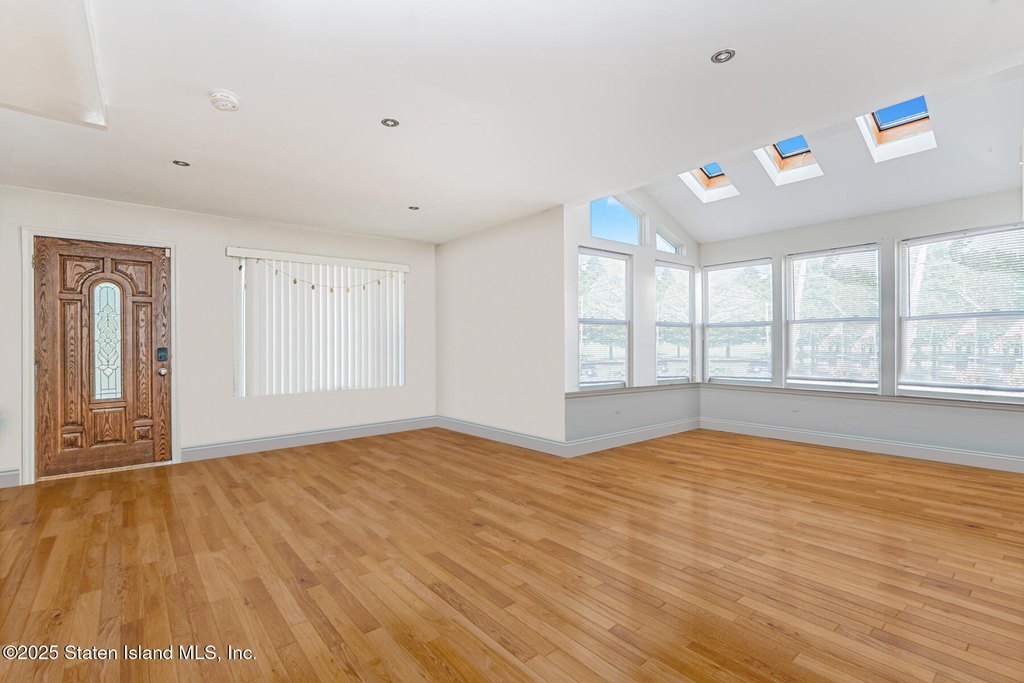
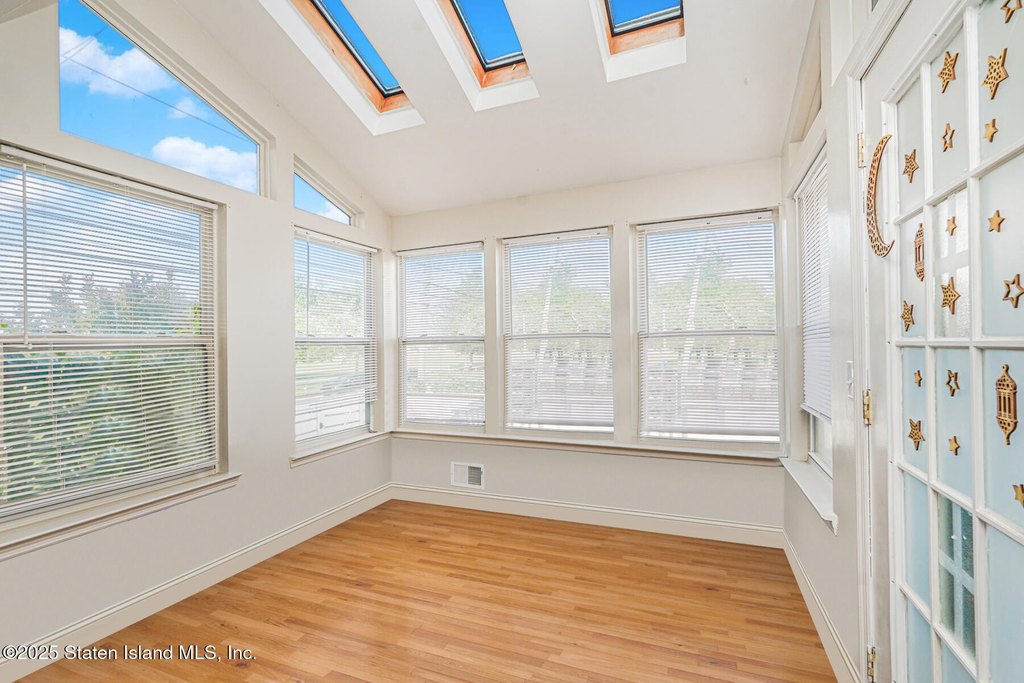
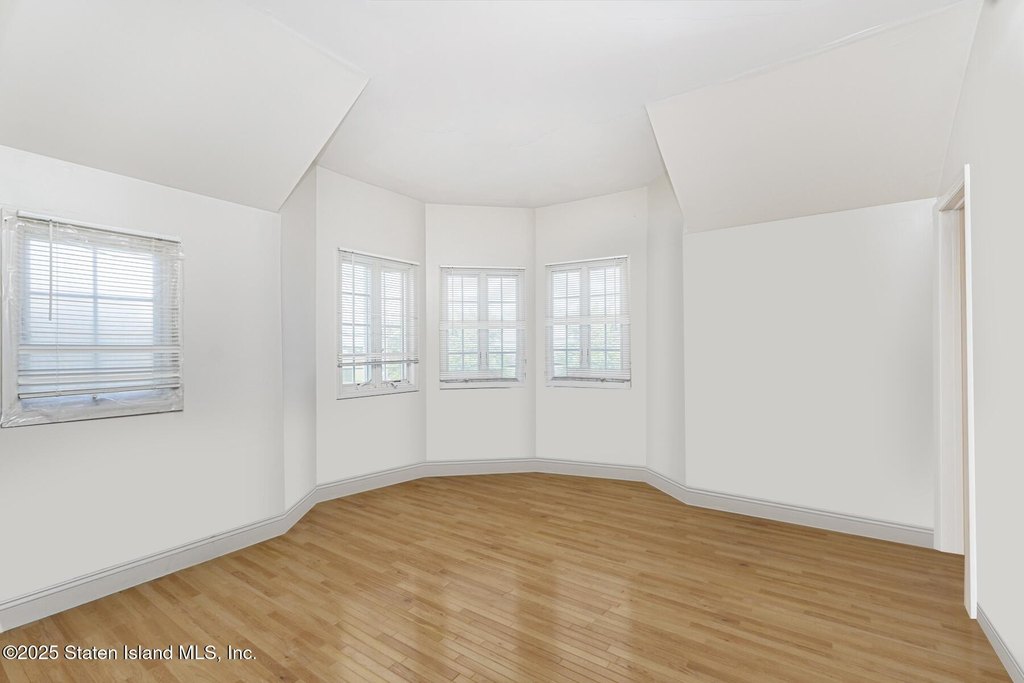
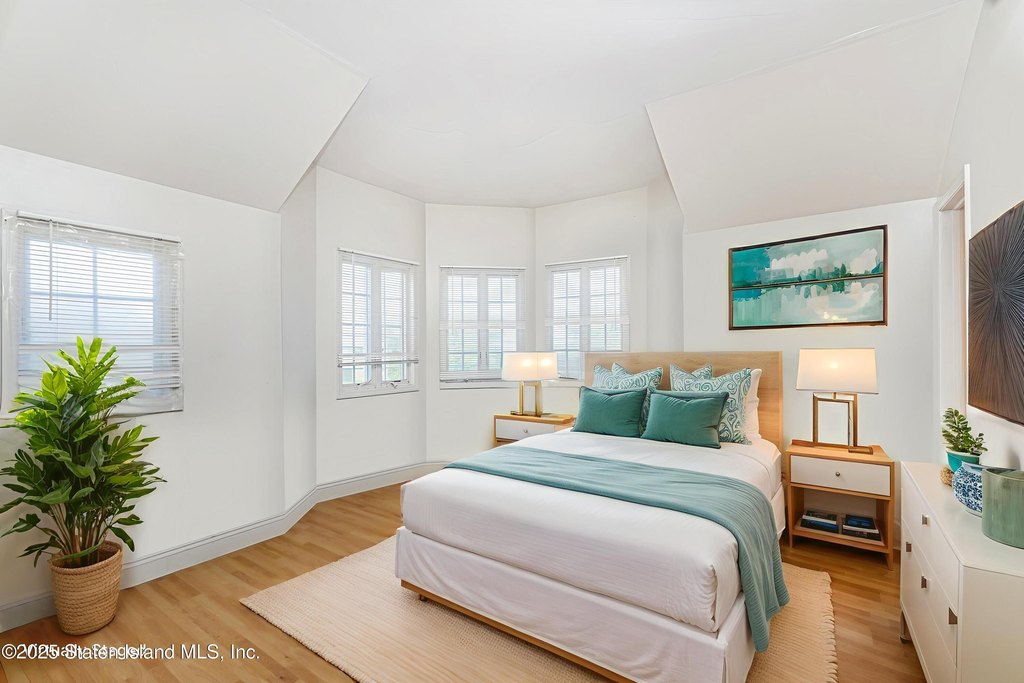
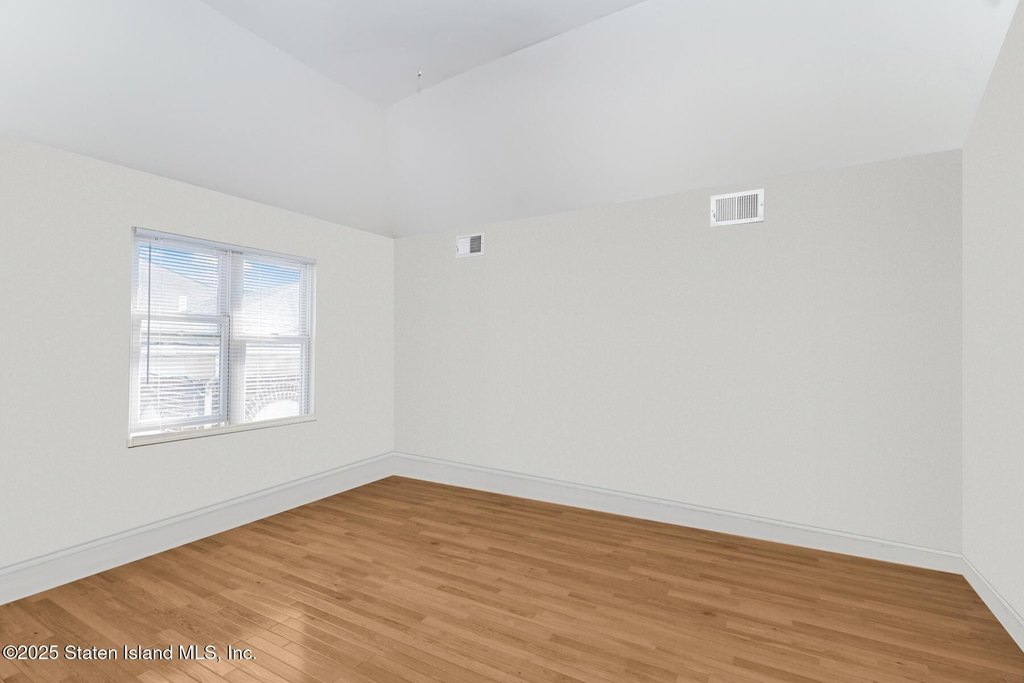
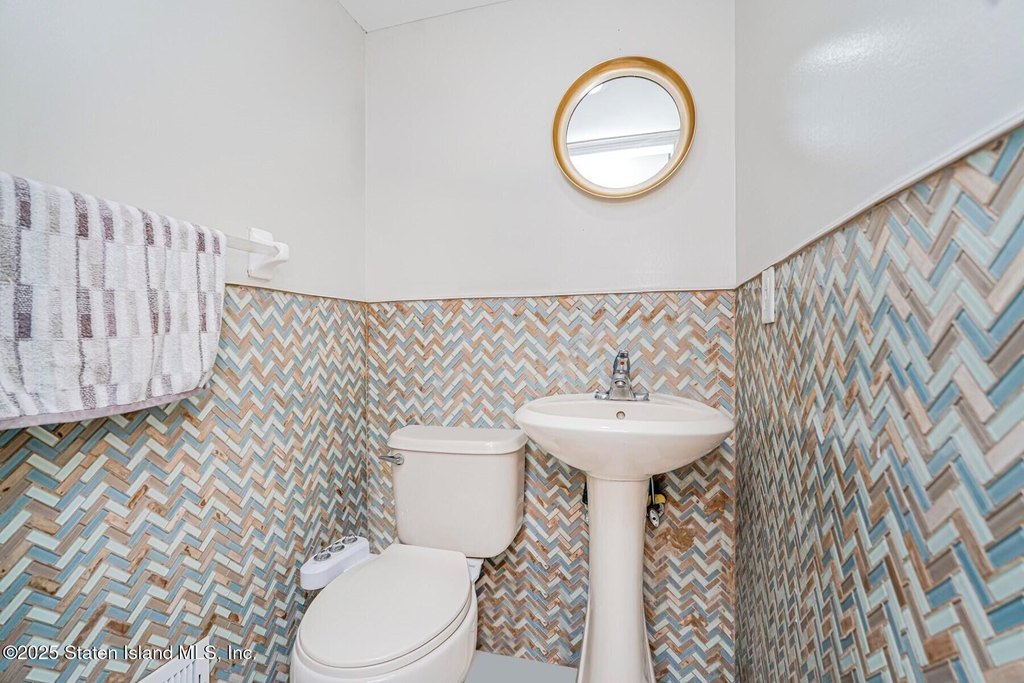
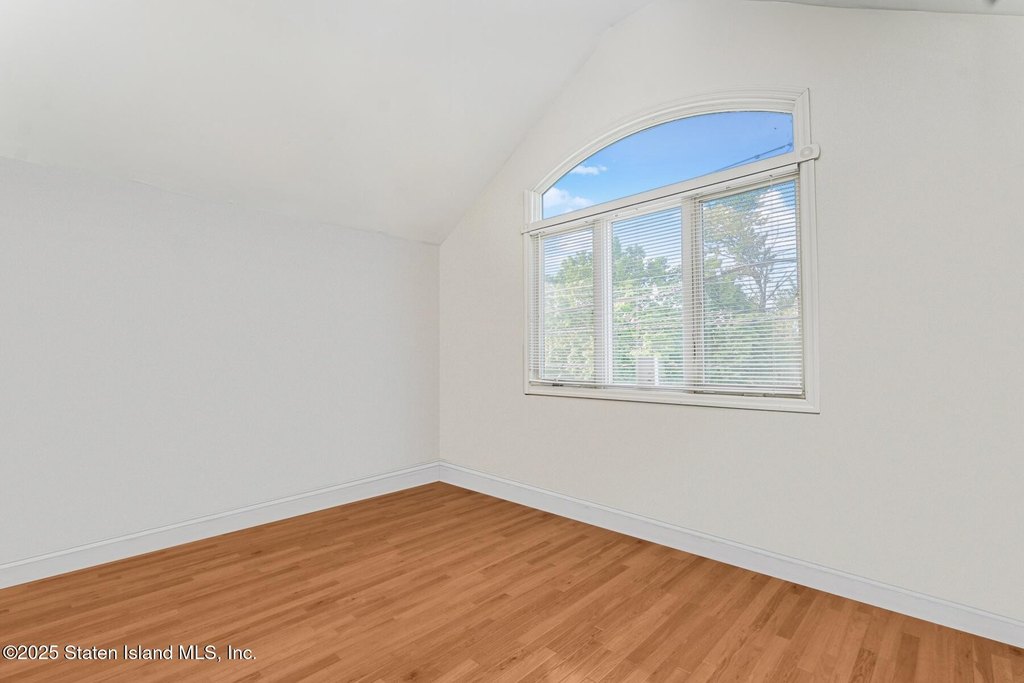
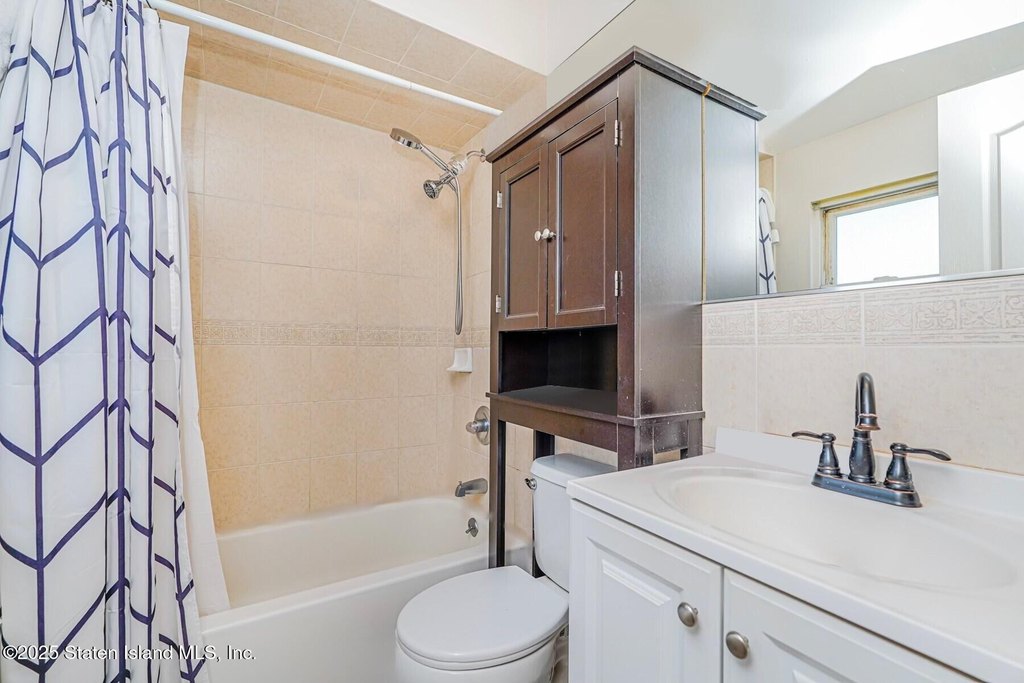
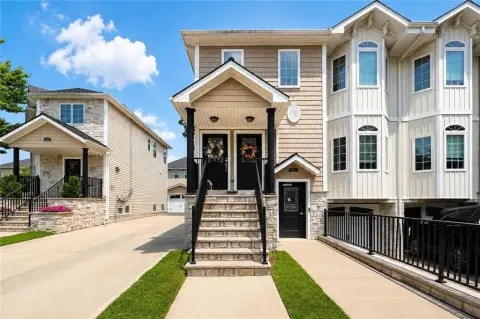
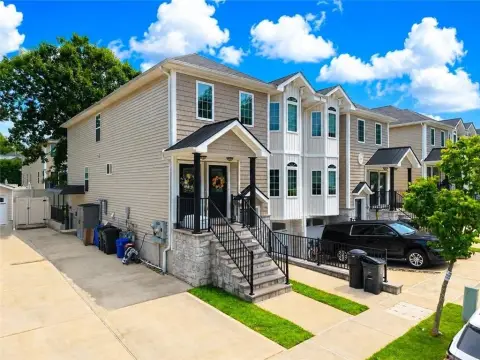
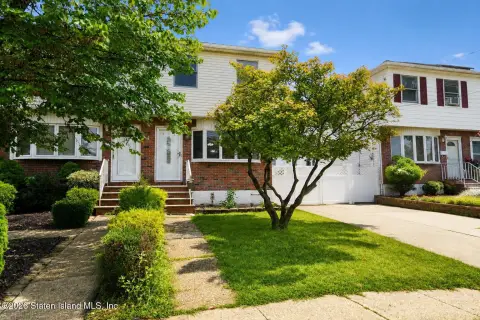
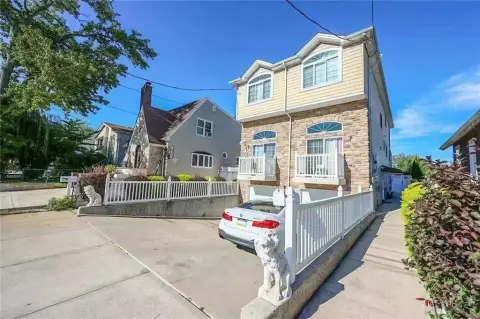
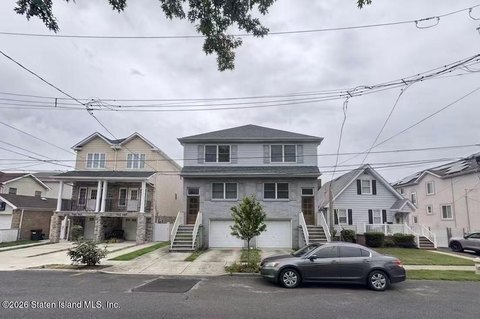
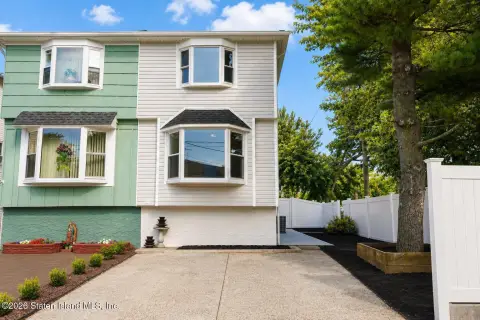
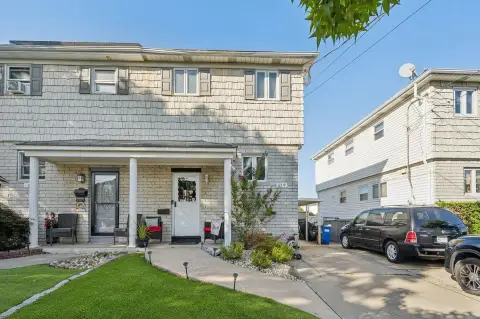
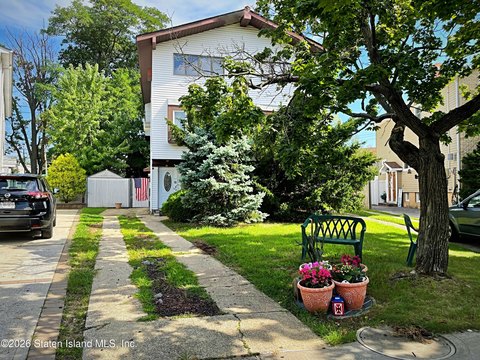
This three-story Colonial duplex, built in 2004, is configured with a main residence and a separate apartment. The primary home includes an eat-in kitchen with stainless steel appliances, granite counters, a living room, dining room, family room, half bath, three bedrooms, and two full baths. Oak flooring and interior railings add consistent finish throughout. The apartment provides an eat-in kitchen, living room, dining area, and bedroom, while an adjacent family room supports flexible use. The property is zoned R3-1 and occupies 0.0661 acres.
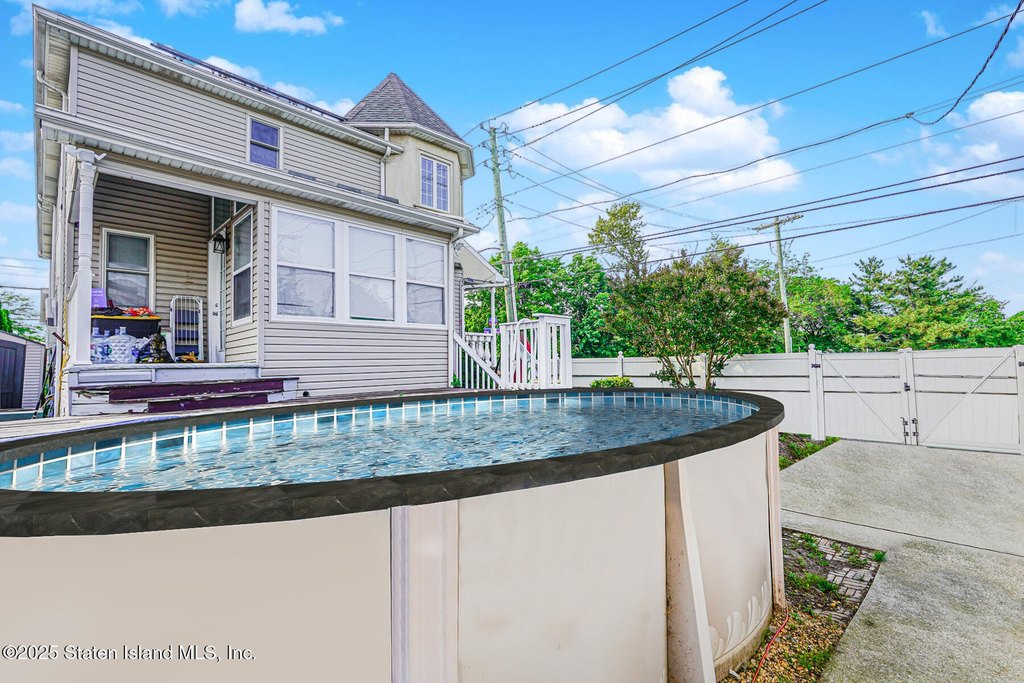
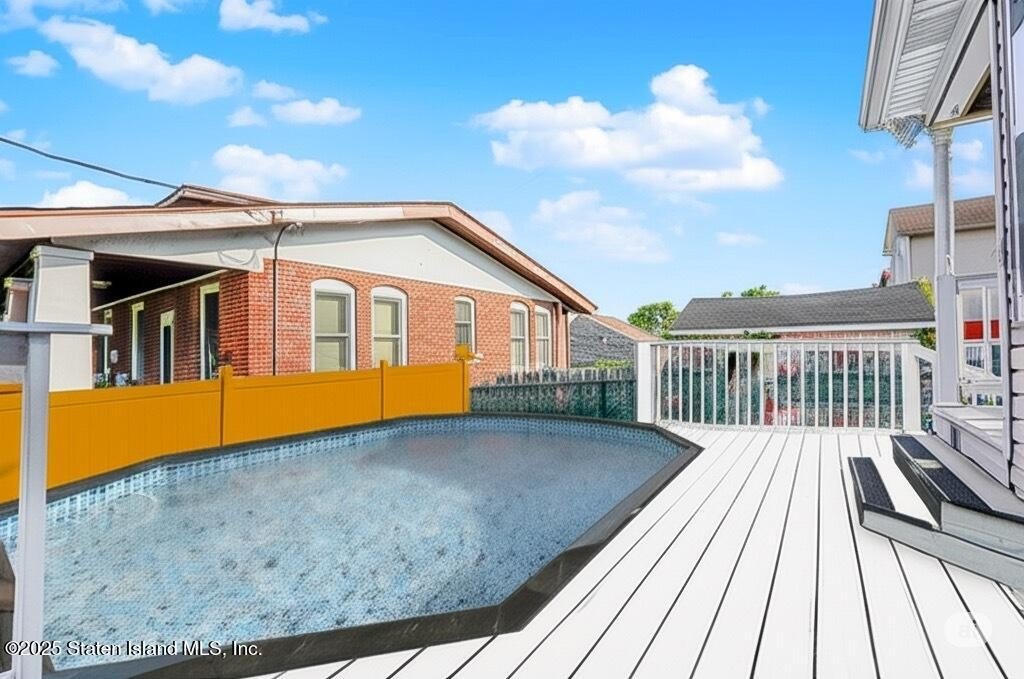
Outdoor improvements include a pool with a newer liner, pool decking, garden space, a driveway, and a full PVC fence. The apartment has its own central air and heating systems, and the property includes two heating units, two central air units, and two separate electric meters. A washer and dryer are located in the main house. The property is at 508 New Dorp Lane in Staten Island, near grocery stores, shops, restaurants, schools, transit, and bus service.
Outdoor improvements include a pool with a newer liner, pool decking, garden space, a driveway, and a full PVC fence. The apartment has its own central air and heating systems, and the property includes two heating units, two central air units, and two separate electric meters. A washer and dryer are located in the main house. The property is at 508 New Dorp Lane in Staten Island, near grocery stores, shops, restaurants, schools, transit, and bus service.
Key Highlights
- Two‑family Colonial duplex with three floors, main residence, and separate apartment
- R3‑1 zoning on a 0.0661‑acre lot at 508 New Dorp Lane
- Pool with new liner, pool deck, garden area, driveway, and full PVC fence
Financial Insights
Estimated NOI and Cap Rate
NOI / Yr
$29,212
Cap Rate
2.93%
Suggested Prices Based on Cap Rates
Cap Rate 5%
$584,240
$584.2K
Cap Rate 7%
$417,314
$417.3K
Cap Rate 9%
$324,578
$324.6K
Market Conditions
NOI Build-Up for 1,150 SF
Gross rent
$44.2K $38.40/SF
− Vacancy
−$2.4K −$2.11/SF
EGI
$41.7K $36.29/SF
− OpEx
−$12.5K −$10.89/SF
NOI
$29.2K $25.40/SF
Area
ZIP 10306
Vacancy
5.50%
Lease Rate
$38.40 /SF/Yr
Expense Ratio
30.00%
Simulate Cap Rate and NOI
Suggested Prices Based on Cap Rates
Cap Rate 5%
$584,240
Cap Rate 7%
$417,314
Cap Rate 9%
$324,578
Alternative Uses
Best Use
Multifamily LT 5
$417.3K
$365.2K – $486.9K
NOI $29,212 @ 7.0% cap · market cap 2.93%
Second Best
Apartment 5plus
$370.8K
$324.5K – $432.6K
NOI $25,958 @ 7.0% cap · market cap 2.60%
Theoretical Best
Office A
$548.7K
$480.1K – $640.2K
NOI $38,410 @ 7.0% cap · market cap 3.85%
Zoning and permitted uses should be independently verified with authorities.
How Realmo checks its estimates
Property Analytics
Unlock full access to Insights
Subscribe to Realmo Intelligence
Open Analytics
Current Use
Lease Details
2
Residential units
Location Intelligence
Trade Area within ½ mile
1,483
Businesses Nearby
Explore this area
Business Placement
Demographics for 10306, NY
57,919
Population
21,299
Households
2.7
Avg Household Size
43
Median Age
34%
College-Educated
88%
High-School Grad
7.2 sq mi
ZIP Area
8,044
Density / Sq Mi
$97,746
Median Household Income
$54,052
Median Earnings
$1,743
Median Rent
$675,400
Median Home Value
Check the figures for this property
Cap Rate, Value Estimation, Potential NOI and more
View Realmo Analytics
Market
Vacancy Rate% for Multifamily in Northeast region

Questions? Ask Rey
Realmo’s AI knows this listing — price, zoning, demand, history. Ask anything.
Frequently Asked Questions
What type of property is this?
Duplex - Two-family residence with separate heating, cooling, and electric systems, plus a private pool and fenced outdoor area.
Where is this duplex located?
The property is located at 508 New Dorp Lane Staten Island, NY.
What is the asking price?
The asking price for this property is $998,000.
What are key features of this property?
This property features: Two‑family Colonial duplex with three floors, main residence, and separate apartment; R3‑1 zoning on a 0.0661‑acre lot at 508 New Dorp Lane; Pool with new liner, pool deck, garden area, driveway, and full PVC fence


