6-Unit Apartment
For Sale
$675,000
506 E Seneca Street, Ithaca, NY 14850
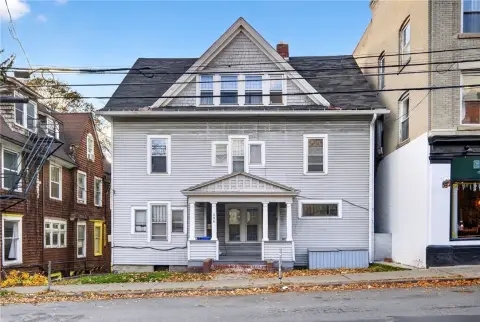
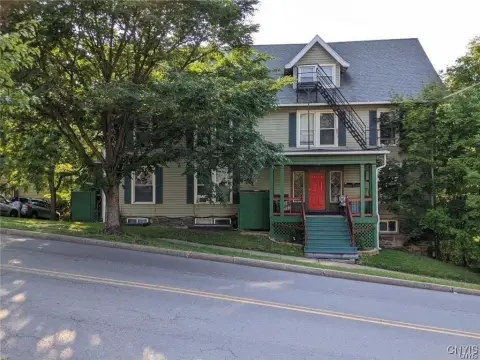
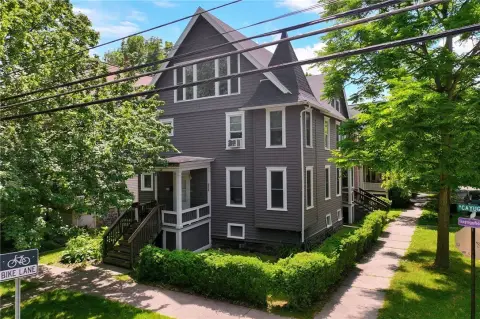
Historic-district apartment property with repainted exterior siding and dedicated parking.
Property Size4,168 SF
Price / SF$161.95
Days on Market97
Property Features for 506 E Seneca Street
General Information
Standard status
Active
Size
4,168 SF
Total Parking Spaces
6
Property subtype
Multi Family
Additional Details
Multifamily Units
6
Listing Agency:
Howard Hanna S Tier Inc
(607) 257-0800
Listed By:
Zoe Leonard
(917) 887-5458
Source:
Nicholcityrealty
Added: Jul 15
Changed: Oct 7
Last Checked: Oct 19 at 6:40AM
Displayed information is deemed reliable but is not guaranteed and should be independently verified. All listing content including descriptions, pricing, images are the copyrighted material of Howard Hanna S Tier Inc

Ask AI about this property
Review the available facts, identify missing information and prepare questions for the agent.
Investment Insights
Based on property information with market context.
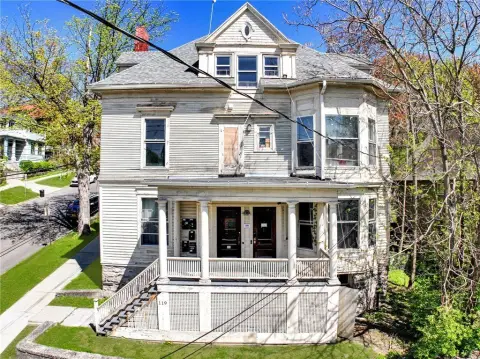
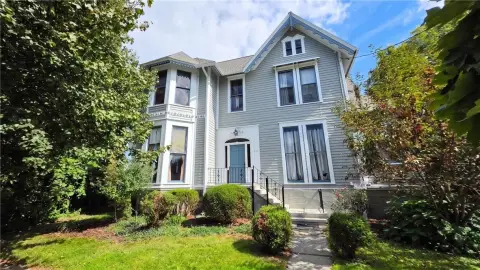
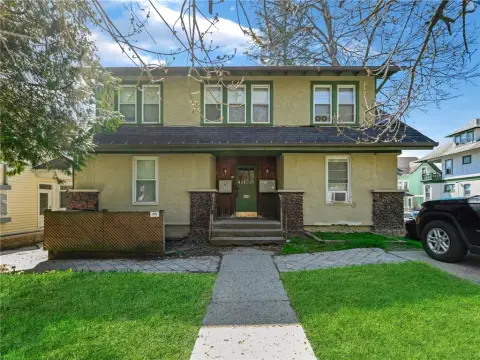
This 6-unit apartment building at 506 E Seneca Street contains 4,168 square feet and features recently repainted exterior siding. The property combines an established building presence with a defined residential configuration and six parking spaces.
The building is situated within a preserved historic district in Ithaca City, NY. Cornell University and Downtown Ithaca are both described as being within a short walk, placing the property near two recognizable local destinations.
The building is situated within a preserved historic district in Ithaca City, NY. Cornell University and Downtown Ithaca are both described as being within a short walk, placing the property near two recognizable local destinations.
Key Highlights
- 6‑unit apartment building with 4,168 square feet
- Six parking spaces included
- Exterior siding recently repainted
Financial Insights
Estimated NOI and Cap Rate
NOI / Yr
$51,126
Cap Rate
7.57%
Suggested Prices Based on Cap Rates
Cap Rate 5%
$1,022,520
$1.0M
Cap Rate 7%
$730,371
$730.4K
Cap Rate 9%
$568,067
$568.1K
Market Conditions
NOI Build-Up for 4,168 SF
Gross rent
$97.0K $23.28/SF
− Vacancy
−$4.1K −$0.98/SF
EGI
$93.0K $22.30/SF
− OpEx
−$41.8K −$10.04/SF
NOI
$51.1K $12.27/SF
Area
Tompkins County, NY
Vacancy
4.20%
Lease Rate
$23.28 /SF/Yr
Expense Ratio
45.00%
Simulate Cap Rate and NOI
Suggested Prices Based on Cap Rates
Cap Rate 5%
$1,022,520
Cap Rate 7%
$730,371
Cap Rate 9%
$568,067
Alternative Uses
Best Use
Apartment 5plus
$730.4K
$639.1K – $852.1K
NOI $51,126 @ 7.0% cap · market cap 7.57%
Second Best
—
—
no second resolved use
Theoretical Best
Office A
$1.30M
$1.14M – $1.52M
NOI $91,042 @ 7.0% cap · market cap 13.49%
Zoning and permitted uses should be independently verified with authorities.
How Realmo checks its estimates
Property Analytics
Unlock full access to Insights
Subscribe to Realmo Intelligence
Open Analytics
Lease Details
6
Residential units
Location Intelligence
Trade Area within ½ mile
2,546
Businesses Nearby
Explore this area
Business Placement
Demographics for 14850, NY
69,271
Population
31,772
Households
2.2
Avg Household Size
29
Median Age
72%
College-Educated
96%
High-School Grad
124.8 sq mi
ZIP Area
555
Density / Sq Mi
$69,689
Median Household Income
$36,115
Median Earnings
$1,446
Median Rent
$334,800
Median Home Value
Check the figures for this property
Cap Rate, Value Estimation, Potential NOI and more
View Realmo Analytics
Market
Vacancy Rate% for Multifamily in Northeast region



Frequently Asked Questions
What type of property is this?
Apartment building - Historic-district apartment property with repainted exterior siding and dedicated parking.
Where is this apartment building located?
The property is located at 506 E Seneca Street Ithaca, NY.
What is the asking price?
The asking price for this property is $675,000.
What are key features of this property?
This property features: 6‑unit apartment building with 4,168 square feet; Six parking spaces included; Exterior siding recently repainted


