Waterfront Commercial Property with
For Sale
$275,000
5044 Suder, Toledo, OH 43611
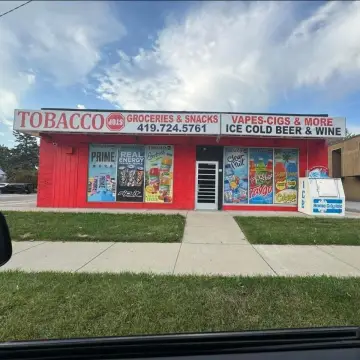
Waterfront commercial property with expansion potential and dock access.
Property Size1,769 SF
Price / SF$155.46
Days on Market203
Property Features for 5044 Suder
General Information
Standard status
Active
Size
1,769 SF
Property subtype
Retail
Building Details
Building Size
1,769 SF
Year Built
1967
Listed By:
Matt Kwiatkowski
(419) 779-7548
Source:
Millerdiversified
Added: Mar 27
Changed: Oct 4
Last Checked: Oct 12 at 5:53PM
Displayed information is deemed reliable but is not guaranteed and should be independently verified. All listing content including descriptions, pricing, images are the copyrighted material of Matt Kwiatkowski
Investment Insights
Based on property information with market context.
This commercial property is located on a busy corner in the Point Place area of Toledo. The property includes a building with over 1,700 square feet of space. There is space available for expansion, along with a large patio overlooking the water with dock access. The property also features two large volleyball courts and frontage on both Suder Avenue and Shoreland Avenue. The zoning allows for potential income opportunities with water frontage and expressway access. The property benefits from high visibility and accessibility.
Key Highlights
- Waterfront property with dock access and large patio overlooking the water.
- High‑visibility corner location in the Point Place area of Toledo with frontage on two streets.
- 1,700+ SF building with space to expand.
Financial Insights
Estimated NOI and Cap Rate
NOI / Yr
$11,533
Cap Rate
4.19%
Suggested Prices Based on Cap Rates
Cap Rate 5%
$230,660
$230.7K
Cap Rate 7%
$164,757
$164.8K
Cap Rate 9%
$128,144
$128.1K
Market Conditions
NOI Build-Up for 1,769 SF
Gross rent
$17.8K $10.08/SF
− Vacancy
−$1.4K −$0.77/SF
EGI
$16.5K $9.31/SF
− OpEx
−$4.9K −$2.79/SF
NOI
$11.5K $6.52/SF
Area
Toledo, OH
Vacancy
7.60%
Lease Rate
$10.08 /SF/Yr
Expense Ratio
30.00%
Simulate Cap Rate and NOI
Suggested Prices Based on Cap Rates
Cap Rate 5%
$230,660
Cap Rate 7%
$164,757
Cap Rate 9%
$128,144
Alternative Uses
Best Use
Retail
$164.8K
$144.2K – $192.2K
NOI $11,533 @ 7.0% cap · market cap 4.19%
Second Best
—
—
no second resolved use
Theoretical Best
Office A
$294.4K
$257.6K – $343.5K
NOI $20,608 @ 7.0% cap · market cap 7.49%
Zoning and permitted uses should be independently verified with authorities.
How Realmo checks its estimates
Property Analytics
Unlock full access to Insights
Subscribe to Realmo Intelligence
Open Analytics
Current Use
Location Intelligence
Trade Area within ½ mile
155
Businesses Nearby
80k
Monthly Visits Nearby
Explore this area
Business Placement
Foot Traffic Nearby
Groceries 47%
Shops & Services 41%
Dining 11%
Beauty & Spa 2%
Kroger
Groceries
37,553 visits/mo
0.5 miles
Kroger Fuel Center
Shops & Services
12,137 visits/mo
0.4 miles
BP
Shops & Services
6,950 visits/mo
0.3 miles
Sunoco
Shops & Services
6,708 visits/mo
0.3 miles
China King
Dining
4,371 visits/mo
0.4 miles
Demographics for 43611, OH
18,505
Population
8,854
Households
2.1
Avg Household Size
41
Median Age
16%
College-Educated
88%
High-School Grad
7.3 sq mi
ZIP Area
2,535
Density / Sq Mi
$58,135
Median Household Income
$36,185
Median Earnings
$832
Median Rent
$117,400
Median Home Value
Check the figures for this property
Cap Rate, Value Estimation, Potential NOI and more
View Realmo Analytics
Market
Vacancy Rate% for Retail in Midwest region

Questions? Ask Rey
Realmo’s AI knows this listing — price, zoning, demand, history. Ask anything.




Frequently Asked Questions
What type of property is this?
Retail space - Waterfront commercial property with expansion potential and dock access.
Where is this retail space located?
The property is located at 5044 Suder Toledo, OH.
What is the asking price?
The asking price for this property is $275,000.
What are key features of this property?
This property features: Waterfront property with dock access and **large patio overlooking the water.**; High‑visibility corner location in the Point Place area of Toledo with frontage on two streets.; 1,700+ SF building with space to expand.


