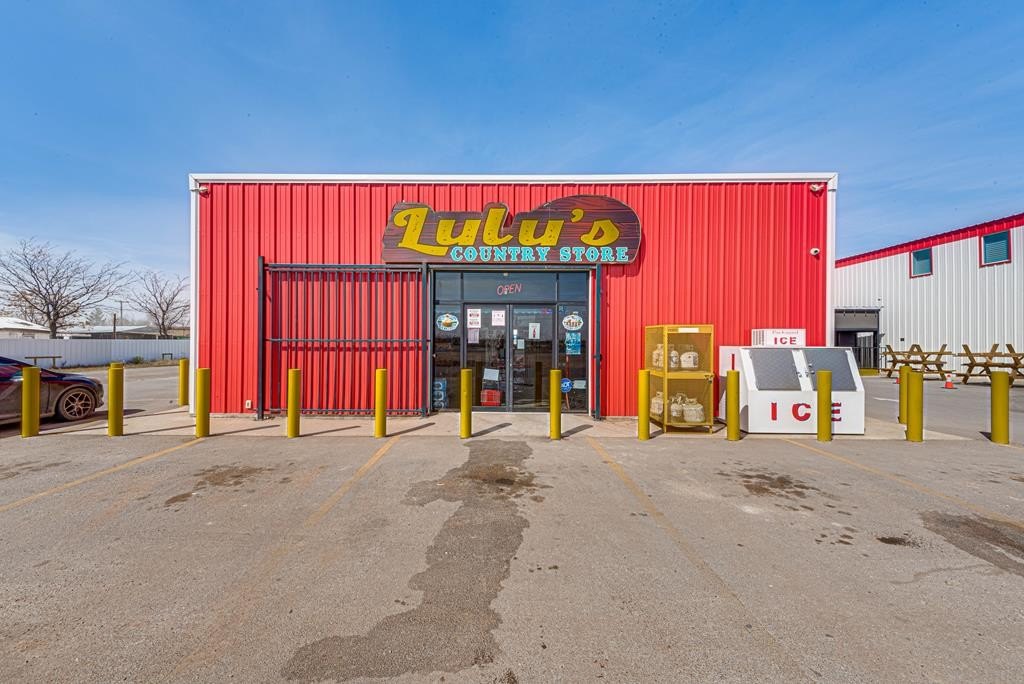
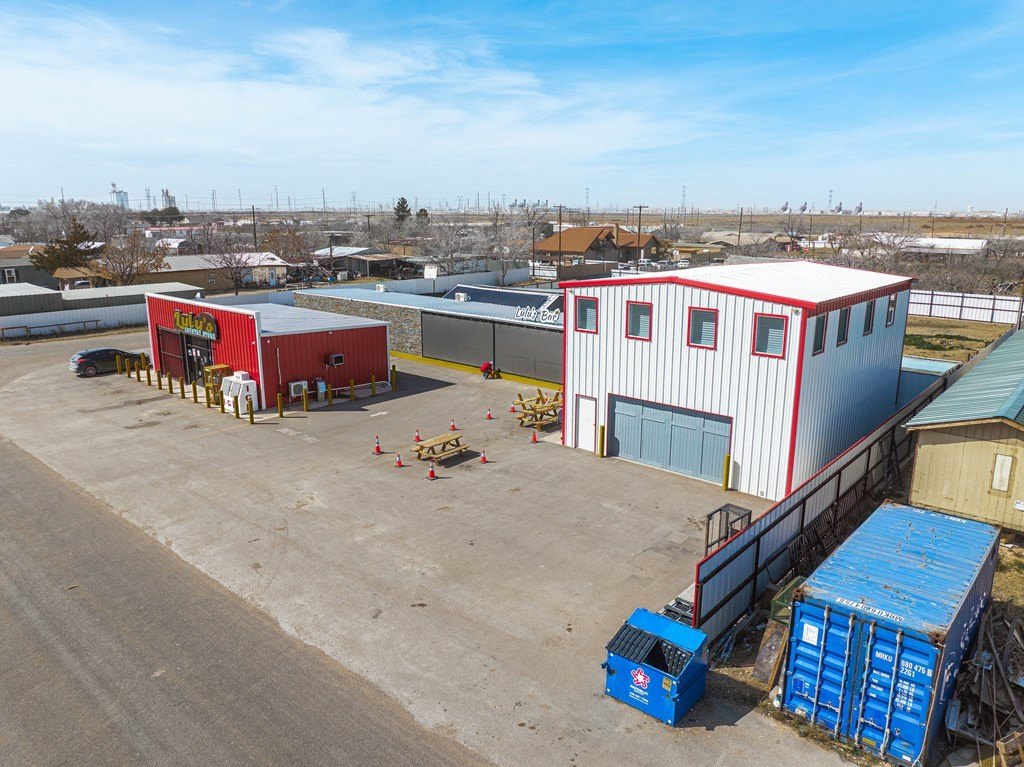
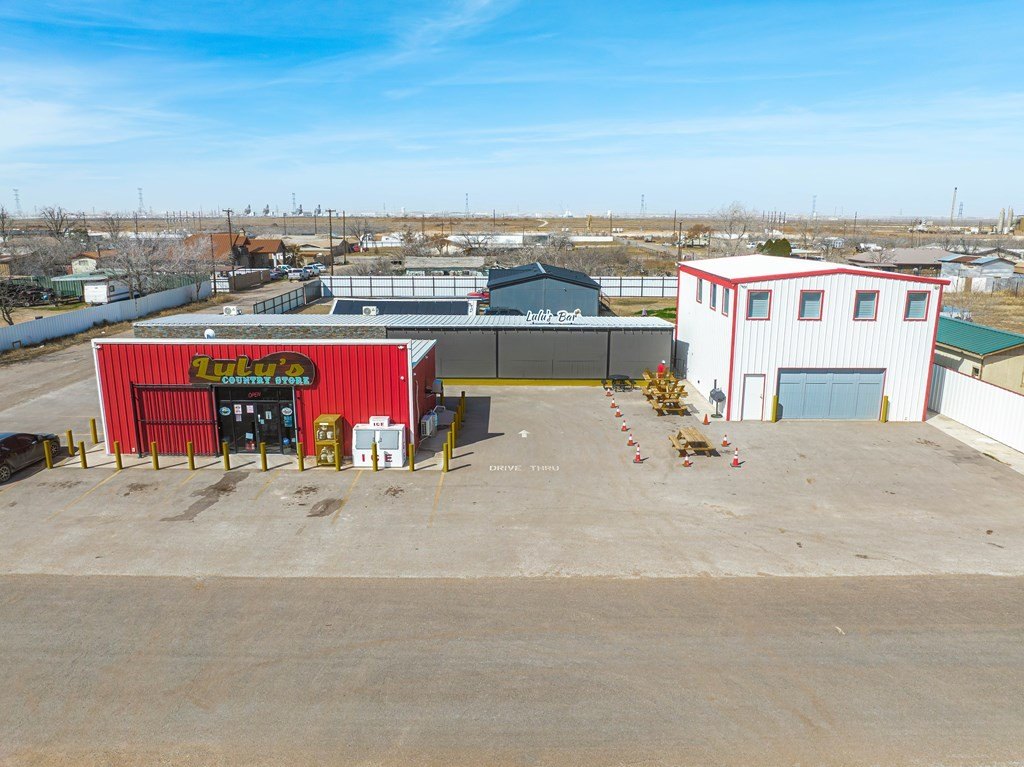
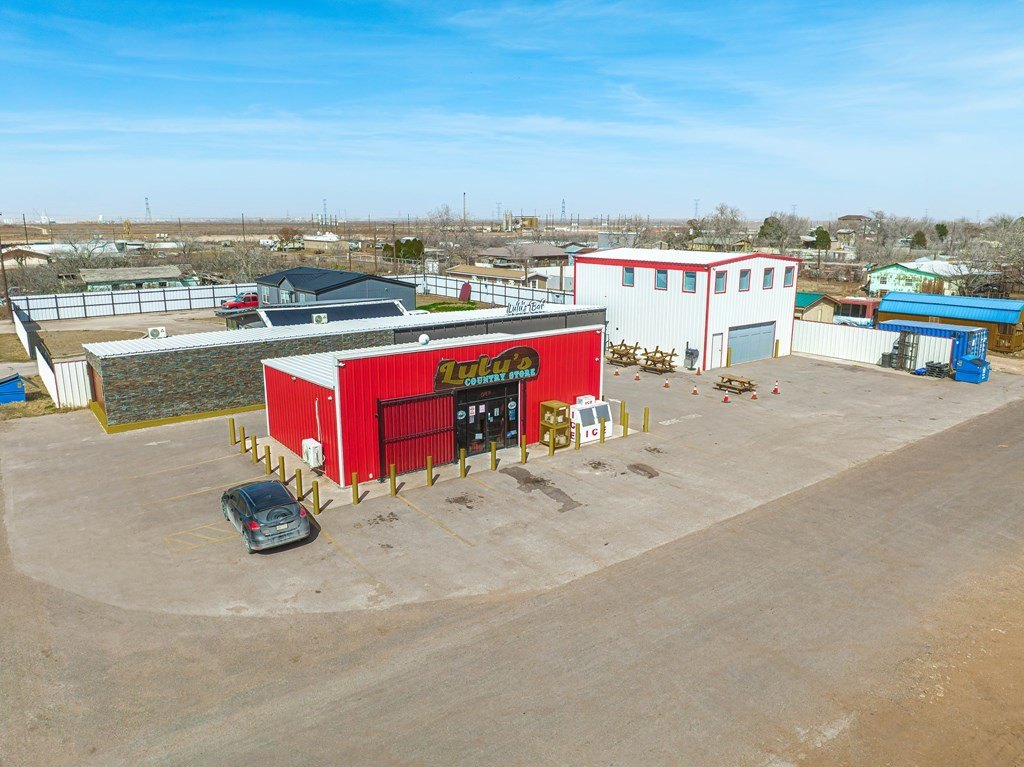
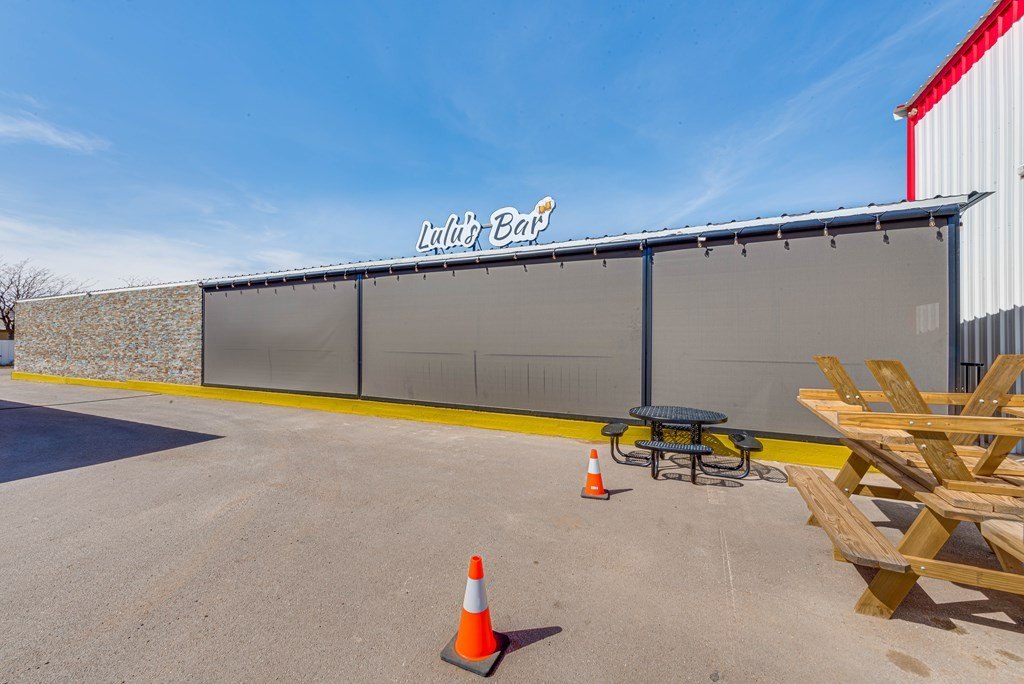
Bar and Convenience Store
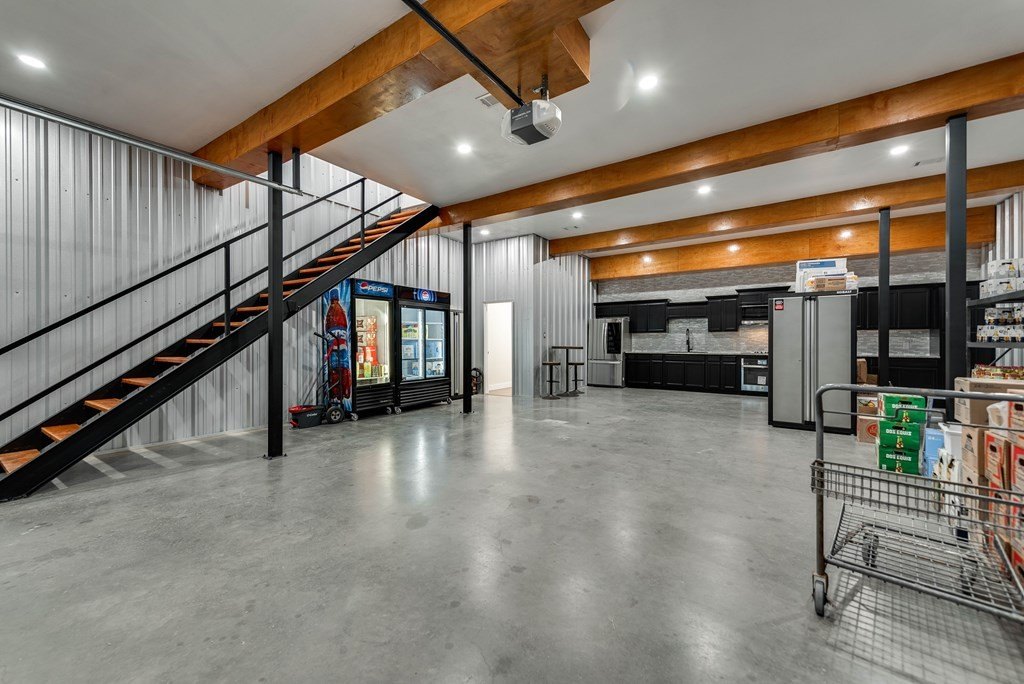
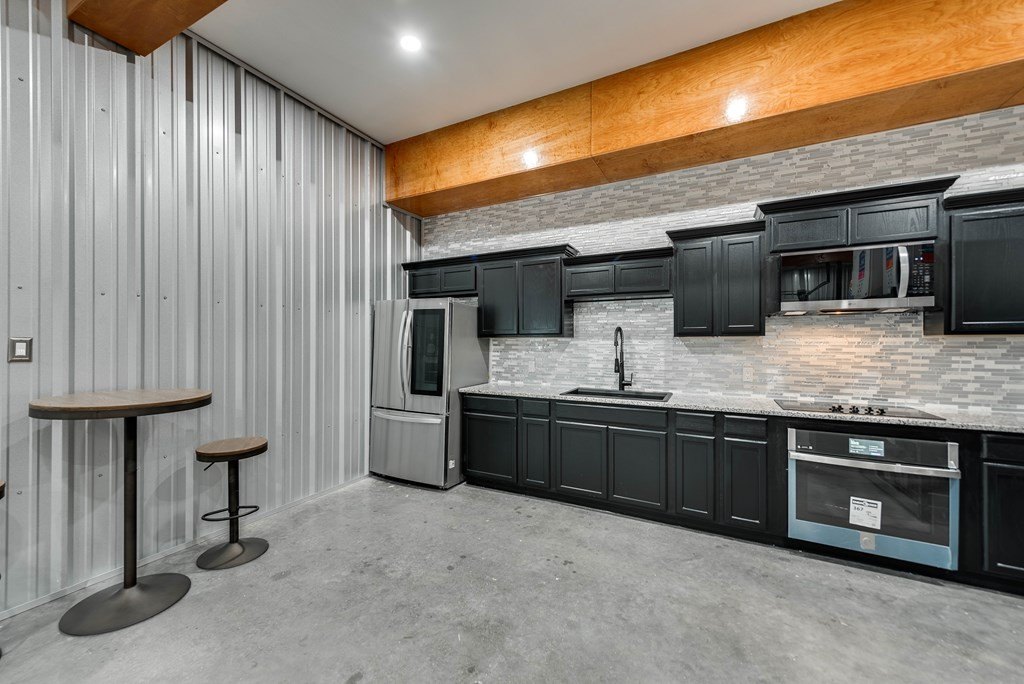
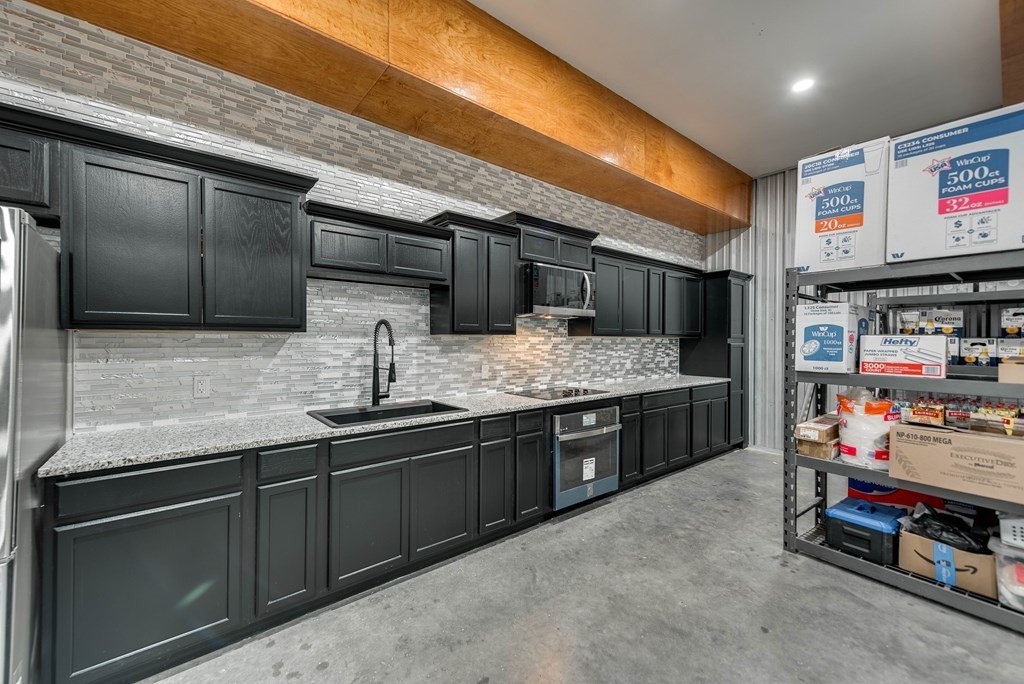
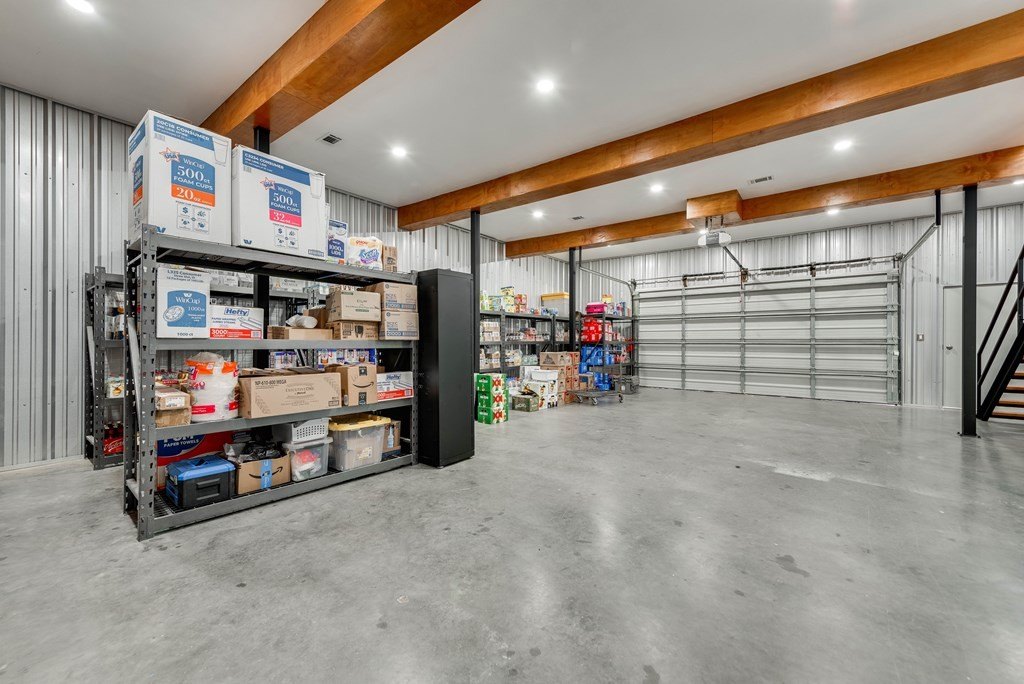
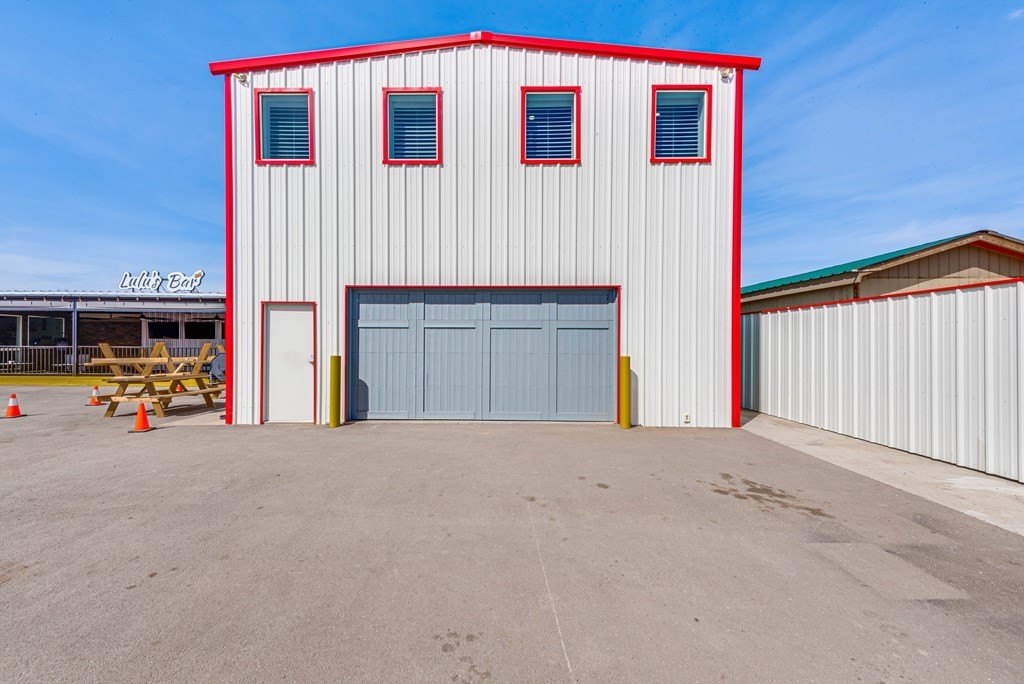
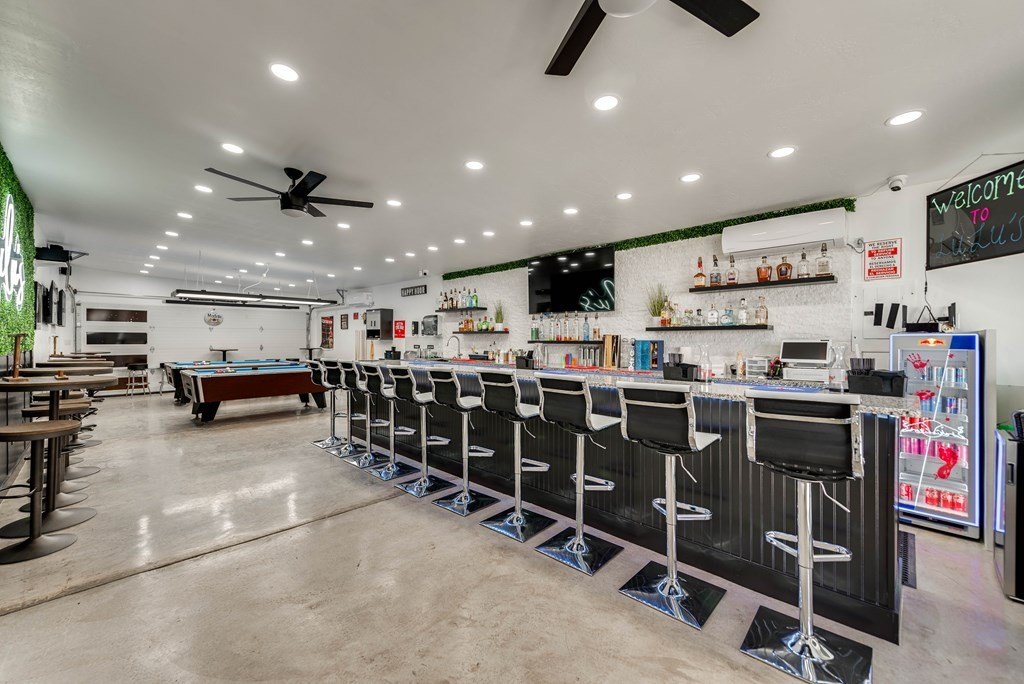
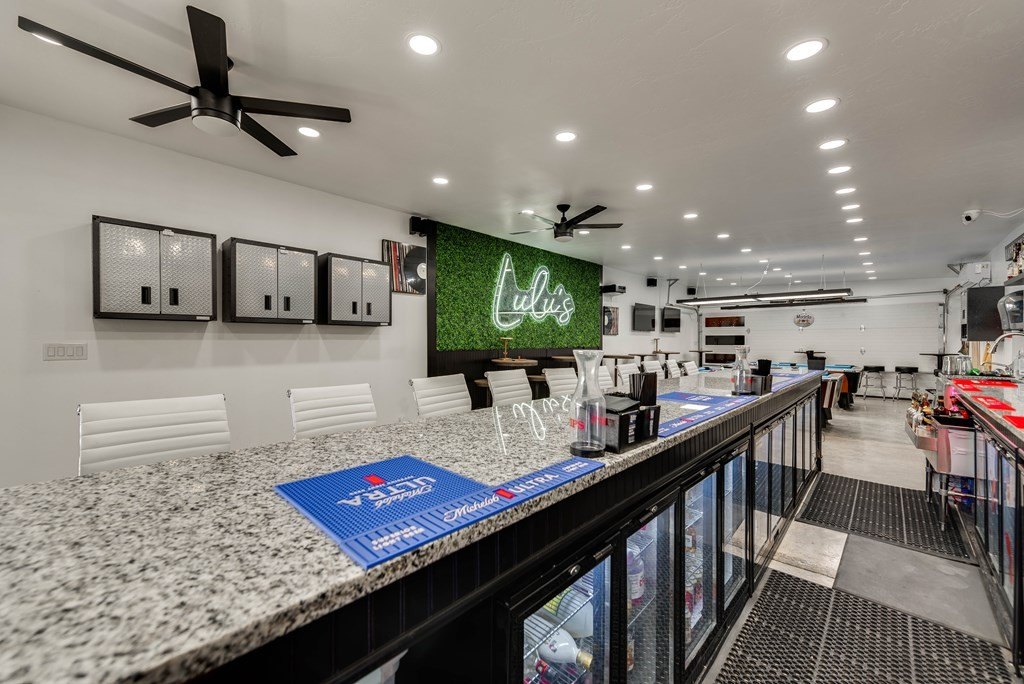
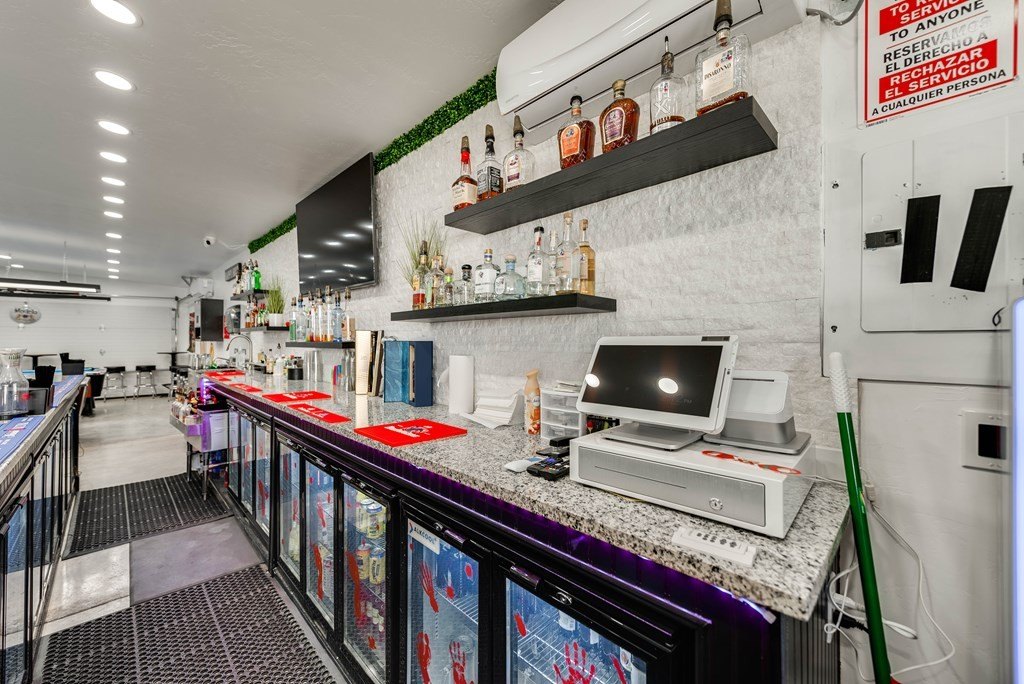
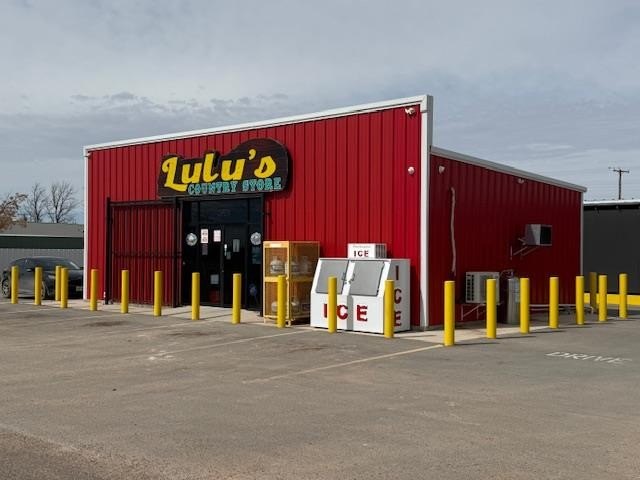
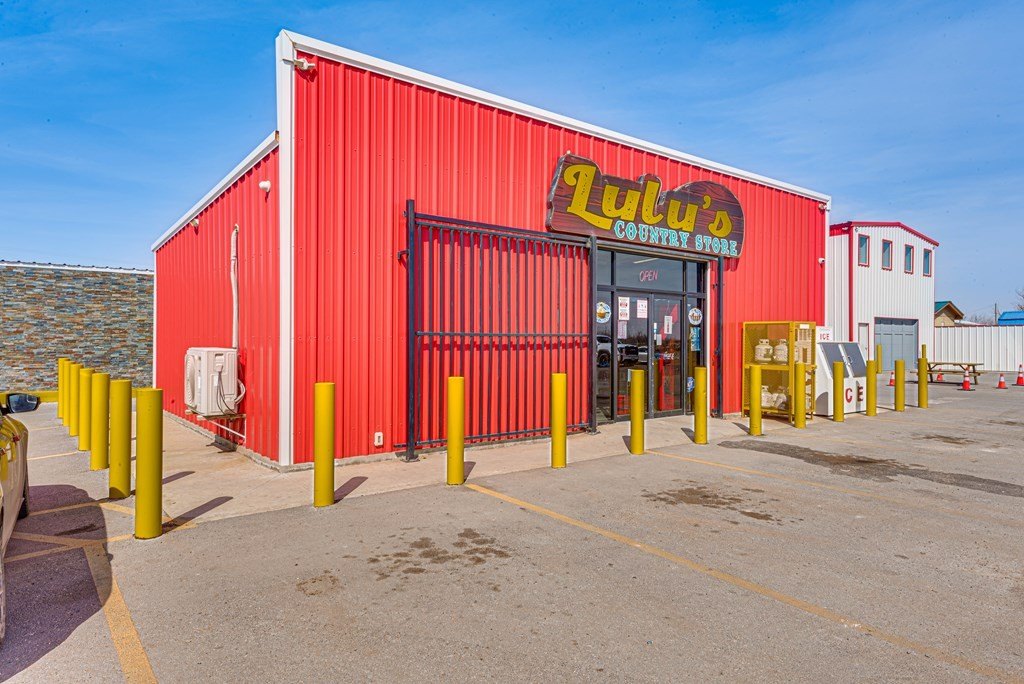
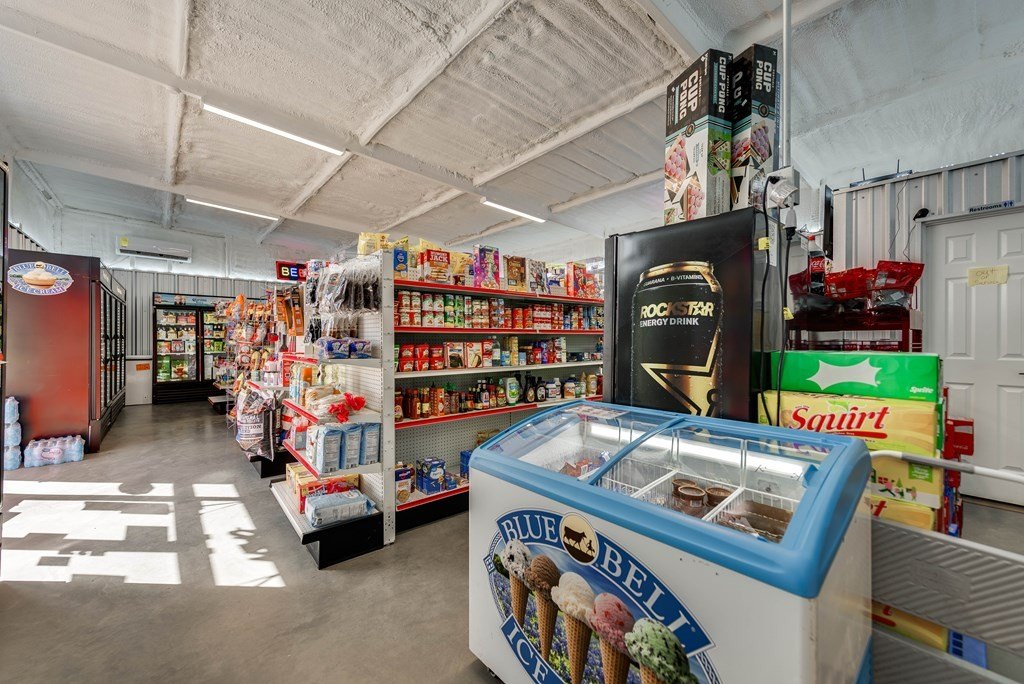
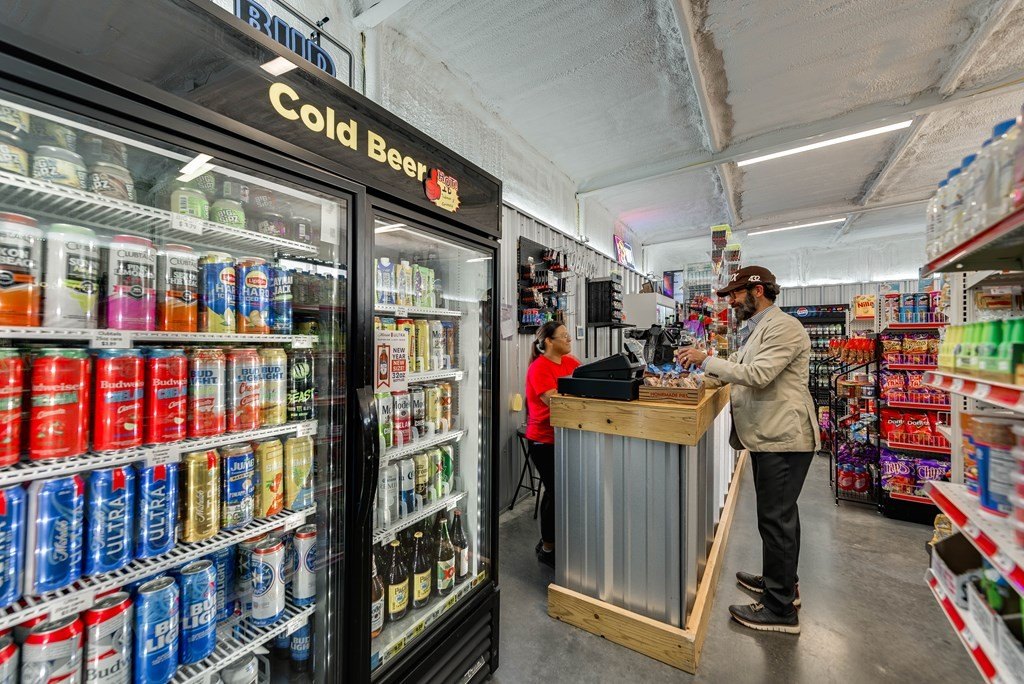
For Sale
$899,900
5011 E Hammett Dr, Odessa, TX 79766
Commercial Sale, Odessa, TX
Property Size5,400 SF
Lot Size0.34 Acres
Price / SF$166.65
Days on Market230
Property Features for 5011 E Hammett Dr
General Information
Property type
Commercial Sale
Property subtype
Other
Subdivision
Martin n Boan
Standard status
Active
Size
5,400 SF
Lot size
0.34 Acres
Taxes and HOA fees
Tax Description
MARTIN & BOAN SUBDIVISION BLOCK 3 SOUTH 74 FT OF THE W 1/2 OF LOT 24
Tax Annual Amount
9999999
Legal Description
MARTIN & BOAN SUBDIVISION BLOCK 3 SOUTH 74 FT OF THE W 1/2 OF LOT 24
Building Details
Year built
2023
Listing Agency:
Pine & Beckett - Chris Beckett
(432) 686-7000
Listed By:
Chris Beckett Broker Owner CRS GRI ASR e-Pro
(432) 349-7000
Added: Feb 25
Changed: Oct 5
Last Checked: Oct 13 at 8:06PM
MLS# 50091129
Copyright © 2026 Permian Basin Board of Realtors. All rights reserved. All information provided by the listing agent/broker is deemed reliable but is not guaranteed and should be independently verified.
Investment Insights
Based on property information with market context.
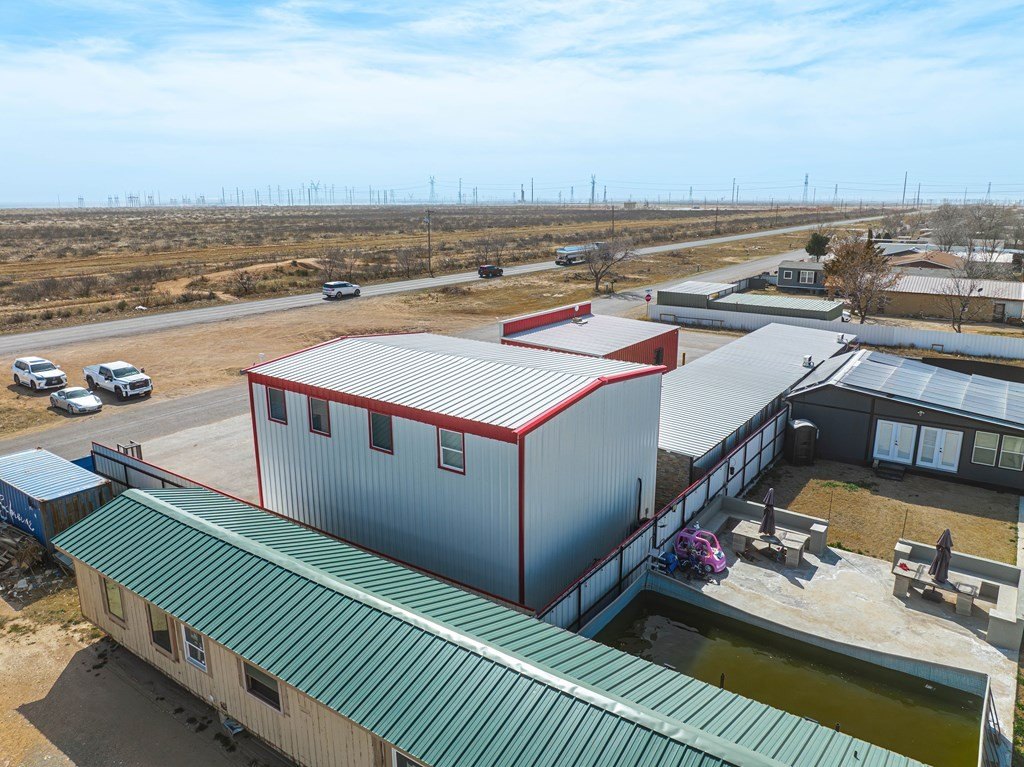
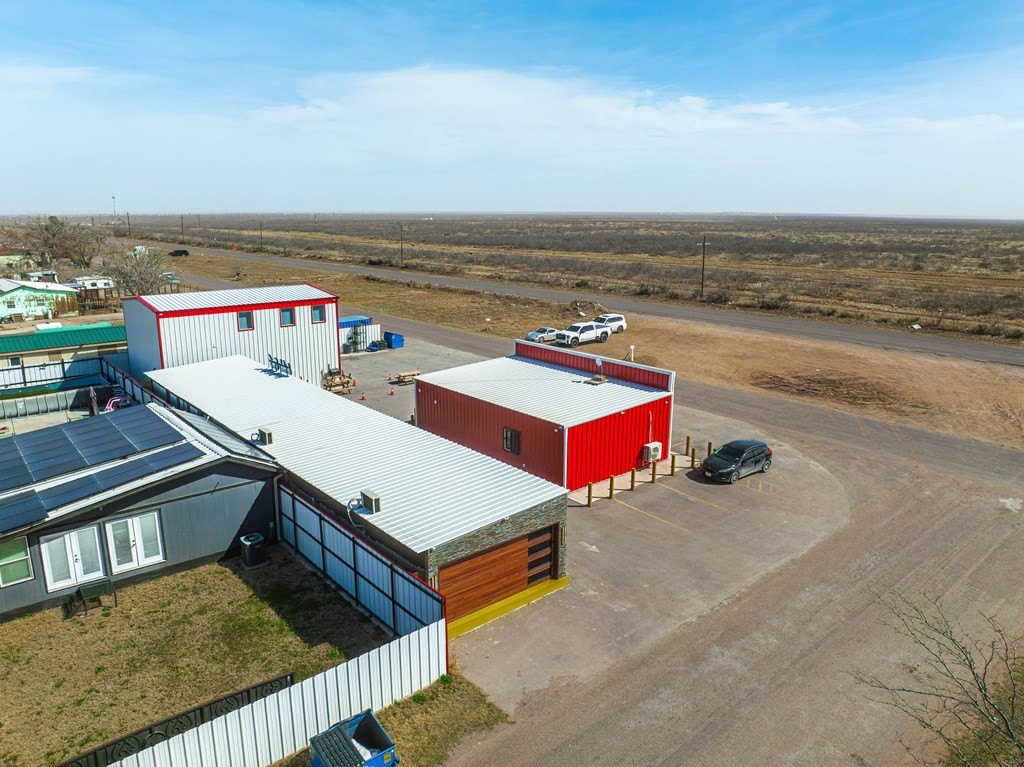
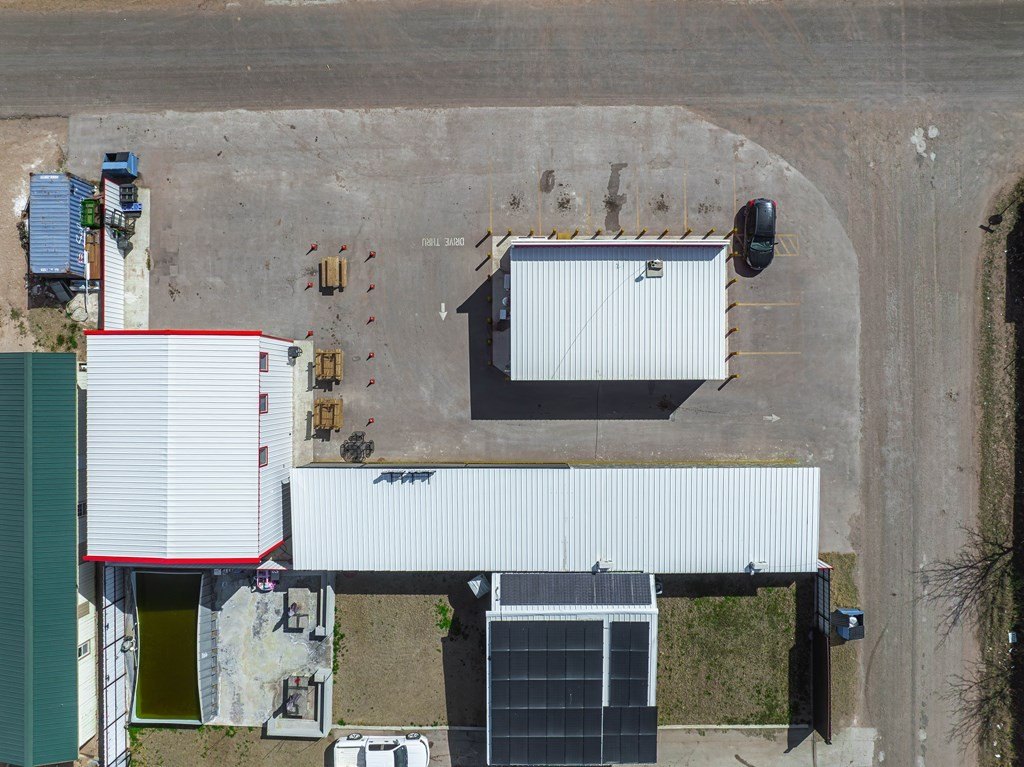
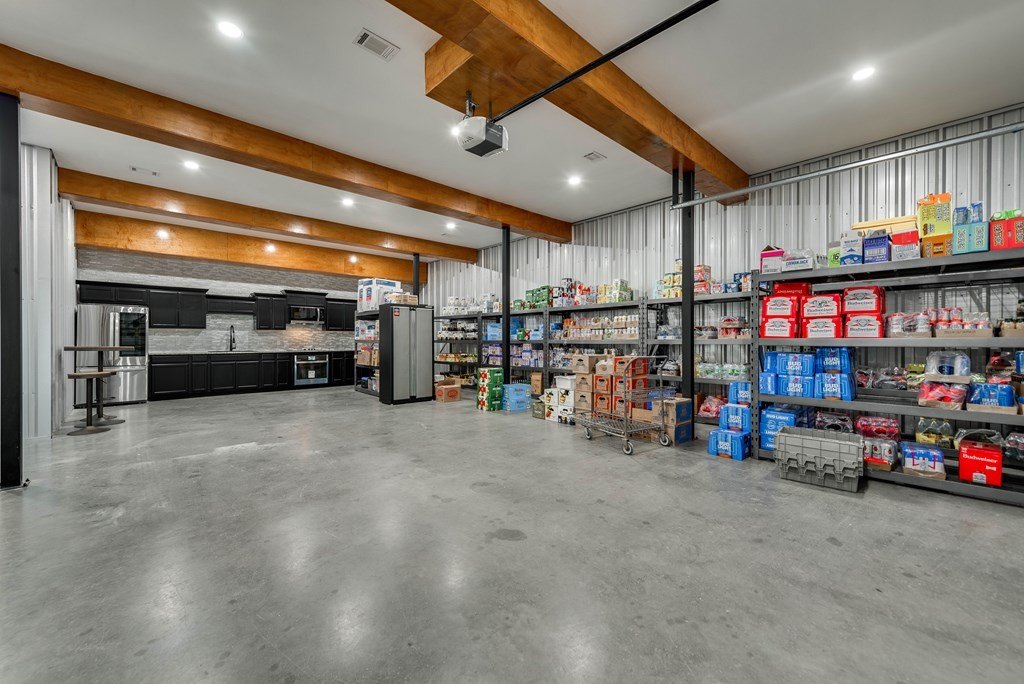
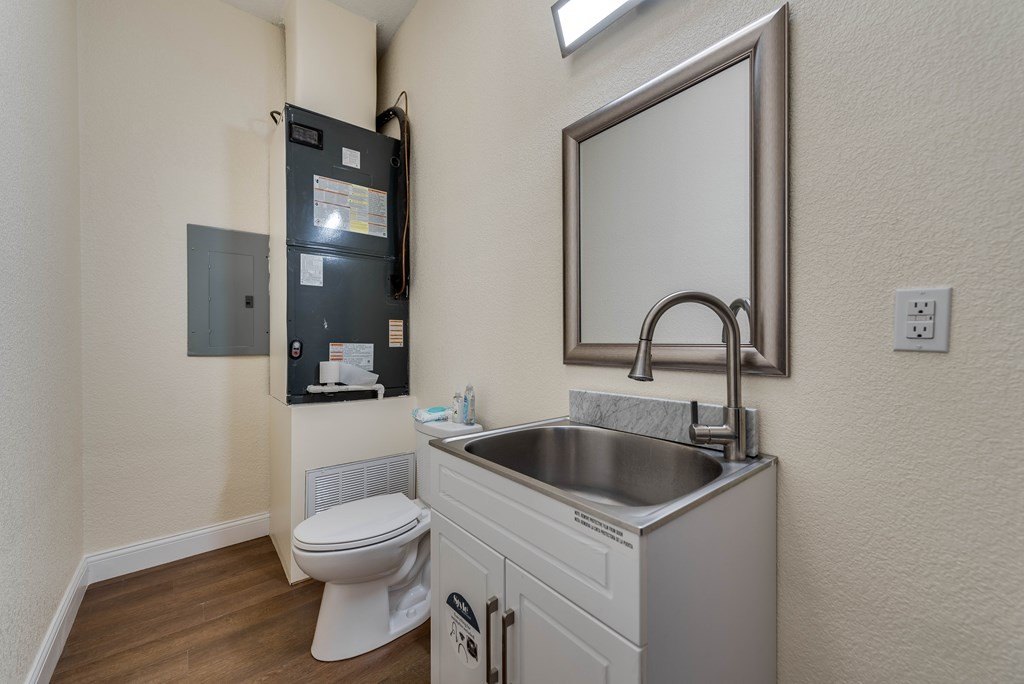
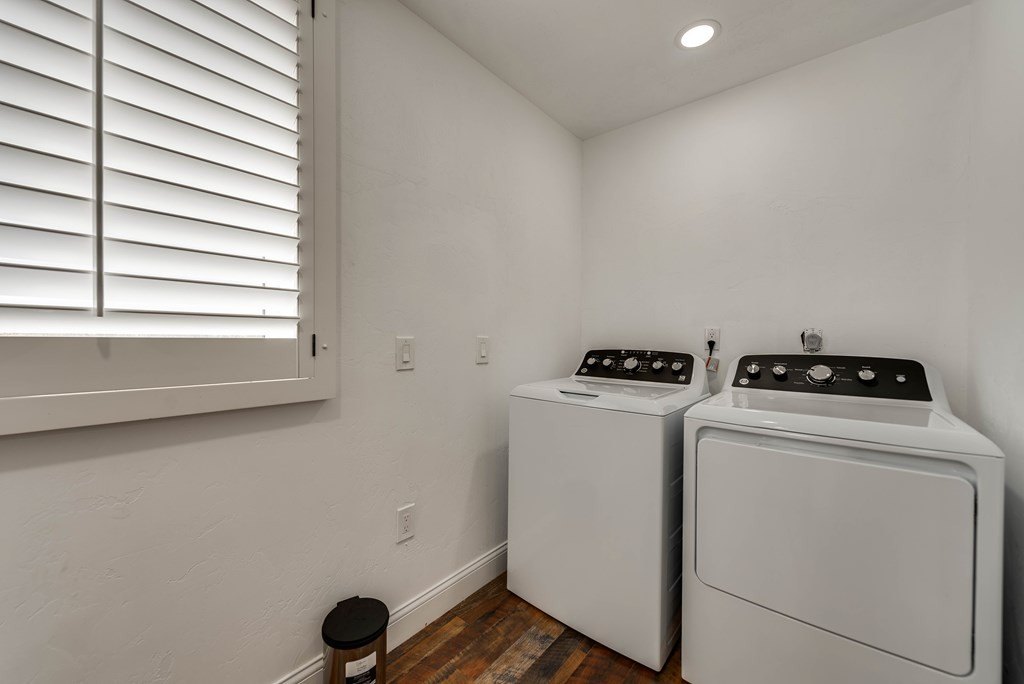
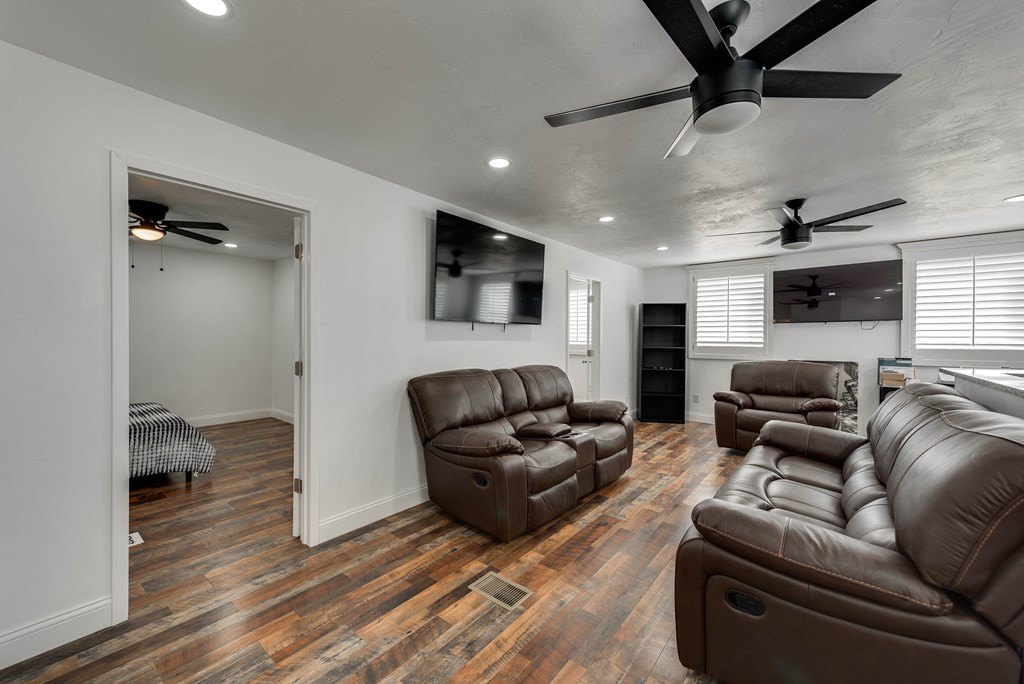
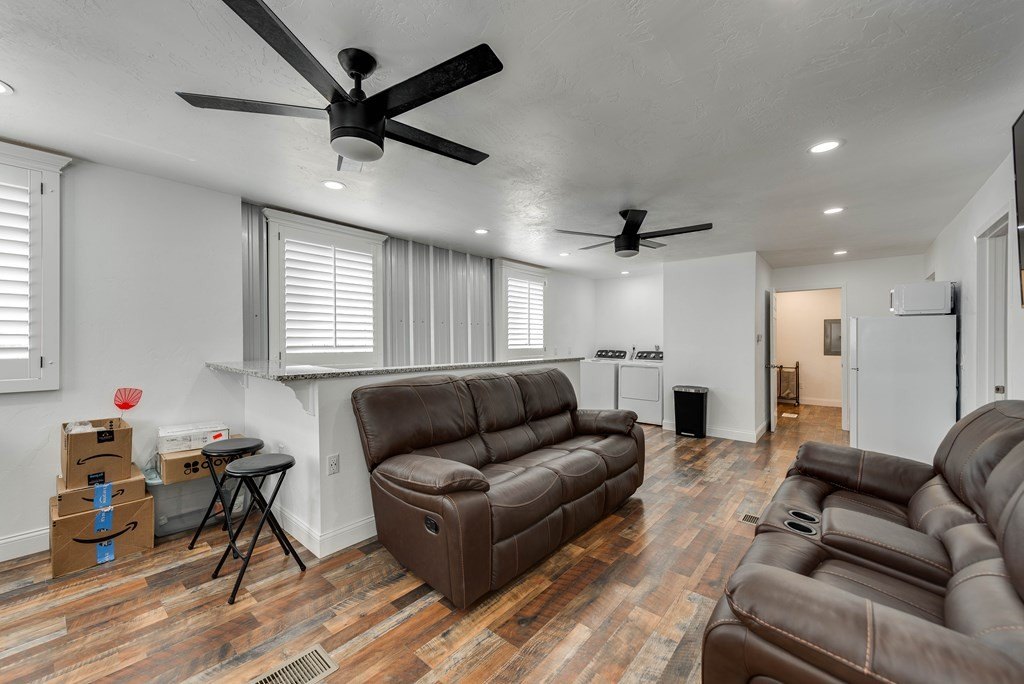
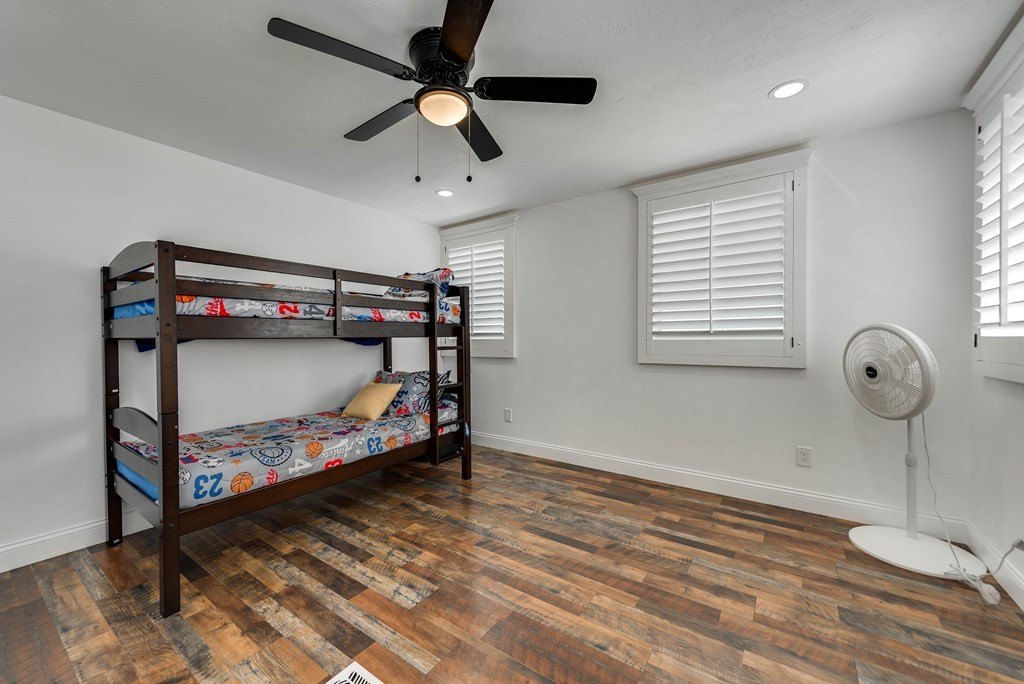
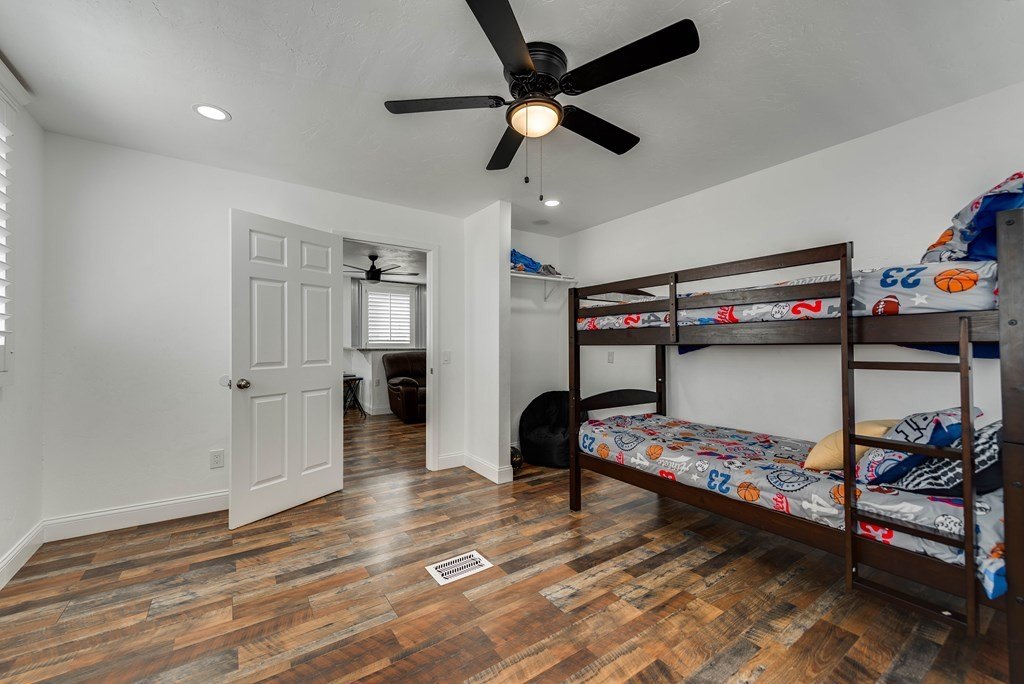
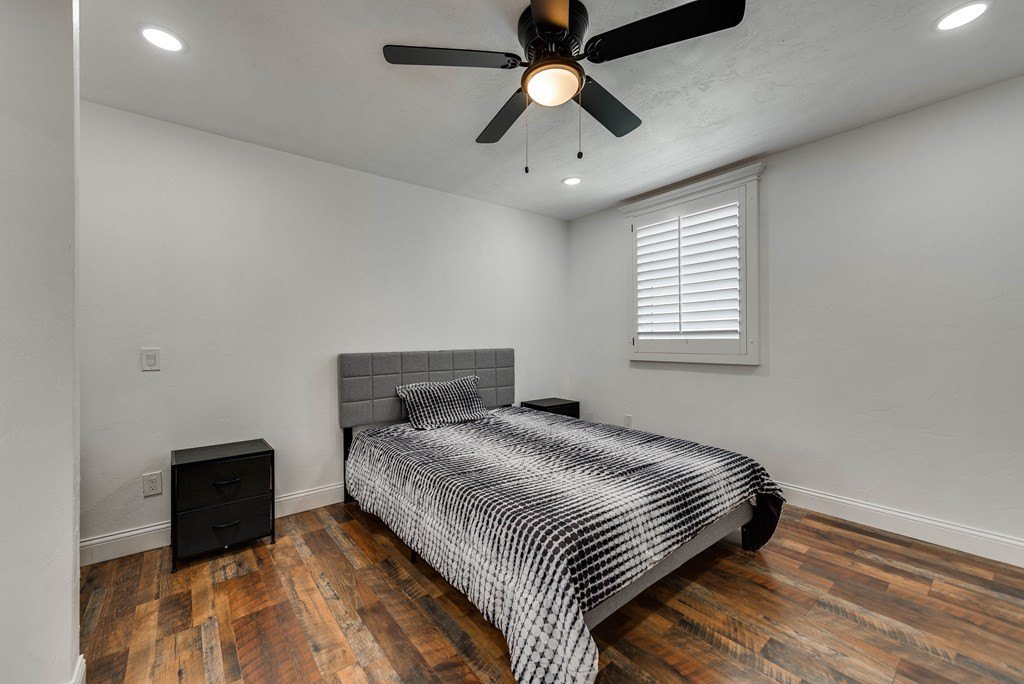
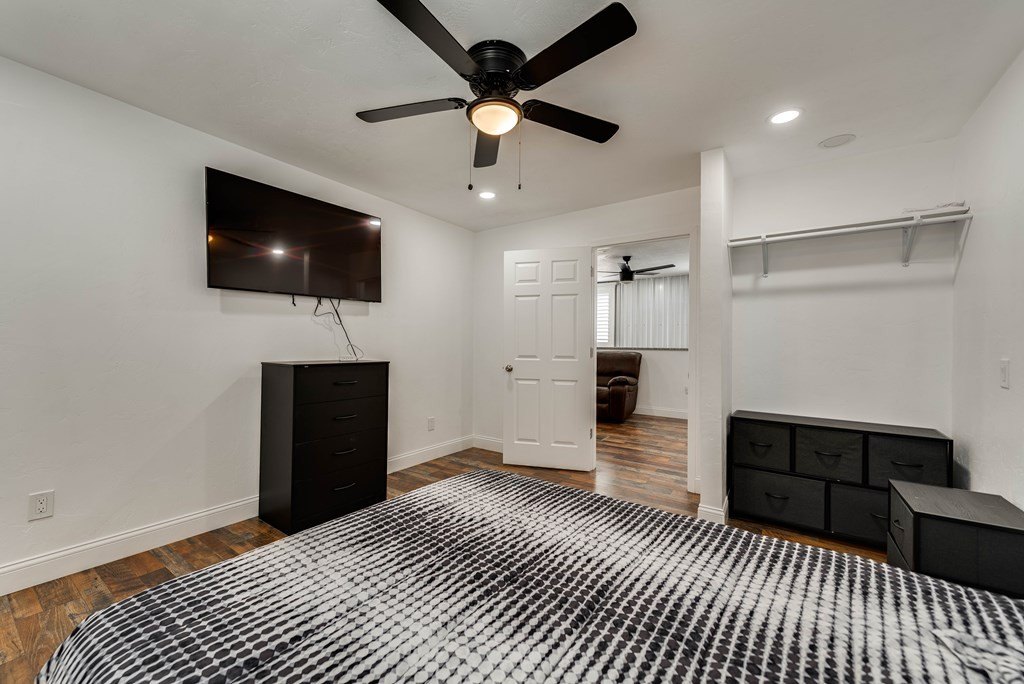
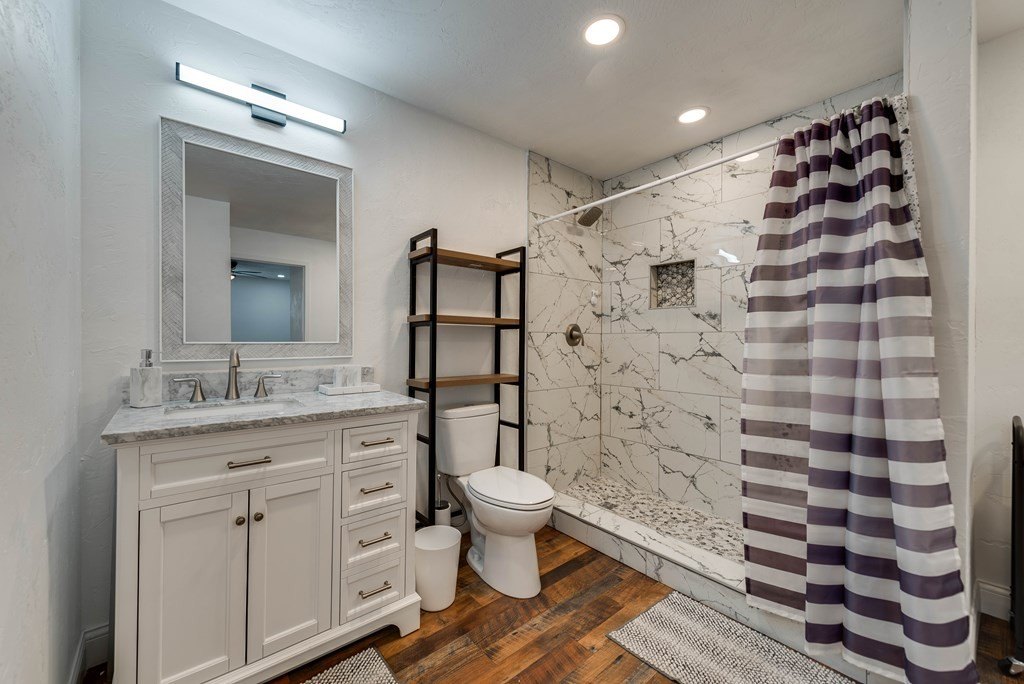
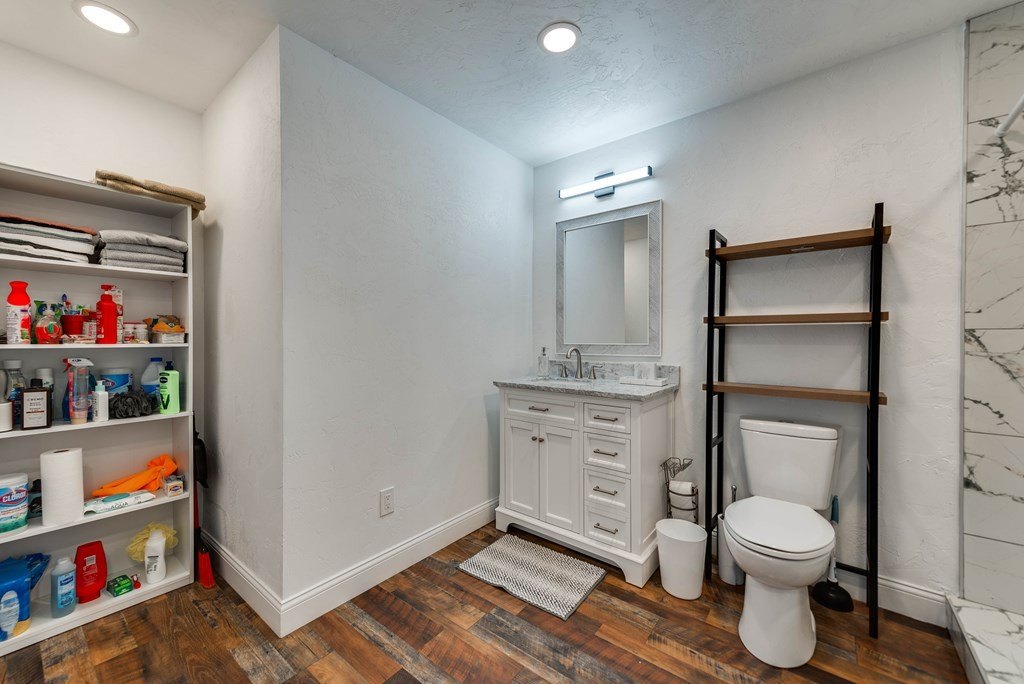
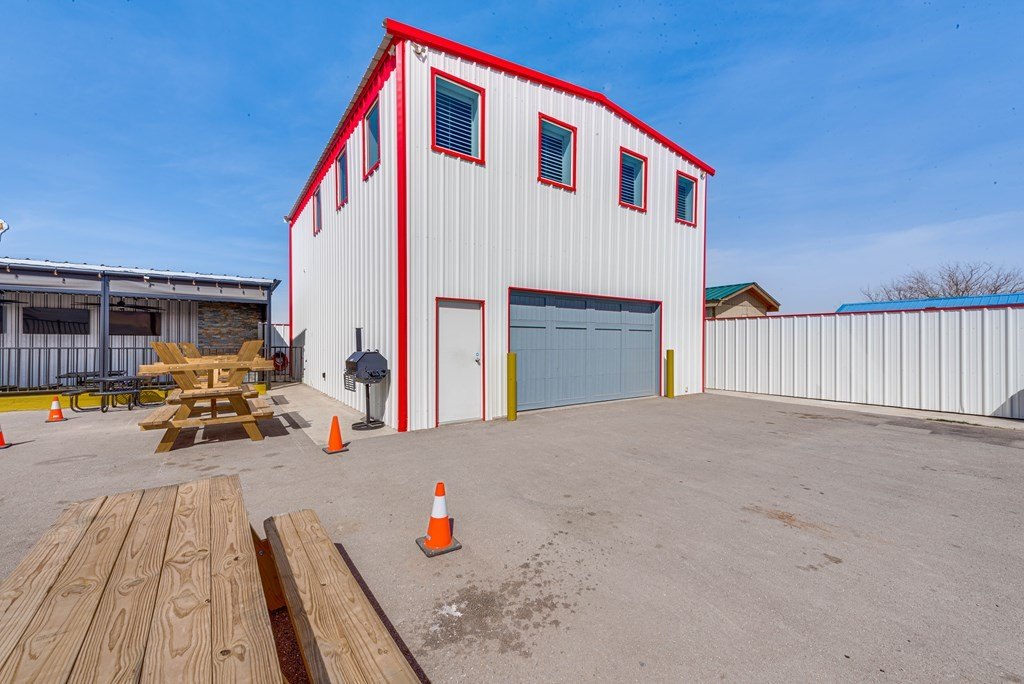
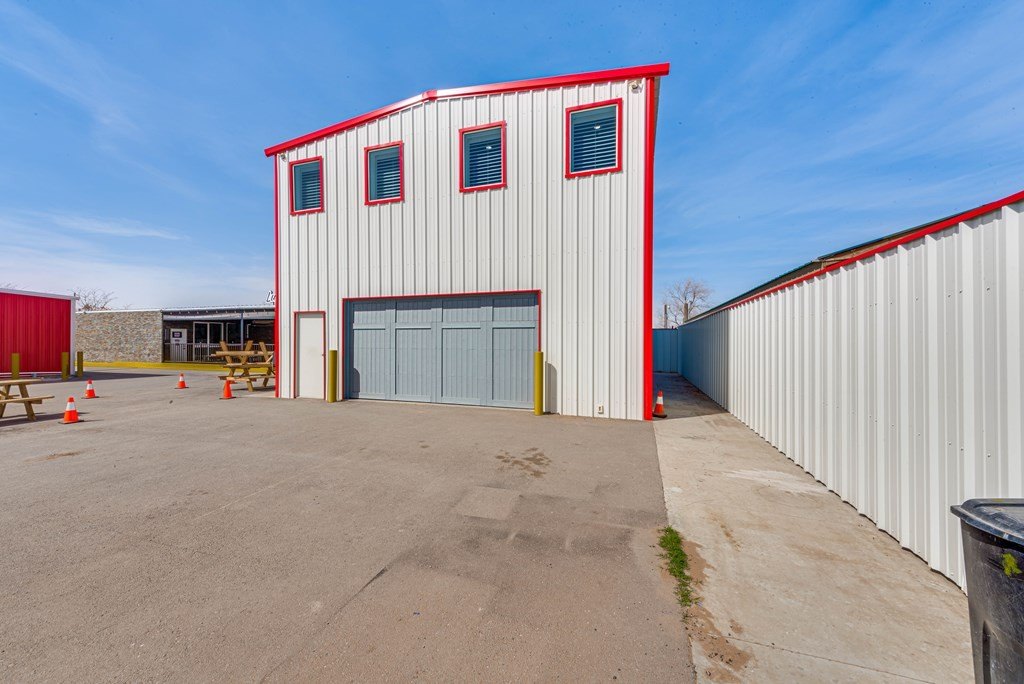
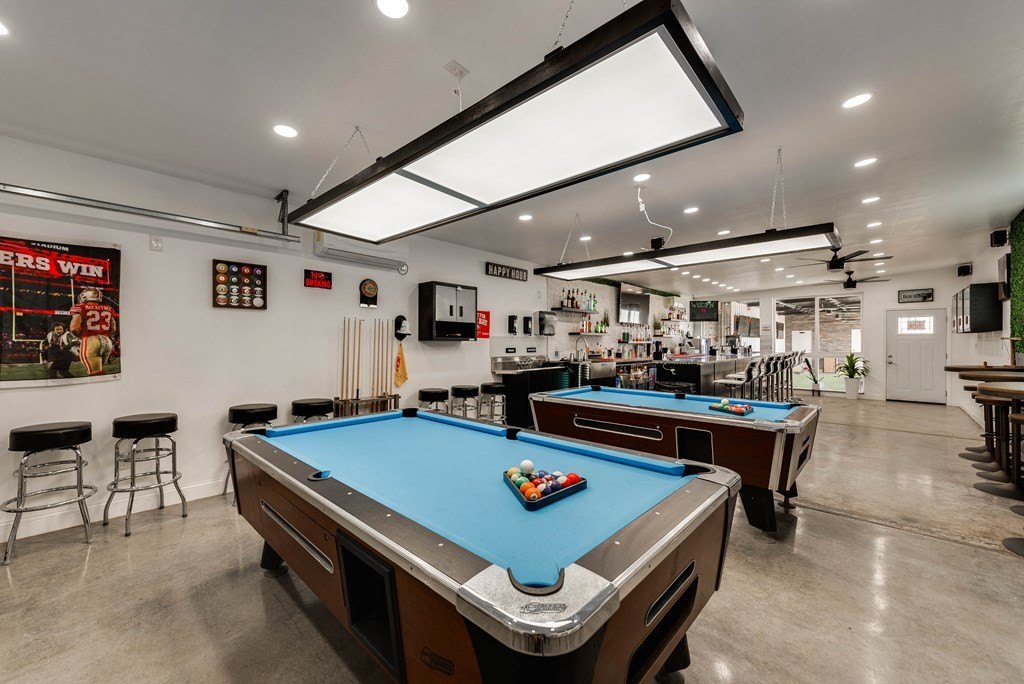
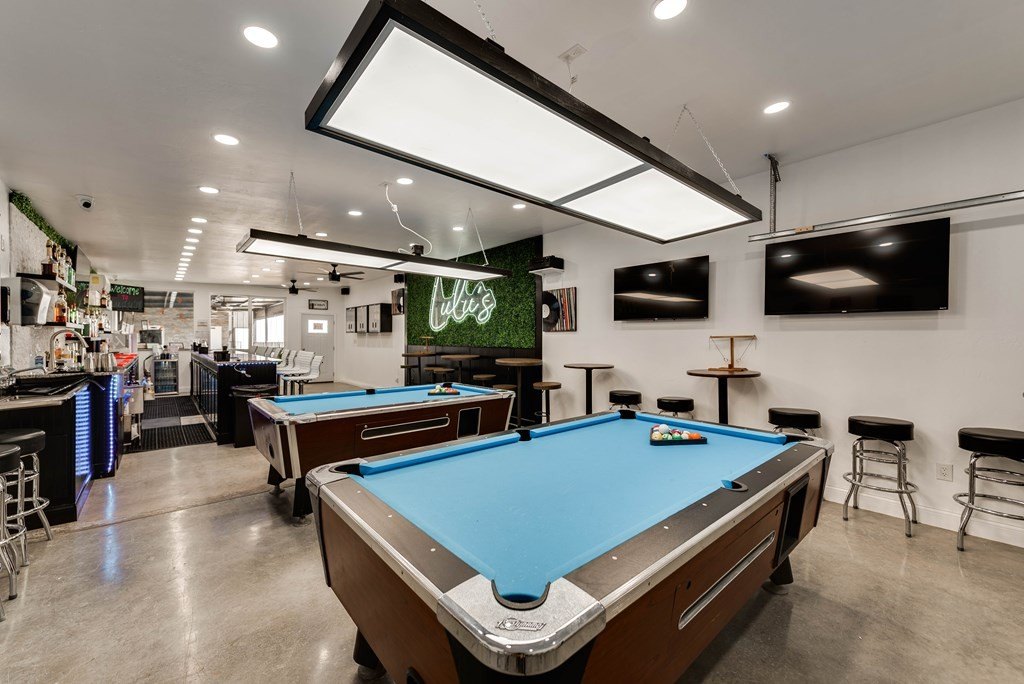
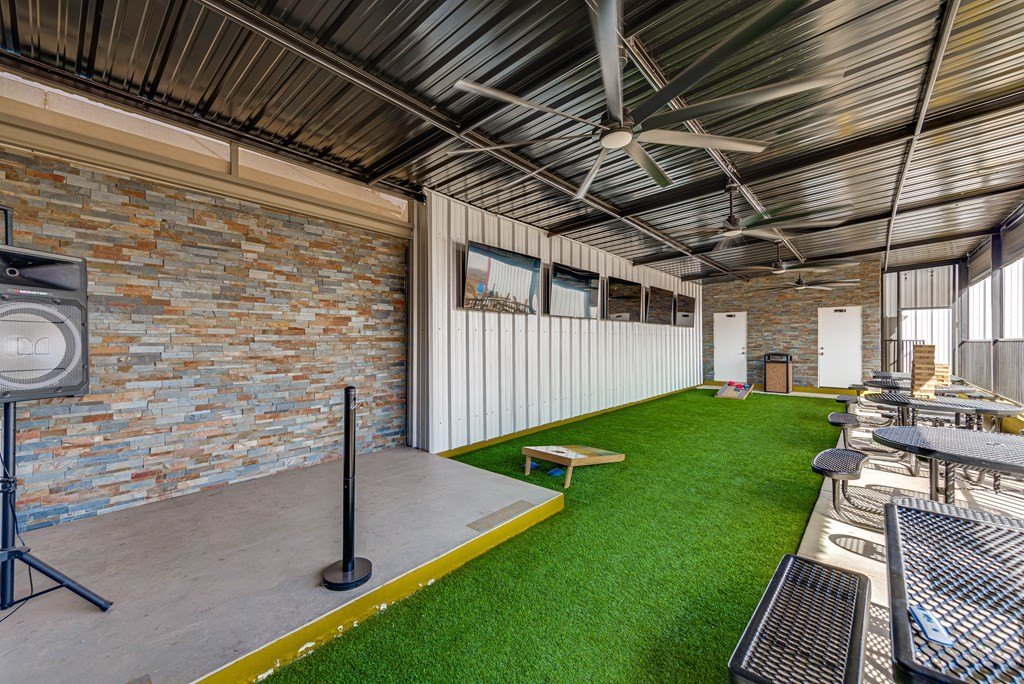
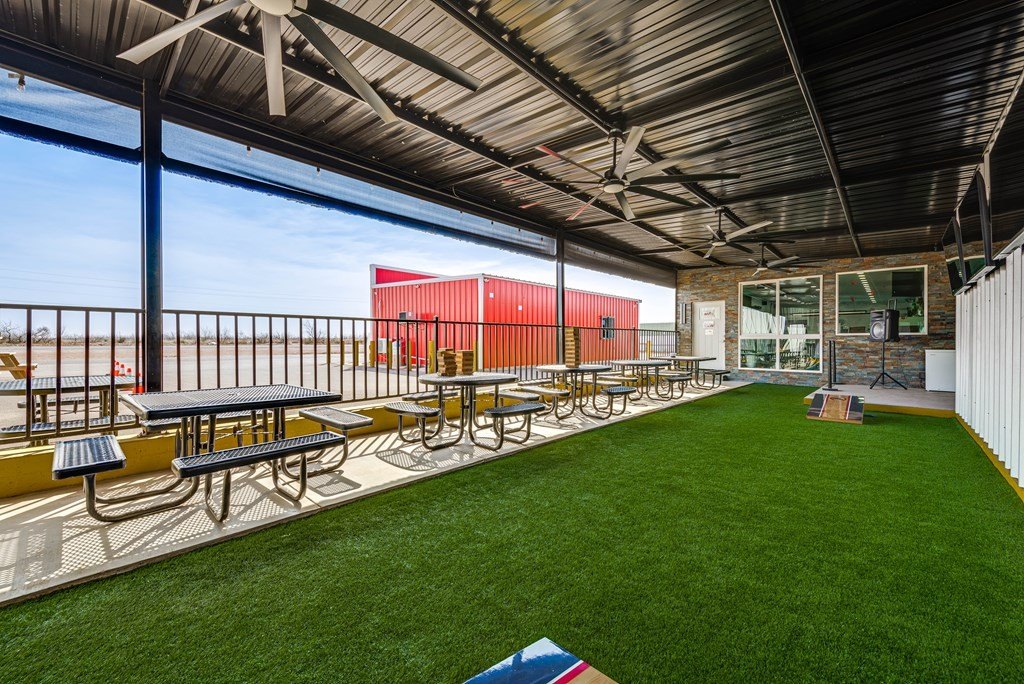
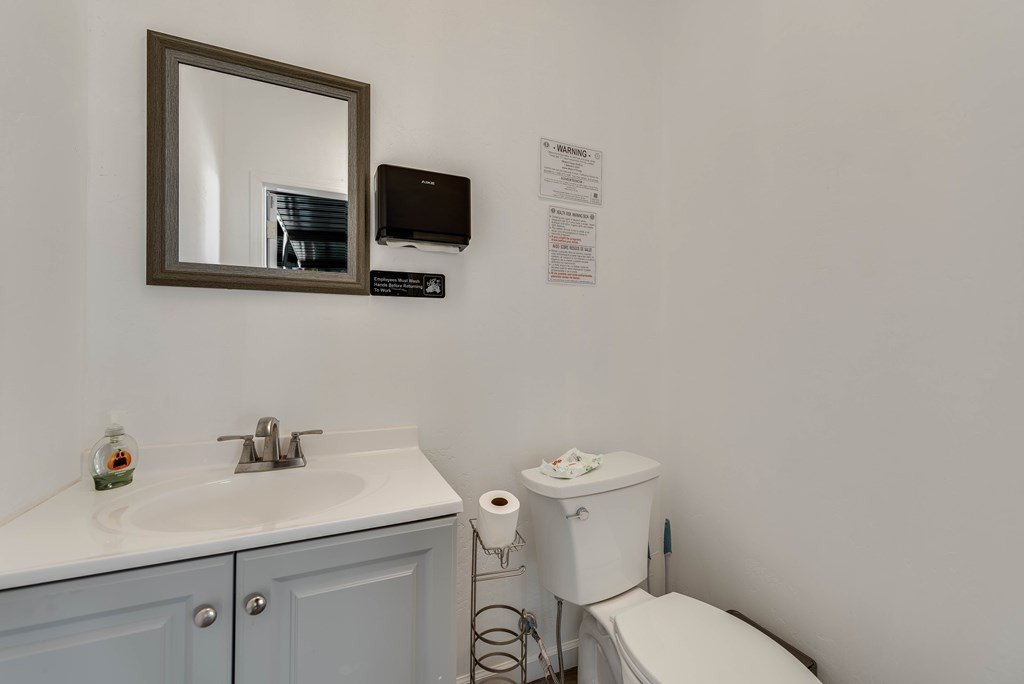
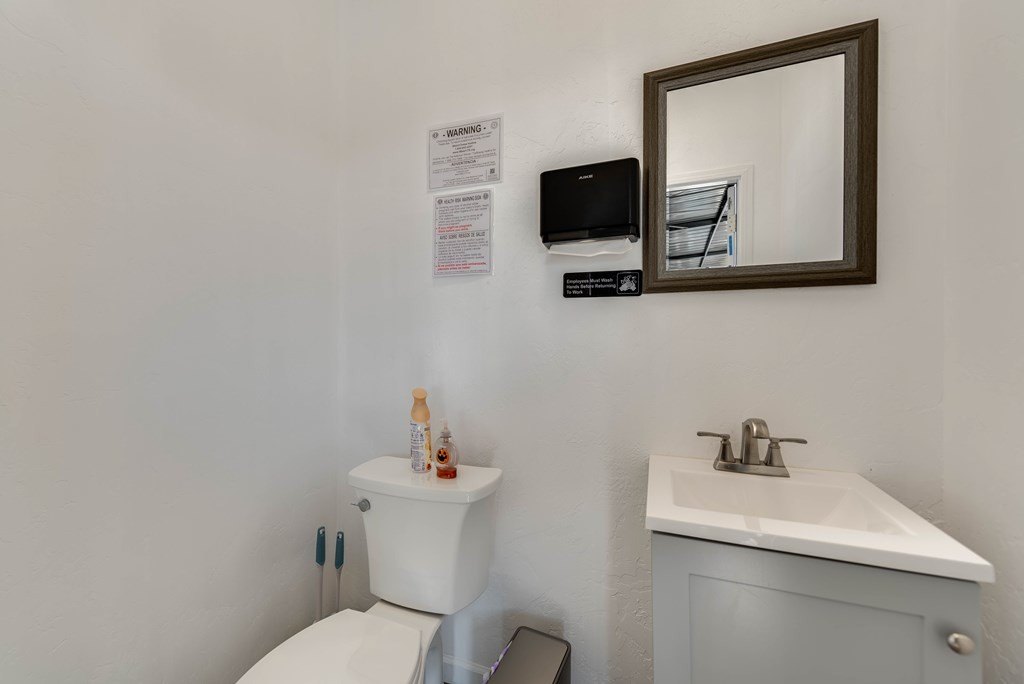
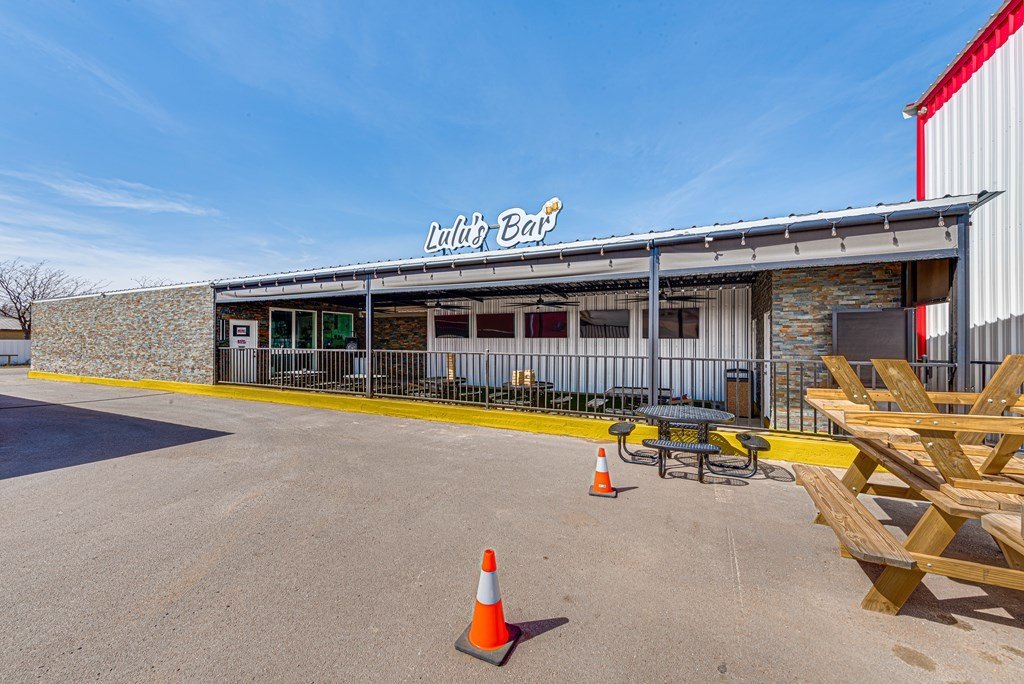
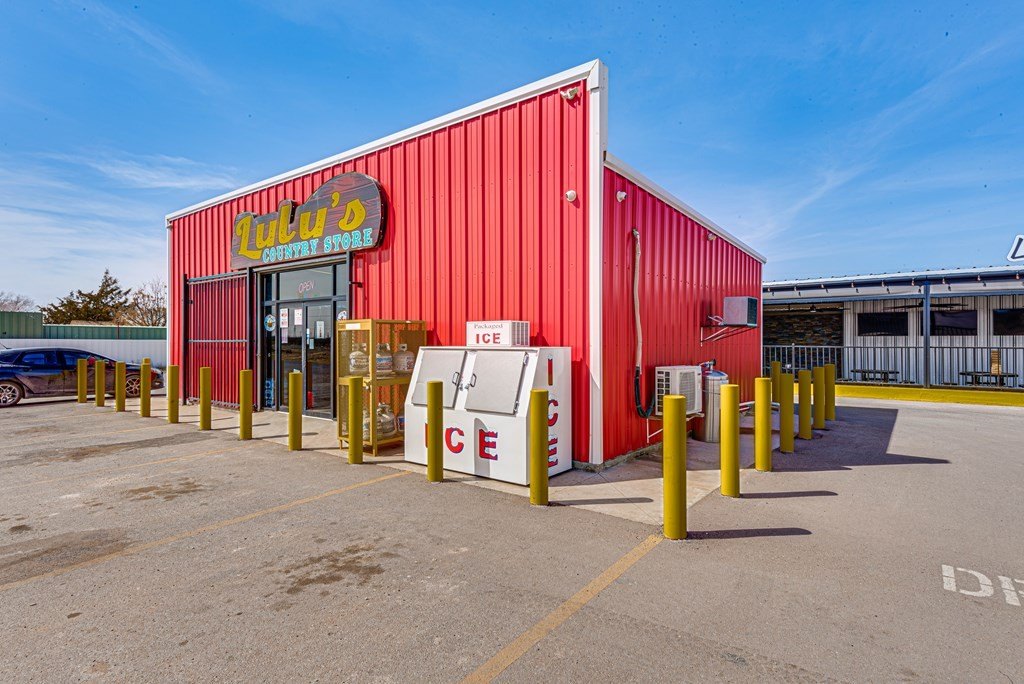
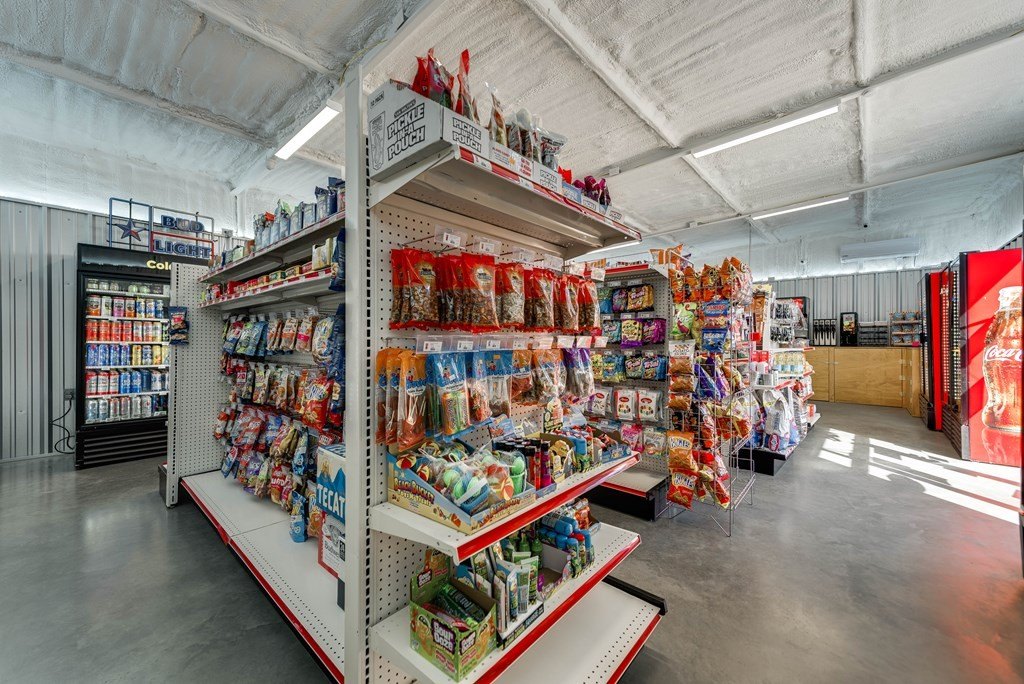
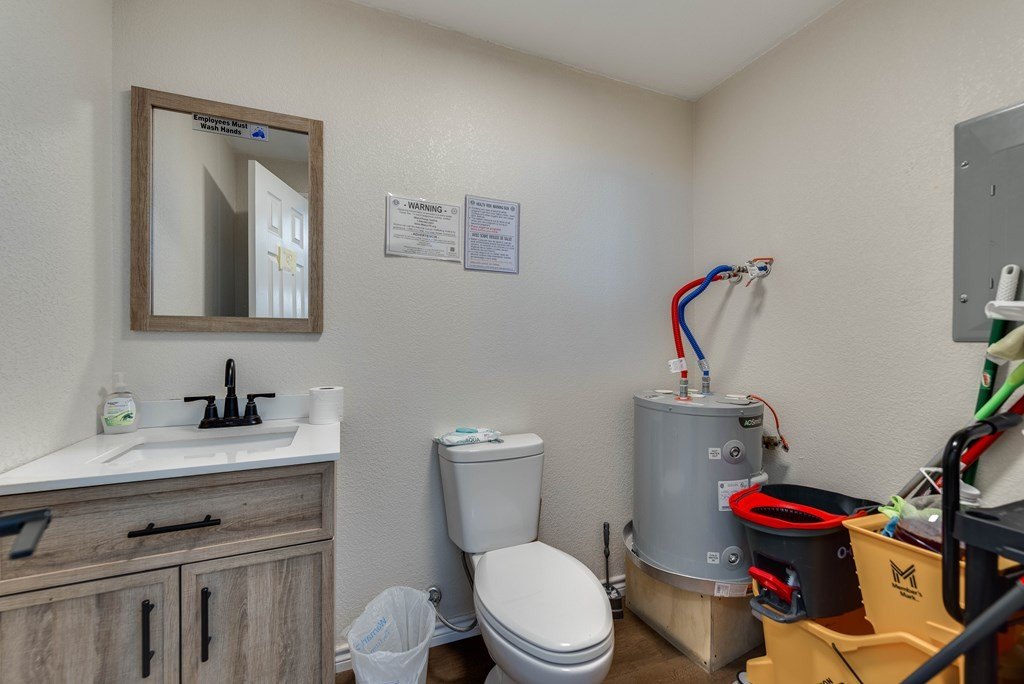
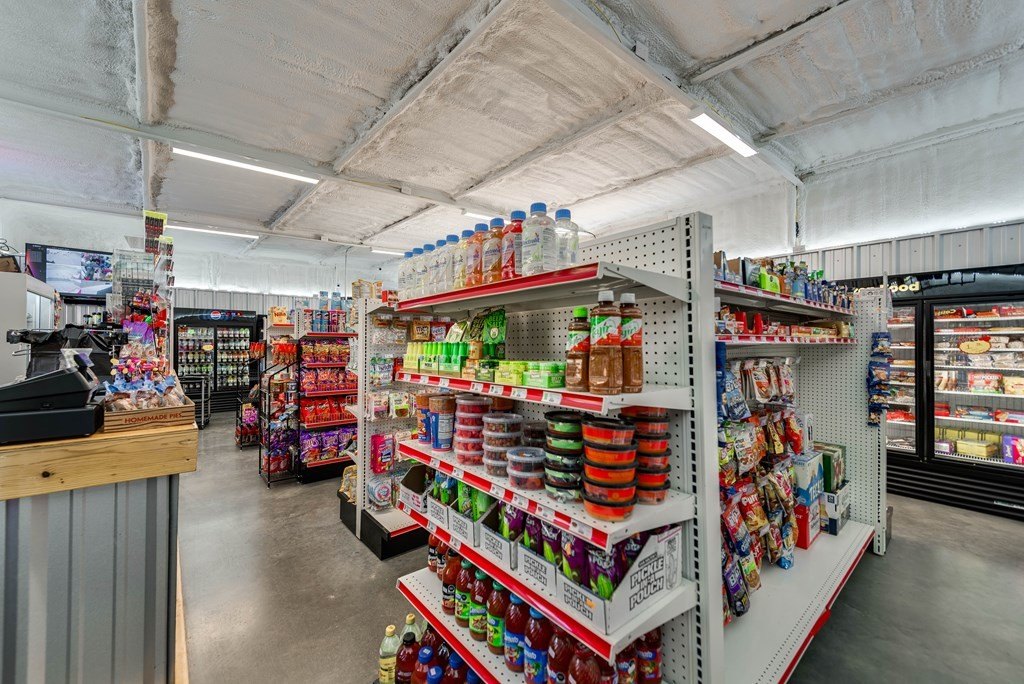
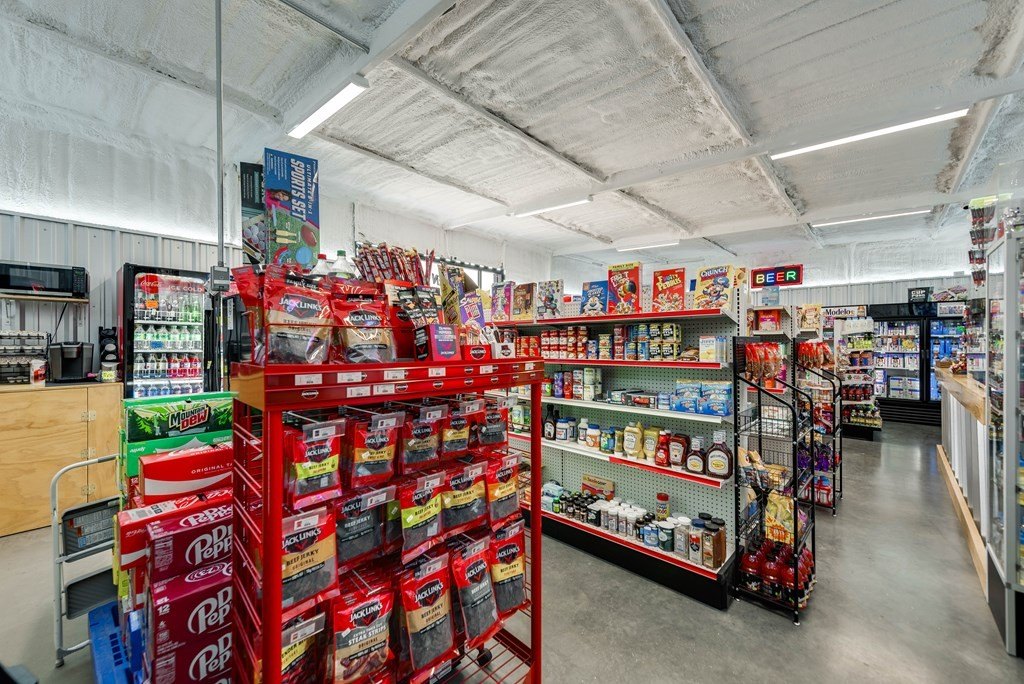
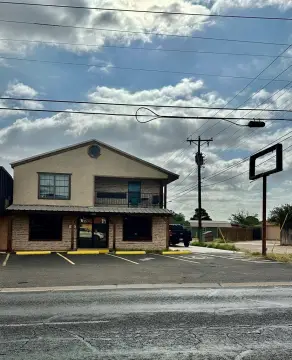
This offering combines a bar and small convenience store with a 3-bedroom, 1-bath barndominium. The residence includes laundry and a full kitchen, along with a garage or living room configuration. The bar and patio are described as turn-key and include TVs, turf, baths, and a screened-in patio, with pool tables also provided. Heating and cooling and lighting are included as part of the operating improvements.
Located at 5011 E Hammett Dr in Odessa, Texas (Ector County), the property is presented as a newer build from 2024 and is listed at 5,400 square feet with a 0.34-acre lot. Public remarks also indicate all necessary permits are in place and that the store is equipped with items necessary for community use.
For an owner-operator or a buyer looking for one-site operation, the layout supports both hospitality and retail activity alongside on-site living. With the bar and patio delivered as turn-key and the convenience store positioned to serve daily needs, this property may fit well for operators who want immediate functionality rather than start-up buildout.
Located at 5011 E Hammett Dr in Odessa, Texas (Ector County), the property is presented as a newer build from 2024 and is listed at 5,400 square feet with a 0.34-acre lot. Public remarks also indicate all necessary permits are in place and that the store is equipped with items necessary for community use.
For an owner-operator or a buyer looking for one-site operation, the layout supports both hospitality and retail activity alongside on-site living. With the bar and patio delivered as turn-key and the convenience store positioned to serve daily needs, this property may fit well for operators who want immediate functionality rather than start-up buildout.
Key Highlights
- Turnkey bar and convenience store with residence ready for you.
- Almost new construction (2023/2024).
- High traffic location.
Financial Insights
Estimated NOI and Cap Rate
NOI / Yr
$72,317
Cap Rate
8.04%
Suggested Prices Based on Cap Rates
Cap Rate 5%
$1,446,340
$1.4M
Cap Rate 7%
$1,033,100
$1.0M
Cap Rate 9%
$803,522
$803.5K
Market Conditions
NOI Build-Up for 5,400 SF
Gross rent
$103.7K $19.20/SF
− Vacancy
−$7.3K −$1.34/SF
EGI
$96.4K $17.86/SF
− OpEx
−$24.1K −$4.46/SF
NOI
$72.3K $13.39/SF
Area
Odessa, TX
Vacancy
7.00%
Lease Rate
$19.20 /SF/Yr
Expense Ratio
25.00%
Simulate Cap Rate and NOI
Suggested Prices Based on Cap Rates
Cap Rate 5%
$1,446,340
Cap Rate 7%
$1,033,100
Cap Rate 9%
$803,522
Alternative Uses
Best Use
Specialty Retail
$1.03M
$904.0K – $1.21M
NOI $72,317 @ 7.0% cap · market cap 8.04%
Second Best
Mixed Use
$974.0K
$852.3K – $1.14M
NOI $68,182 @ 7.0% cap · market cap 7.58%
Theoretical Best
Flex RnD
$7.85M
$6.87M – $9.16M
NOI $549,527 @ 7.0% cap · market cap 61.07%
Zoning and permitted uses should be independently verified with authorities.
How Realmo checks its estimates
Property Analytics
Unlock full access to Insights
Subscribe to Realmo Intelligence
Open Analytics
Current Use
Lease Details
Turnkey business
Opportunity
Location Intelligence
Trade Area within ½ mile
7
Businesses Nearby
Well-served
Demand for This Use
Explore this area
Business Placement
Demographics for 79766, TX
9,688
Population
3,516
Households
2.8
Avg Household Size
33
Median Age
10%
College-Educated
58%
High-School Grad
305.0 sq mi
ZIP Area
32
Density / Sq Mi
$70,965
Median Household Income
$41,913
Median Earnings
$1,100
Median Rent
$151,200
Median Home Value
Check the figures for this property
Cap Rate, Value Estimation, Potential NOI and more
View Realmo Analytics
Market
Vacancy Rate% for Retail in South region

Questions? Ask Rey
Realmo’s AI knows this listing — price, zoning, demand, history. Ask anything.





Frequently Asked Questions
What type of property is this?
Grocery and convenience store - Newer bar, screened patio, and convenience store plus a 3-bedroom barndominium—built for turnkey everyday operations.
Where is this grocery and convenience store located?
The property is located at 5011 E Hammett Dr Odessa, TX.
What is the asking price?
The asking price for this property is $899,900.
What are key features of this property?
This property features: Turnkey bar and convenience store with residence ready for you.; Almost new construction (2023/2024).; High traffic location.


