Farm with Licensed
For Sale
$950,000
501 Carter Ln, Ashland, OR 97520
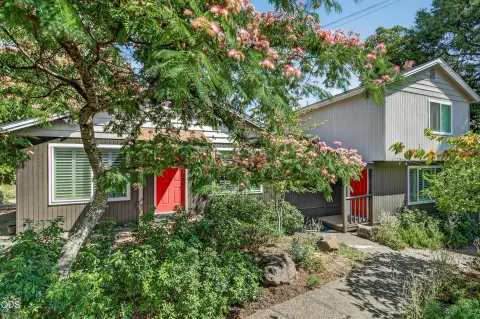
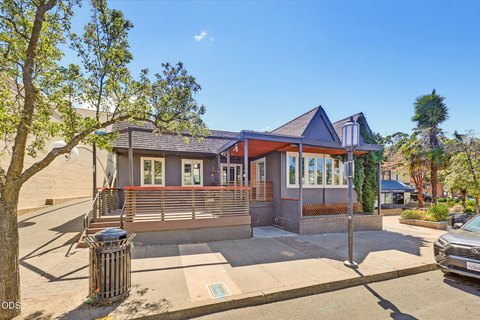
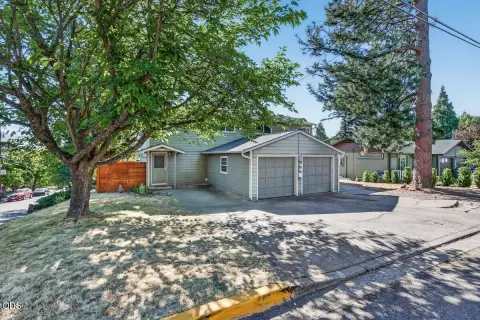
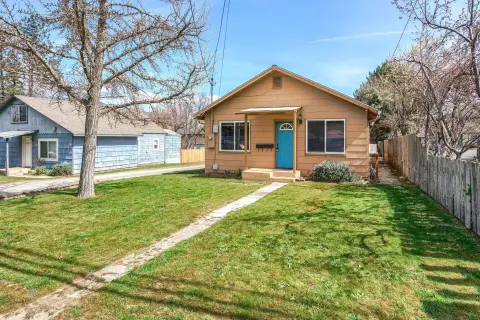
Flat agricultural property with greenhouses, irrigation ponds, and multiple residential structures.
Property Size3,180 SF
Price / SF$298.74
Days on Market77
Property Features for 501 Carter Ln
General Information
Standard status
Active
Size
3,180 SF
Property subtype
Land
Building Details
Year Built
2002
Listing Agency:
Holder Realty
Listed By:
Strategic Realty, LLC
(541) 595-8444
Source:
Movetobend
Added: Jul 31
Changed: Oct 15
Last Checked: Oct 14 at 11:33PM
Displayed information is deemed reliable but is not guaranteed and should be independently verified. All listing content including descriptions, pricing, images are the copyrighted material of Holder Realty

Ask AI about this property
Review the available facts, identify missing information and prepare questions for the agent.
Investment Insights
Based on property information with market context.
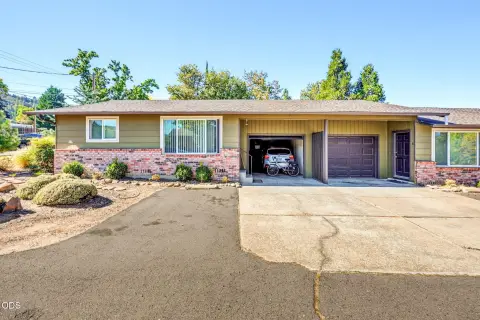
This farm property at 501 Carter Ln includes a 2,680-square-foot house, an 800-square-foot barn home, a cottage, a cabin, and a tiny home. The grounds include OMMP/ODA-licensed gardens, greenhouses, irrigation ponds, and upgraded electrical systems. Farming equipment is included, supporting continued agricultural use.
Water resources include an endless well and a 1-million-gallon TID water allocation. The property also has mountain views and a 9-year, 5-star Superhost history associated with its short-term rental activity. Built in 2002, the flat, usable estate combines agricultural improvements with several residential structures.
Water resources include an endless well and a 1-million-gallon TID water allocation. The property also has mountain views and a 9-year, 5-star Superhost history associated with its short-term rental activity. Built in 2002, the flat, usable estate combines agricultural improvements with several residential structures.
Key Highlights
- OMMP/ODA‑licensed gardens and greenhouses
- 2,680‑square‑foot house plus an 800‑square‑foot barn home, cottage, cabin, and tiny home
- 1‑million‑gallon TID water allocation with an endless well and irrigation ponds
Financial Insights
Estimated NOI and Cap Rate
NOI / Yr
$29,908
Cap Rate
3.15%
Suggested Prices Based on Cap Rates
Cap Rate 5%
$598,160
$598.2K
Cap Rate 7%
$427,257
$427.3K
Cap Rate 9%
$332,311
$332.3K
Market Conditions
NOI Build-Up for 3,180 SF
Gross rent
$57.2K $18.00/SF
− Vacancy
−$2.9K −$0.90/SF
EGI
$54.4K $17.10/SF
− OpEx
−$24.5K −$7.69/SF
NOI
$29.9K $9.41/SF
Area
Jackson County, OR
Vacancy
5.00%
Lease Rate
$18.00 /SF/Yr
Expense Ratio
45.00%
Simulate Cap Rate and NOI
Suggested Prices Based on Cap Rates
Cap Rate 5%
$598,160
Cap Rate 7%
$427,257
Cap Rate 9%
$332,311
Alternative Uses
Best Use
Apartment 5plus
$427.3K
$373.9K – $498.5K
NOI $29,908 @ 7.0% cap · market cap 3.15%
Second Best
—
—
no second resolved use
Theoretical Best
Office A
$767.6K
$671.6K – $895.5K
NOI $53,729 @ 7.0% cap · market cap 5.66%
Zoning and permitted uses should be independently verified with authorities.
How Realmo checks its estimates
Property Analytics
Unlock full access to Insights
Subscribe to Realmo Intelligence
Open Analytics
Current Use
Location Intelligence
Trade Area within ½ mile
16
Businesses Nearby
Explore this area
Business Placement
Demographics for 97520, OR
25,970
Population
13,964
Households
1.9
Avg Household Size
47
Median Age
61%
College-Educated
96%
High-School Grad
328.8 sq mi
ZIP Area
79
Density / Sq Mi
$71,485
Median Household Income
$31,869
Median Earnings
$1,360
Median Rent
$568,700
Median Home Value
Check the figures for this property
Cap Rate, Value Estimation, Potential NOI and more
View Realmo Analytics
Market
Vacancy Rate% for Multifamily in West region





Frequently Asked Questions
What type of property is this?
Farm - Flat agricultural property with greenhouses, irrigation ponds, and multiple residential structures.
Where is this farm located?
The property is located at 501 Carter Ln Ashland, OR.
What is the asking price?
The asking price for this property is $950,000.
What are key features of this property?
This property features: OMMP/ODA‑licensed gardens and greenhouses; 2,680‑square‑foot house plus an 800‑square‑foot barn home, cottage, cabin, and tiny home; 1‑million‑gallon TID water allocation with an endless well and irrigation ponds


