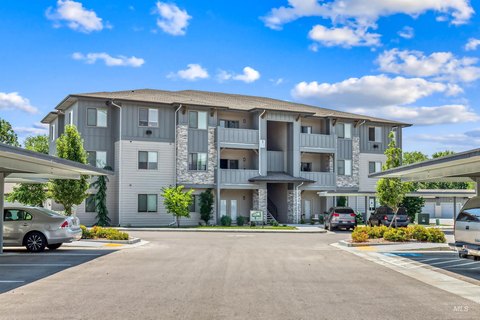
Six-Unit Apartment
For Sale
$2,399,900
5003 E Woodward Ln, Nampa, ID
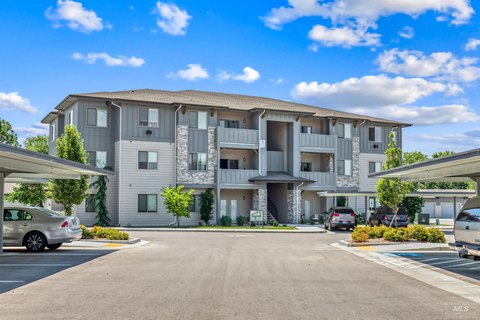
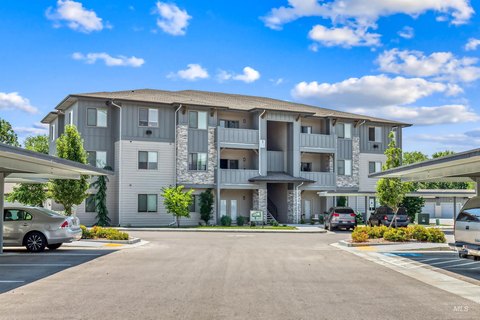
Fully leased townhome portfolio with attached garages, private fenced yards, and upgraded interior finishes.
Property Size8,070 SF
Price / SF$297.39
Days on Market76
Property Features for 5003 E Woodward Ln
General Information
Standard status
Active
Size
8,070 SF
Property subtype
Residential Income
Occupancy
100%
Units
Unit Mix
4 x 2BR/2.5BA, 2 x 3BR/2.5BA
Multifamily Units
6
Additional Details
Highway Access
Yes
Taxes and HOA fees
Annual Taxes
$13,485
Building Details
Buildings
6
Listing Agency:
Silvercreek Realty Group
(208) 377-0422
Listed By:
Steven Lee · License #SP53867
(208) 412-3484
Source:
Exprealty
Added: Aug 3
Changed: Oct 17
Last Checked: Oct 16 at 2:00PM
Displayed information is deemed reliable but is not guaranteed and should be independently verified. All listing content including descriptions, pricing, images are the copyrighted material of Silvercreek Realty Group

Ask AI about this property
Review the available facts, identify missing information and prepare questions for the agent.
Investment Insights
Based on property information with market context.
This new-construction apartment portfolio comprises six separately deeded townhomes, including four two-bedroom, two-and-a-half-bath residences and two three-bedroom, two-and-a-half-bath residences. The units feature 10-foot ceilings, open living areas, granite countertops, upgraded lighting, shiplap and board-and-batten detailing, stainless steel LG appliances, and second-floor laundry with included washers and dryers. Walk-in closets, en suite bathrooms, private fenced yards, and low-maintenance landscaping complement the interiors. Attached garages provide either one-car or two-car capacity.
The property is fully leased and professionally managed, with access to I-84, Saint Alphonsus Medical Campus, and Meridian approximately 10 minutes away. The central Nampa location supports short-, mid-, or long-term rental strategies, with no rental restrictions stated in the property information.
The property is fully leased and professionally managed, with access to I-84, Saint Alphonsus Medical Campus, and Meridian approximately 10 minutes away. The central Nampa location supports short-, mid-, or long-term rental strategies, with no rental restrictions stated in the property information.
Key Highlights
- Six separately deeded townhomes in one apartment portfolio
- Unit mix includes four 2 bed/2.5 bath residences and two 3 bed/2.5 bath residences
- New construction with 10' ceilings and open‑concept living areas
Financial Insights
Estimated NOI and Cap Rate
NOI / Yr
$79,525
Cap Rate
3.31%
Suggested Prices Based on Cap Rates
Cap Rate 5%
$1,590,500
$1.6M
Cap Rate 7%
$1,136,071
$1.1M
Cap Rate 9%
$883,611
$883.6K
Market Conditions
NOI Build-Up for 8,070 SF
Gross rent
$153.0K $18.96/SF
− Vacancy
−$8.4K −$1.04/SF
EGI
$144.6K $17.92/SF
− OpEx
−$65.1K −$8.06/SF
NOI
$79.5K $9.85/SF
Area
Nampa, ID
Vacancy
5.50%
Lease Rate
$18.96 /SF/Yr
Expense Ratio
45.00%
Simulate Cap Rate and NOI
Suggested Prices Based on Cap Rates
Cap Rate 5%
$1,590,500
Cap Rate 7%
$1,136,071
Cap Rate 9%
$883,611
Alternative Uses
Best Use
Apartment 5plus
$1.14M
$994.1K – $1.33M
NOI $79,525 @ 7.0% cap · market cap 3.31%
Second Best
—
—
no second resolved use
Theoretical Best
Office A
$2.04M
$1.79M – $2.38M
NOI $142,897 @ 7.0% cap · market cap 5.95%
Zoning and permitted uses should be independently verified with authorities.
How Realmo checks its estimates
Property Analytics
Unlock full access to Insights
Subscribe to Realmo Intelligence
Open Analytics
Current Use
Lease Details
6
Residential units
100%
Occupancy
Yes
Highway access
Location Intelligence
Trade Area within ½ mile
588
Businesses Nearby
Explore this area
Business Placement
Check the figures for this property
Cap Rate, Value Estimation, Potential NOI and more
View Realmo Analytics
Market
Vacancy Rate% for Multifamily in West region





Frequently Asked Questions
What type of property is this?
Apartment building - Fully leased townhome portfolio with attached garages, private fenced yards, and upgraded interior finishes.
Where is this apartment building located?
The property is located at 5003 E Woodward Ln Nampa, ID.
What is the asking price?
The asking price for this property is $2,399,900.
What are key features of this property?
This property features: Six separately deeded townhomes in one apartment portfolio; Unit mix includes four 2 bed/2.5 bath residences and two 3 bed/2.5 bath residences; New construction with 10' ceilings and open‑concept living areas


