NNN Ground-Leased Restaurant
For Sale
$2,442,307
5002 Hinkleville Rd, Paducah, KY 42001
Currently being renovated for a Chuy’s Restaurant under an NNN ground lease with six years remaining.
Property Size7,885 SF
Price / SF$309.74
Days on Market92
Property Features for 5002 Hinkleville Rd
General Information
Standard status
Active
Size
7,885 SF
Property subtype
Restaurant
Site & Location
Traffic Count
22,707 vehicles/day
Highway Access
Yes
Road Access
Yes
Additional Details
Cap Rate
5.71%
Amenities
NNN Ground Lease with Six Years Remaining and 10 Percent Rent Escalations Every Five Years
The tenant Darden Restaurants (NYSE:DRI) is Investing Significant Resources to renovate the Property from a Cheddar's Scratch Kitchen into a Chuy's showing Long-term Commitment to this Location
Direct Access to US-60 with Over 22,707 VPD and James Sander Blvd with Over 15,449 VPD
7,885 SF Building on 2.64 Acre-Lot
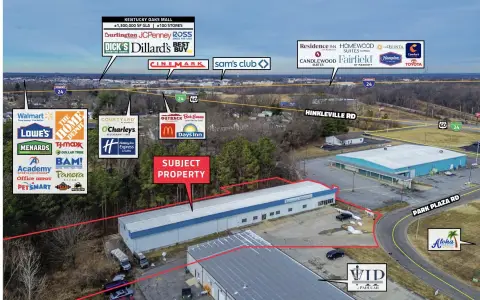
Positioned Across from Kentucky Oaks Mall in Paducah's Primary Retail Corridor that Receives Over 6.3 Million Visits Per Year
Located within a Shopping Center that Includes Walmart, Home Depot, T.J. Maxx, PetSmart, Office Depot, Dollar Tree, and More
The new Bass Pro Shops will be a 70,000-square-foot location and will be adjacent to the Kentucky Oaks Mall, a premier commercial hub situated along I-24, just north of the intersection with Highway 60. It is expected to open late 2026 or early 2027
Building Details
Building Size
7,885 SF
Tenancy
Single
Listing Agency:
Marcus & Millichap | Dallas
Listed By:
John Paine · License #License(s): TX: 764689
(972) 755-5279
Source:
Marcusmillichap
Added: Jul 22
Changed: Oct 18
Last Checked: Oct 20 at 5:06PM
Displayed information is deemed reliable but is not guaranteed and should be independently verified. All listing content including descriptions, pricing, images are the copyrighted material of Marcus & Millichap | Dallas

Ask AI about this property
Review the available facts, identify missing information and prepare questions for the agent.
Investment Insights
Based on property information with market context.
The property is a conventional restaurant site that is being renovated from its former Cheddar’s Scratch Kitchen use into a Chuy’s Restaurant. The asset is secured by a NNN ground lease with six years remaining, with zero landlord responsibilities stated. Lease terms include 10 percent rental escalations every five years and three additional five-year renewal options.
The property is positioned for visibility and access from Hinkleville Road, which the listing states carries nearly 22,707 vehicles per day, and it is located just off Interstate 24, with average daily traffic noted at nearly 22,264 vehicles. The site sits directly across from Kentucky Oaks Mall and shares a shopping center with retailers including Academy Sports, Dollar Tree, PetSmart, and Crumbl Cookies, with nearby restaurant anchors such as Texas Roadhouse, Buffalo Wild Wings, Panera, IHOP, and Arby’s.
The property is positioned for visibility and access from Hinkleville Road, which the listing states carries nearly 22,707 vehicles per day, and it is located just off Interstate 24, with average daily traffic noted at nearly 22,264 vehicles. The site sits directly across from Kentucky Oaks Mall and shares a shopping center with retailers including Academy Sports, Dollar Tree, PetSmart, and Crumbl Cookies, with nearby restaurant anchors such as Texas Roadhouse, Buffalo Wild Wings, Panera, IHOP, and Arby’s.
Key Highlights
- Former Cheddar’s Scratch Kitchen building being renovated for a Chuy’s Restaurant.
- NNN ground lease with 6 years remaining and zero landlord responsibilities.
- Lease includes 10% rental escalations every five years, plus three additional five‑year renewal options.
Financial Insights
Estimated NOI and Cap Rate
NOI / Yr
$93,819
Cap Rate
3.84%
Suggested Prices Based on Cap Rates
Cap Rate 5%
$1,876,380
$1.9M
Cap Rate 7%
$1,340,271
$1.3M
Cap Rate 9%
$1,042,433
$1.0M
Market Conditions
NOI Build-Up for 7,885 SF
Gross rent
$129.6K $16.44/SF
− Vacancy
−$4.5K −$0.58/SF
EGI
$125.1K $15.86/SF
− OpEx
−$31.3K −$3.97/SF
NOI
$93.8K $11.90/SF
Area
McCracken County, KY
Vacancy
3.50%
Lease Rate
$16.44 /SF/Yr
Expense Ratio
25.00%
Simulate Cap Rate and NOI
Suggested Prices Based on Cap Rates
Cap Rate 5%
$1,876,380
Cap Rate 7%
$1,340,271
Cap Rate 9%
$1,042,433
Alternative Uses
Best Use
Specialty Retail
$1.34M
$1.17M – $1.56M
NOI $93,819 @ 7.0% cap · market cap 3.84%
Second Best
—
—
no second resolved use
Theoretical Best
Warehouse
$1.64M
$1.44M – $1.92M
NOI $115,003 @ 7.0% cap · market cap 4.71%
Zoning and permitted uses should be independently verified with authorities.
How Realmo checks its estimates
Property Analytics
Contact the owner directly
Get the owner's phone numbers and email
Open Analytics
Current Use
Lease Details
22,707 VPD
Traffic count
Single-tenant
Tenancy
Yes
Highway access
Yes
Paved road access
Location Intelligence
Trade Area within ½ mile
708
Businesses Nearby
946k
Monthly Visits Nearby
Well-served
Demand for This Use
Explore this area
Business Placement
Foot Traffic Nearby
Dining 30%
Apparel 23%
Shops & Services 22%
Superstores 14%
Walmart
Superstores
136,578 visits/mo
0.5 miles
Academy Sports + Outdoors
Apparel
56,801 visits/mo
0.2 miles
Hobby Lobby
Shops & Services
53,113 visits/mo
0.2 miles
DICK'S Sporting Goods
Apparel
48,620 visits/mo
0.4 miles
Five Below
Shops & Services
43,601 visits/mo
0.3 miles
Demographics for 42001, KY
31,579
Population
14,815
Households
2.1
Avg Household Size
41
Median Age
36%
College-Educated
94%
High-School Grad
74.2 sq mi
ZIP Area
426
Density / Sq Mi
$68,868
Median Household Income
$42,334
Median Earnings
$916
Median Rent
$210,100
Median Home Value
Check the figures for this property
Cap Rate, Value Estimation, Potential NOI and more
View Realmo Analytics
Market
Vacancy Rate% for Retail in South region





Frequently Asked Questions
What type of property is this?
Conventional restaurant - Currently being renovated for a Chuy’s Restaurant under an NNN ground lease with six years remaining.
Where is this conventional restaurant located?
The property is located at 5002 Hinkleville Rd Paducah, KY.
What is the asking price?
The asking price for this property is $2,442,307.
What are key features of this property?
This property features: Former Cheddar’s Scratch Kitchen building being renovated for a Chuy’s Restaurant.; NNN ground lease with 6 years remaining and zero landlord responsibilities.; Lease includes 10% rental escalations every five years, plus three additional five‑year renewal options.


