Lake-View
For Sale
$399,900
500 Steel Bridge Loop, Hickory, NC 28601
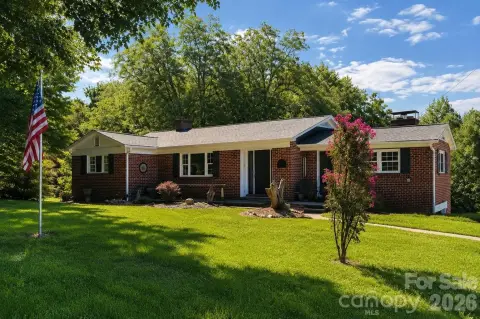
Two-level property with paired living spaces and convenient access to Lake Hickory Marina and Wittenburg boat access.
Property Size1,688 SF
Price / SF$236.91
Days on Market66
Property Features for 500 Steel Bridge Loop
General Information
Standard status
Active
Size
1,688 SF
Property subtype
Multi-Family
Additional Details
Multifamily Units
2
Building Details
Year Built
1981
Stories
2
Construction
Deltec
Listing Agency:
Lake Homes Realty LLC
Listed By:
Glenn Fisher · License #270991
(828) 514-6076
Source:
Highperformancerea
Added: Aug 12
Changed: Oct 6
Last Checked: Oct 7 at 3:34PM
Displayed information is deemed reliable but is not guaranteed and should be independently verified. All listing content including descriptions, pricing, images are the copyrighted material of Lake Homes Realty LLC

Ask AI about this property
Review the available facts, identify missing information and prepare questions for the agent.
Investment Insights
Based on property information with market context.
This 1,688-square-foot duplex is arranged across two levels, with each level offering two bedrooms, one full bathroom, and an open kitchen and living area. The Deltec home was built in 1981 and features abundant natural light along with year-round views of Lake Hickory.
Located at 500 Steel Bridge Loop in Hickory, the property is within walking distance of Lake Hickory Marina and Wittenburg boat access. Its layout provides two separately configured residential levels while maintaining a consistent two-bedroom, one-bath arrangement throughout.
Located at 500 Steel Bridge Loop in Hickory, the property is within walking distance of Lake Hickory Marina and Wittenburg boat access. Its layout provides two separately configured residential levels while maintaining a consistent two-bedroom, one-bath arrangement throughout.
Key Highlights
- 1,688‑square‑foot duplex with two residential levels
- Each level includes 2 bedrooms, 1 full bathroom, and an open kitchen and living area
- Year‑round views of Lake Hickory
Financial Insights
Estimated NOI and Cap Rate
NOI / Yr
$15,246
Cap Rate
3.81%
Suggested Prices Based on Cap Rates
Cap Rate 5%
$304,920
$304.9K
Cap Rate 7%
$217,800
$217.8K
Cap Rate 9%
$169,400
$169.4K
Market Conditions
NOI Build-Up for 1,688 SF
Gross rent
$23.3K $13.80/SF
− Vacancy
−$1.5K −$0.90/SF
EGI
$21.8K $12.90/SF
− OpEx
−$6.5K −$3.87/SF
NOI
$15.2K $9.03/SF
Area
Catawba County, NC
Vacancy
6.50%
Lease Rate
$13.80 /SF/Yr
Expense Ratio
30.00%
Simulate Cap Rate and NOI
Suggested Prices Based on Cap Rates
Cap Rate 5%
$304,920
Cap Rate 7%
$217,800
Cap Rate 9%
$169,400
Alternative Uses
Best Use
Multifamily LT 5
$217.8K
$190.6K – $254.1K
NOI $15,246 @ 7.0% cap · market cap 3.81%
Second Best
Apartment 5plus
$202.4K
$177.1K – $236.1K
NOI $14,168 @ 7.0% cap · market cap 3.54%
Theoretical Best
Office A
$493.1K
$431.5K – $575.3K
NOI $34,516 @ 7.0% cap · market cap 8.63%
Zoning and permitted uses should be independently verified with authorities.
How Realmo checks its estimates
Property Analytics
Current Use
Lease Details
2
Residential units
Location Intelligence
Trade Area within ½ mile
60
Businesses Nearby
Explore this area
Business Placement
Demographics for 28601, NC
53,973
Population
23,400
Households
2.3
Avg Household Size
42
Median Age
35%
College-Educated
90%
High-School Grad
47.1 sq mi
ZIP Area
1,146
Density / Sq Mi
$67,839
Median Household Income
$41,697
Median Earnings
$951
Median Rent
$236,100
Median Home Value
Market
Vacancy Rate% for Multifamily in South region




Frequently Asked Questions
What type of property is this?
Duplex - Two-level property with paired living spaces and convenient access to Lake Hickory Marina and Wittenburg boat access.
Where is this duplex located?
The property is located at 500 Steel Bridge Loop Hickory, NC.
What is the asking price?
The asking price for this property is $399,900.
What are key features of this property?
This property features: 1,688‑square‑foot duplex with two residential levels; Each level includes 2 bedrooms, 1 full bathroom, and an open kitchen and living area; Year‑round views of Lake Hickory