Two-Building Flex
For Sale
$400,000
500 Rampart Range Road, Woodland Park, CO 80863
Commercial, Woodland Park, CO
Property Size2,368 SF
Lot Size0.69 Acres
Price / SF$168.92
Days on Market90
Property Features for 500 Rampart Range Road
General Information
Property type
Commercial Sale
Property subtype
Other
Standard status
Active
Lot size
0.69 Acres
Taxes and HOA fees
Tax Year
1026
Tax Annual Amount
10206
Amenities
high-speed fiber internet
kitchenette
Building Details
Year built
1985
Listing Agency:
Pikes Peak Homes and Land Ltd
Listed By:
Chris Clark CRS GRI · License #100056170
(719) 464-5839
Added: Jul 17
Changed: Oct 10
Last Checked: Oct 14 at 8:06AM
MLS# 9825190
Copyright © 2026 elevateMLS. All rights reserved. All information provided by the listing agent/broker is deemed reliable but is not guaranteed and should be independently verified.
Investment Insights
Based on property information with market context.
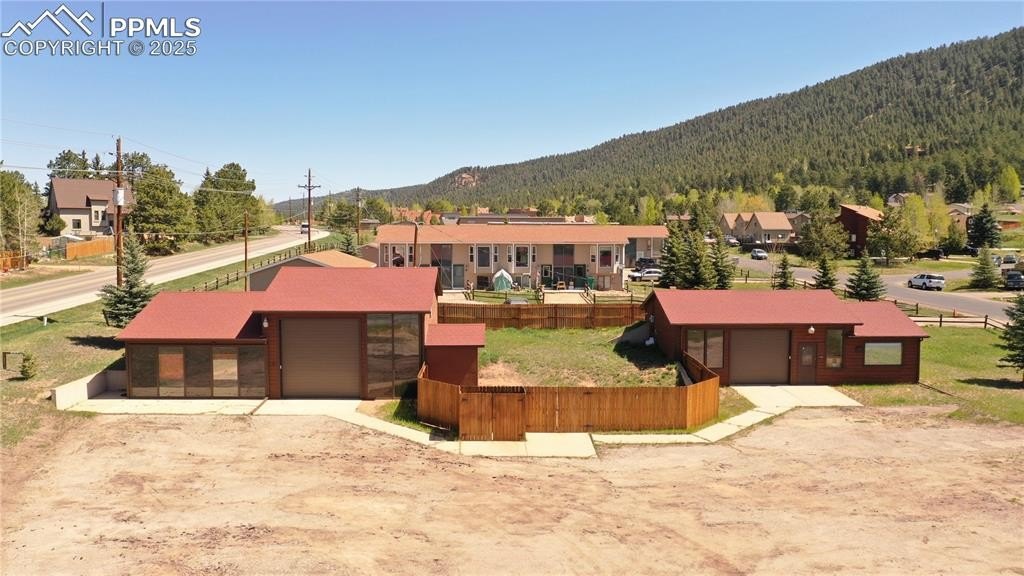
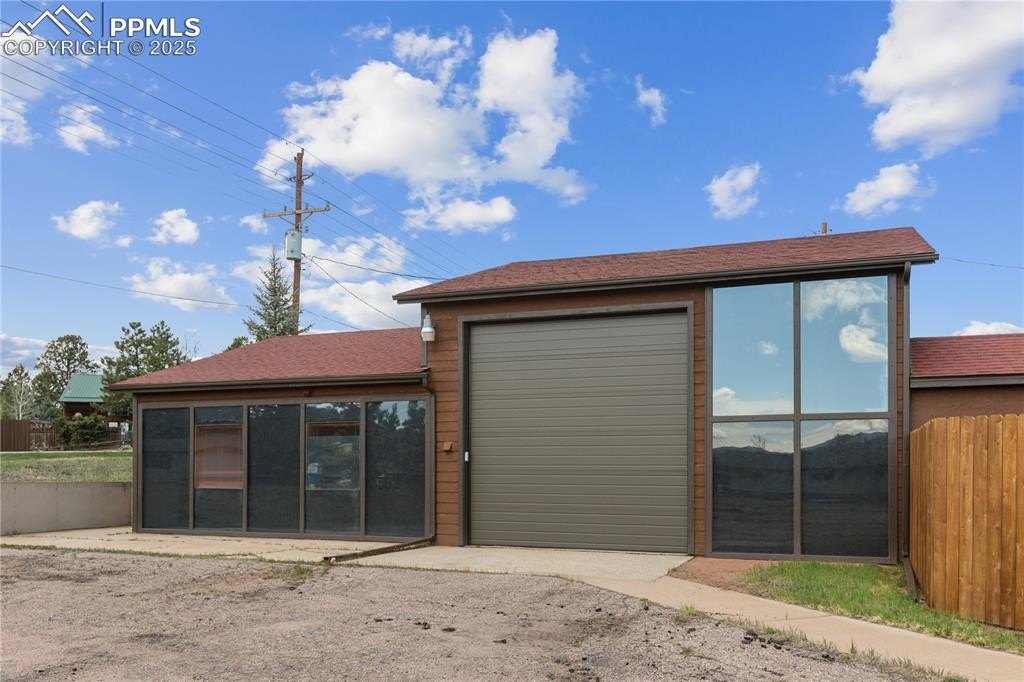
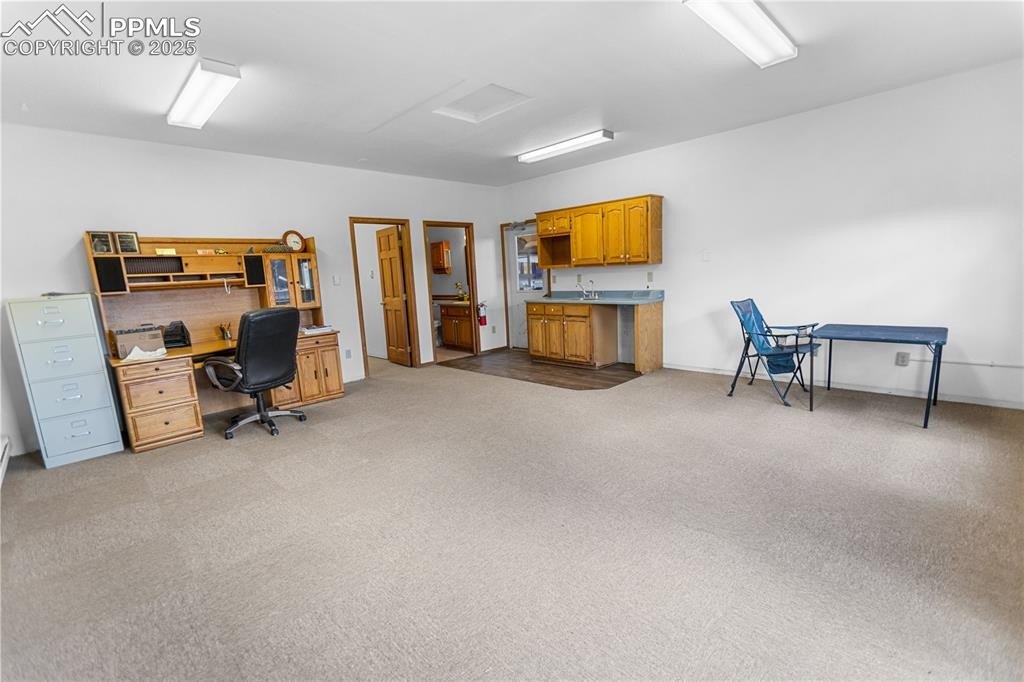
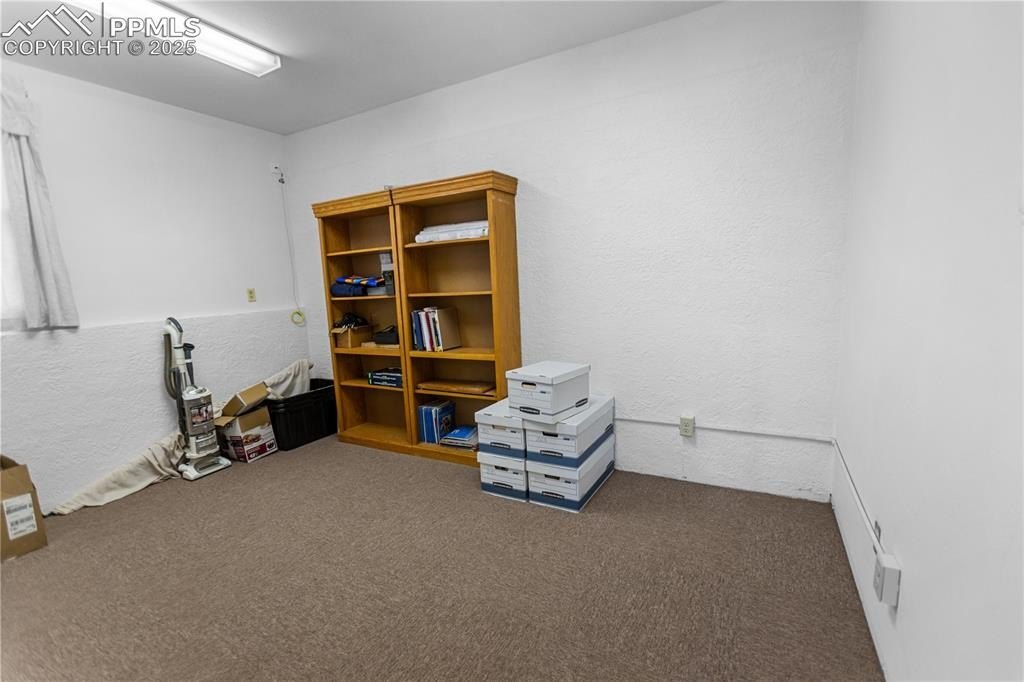
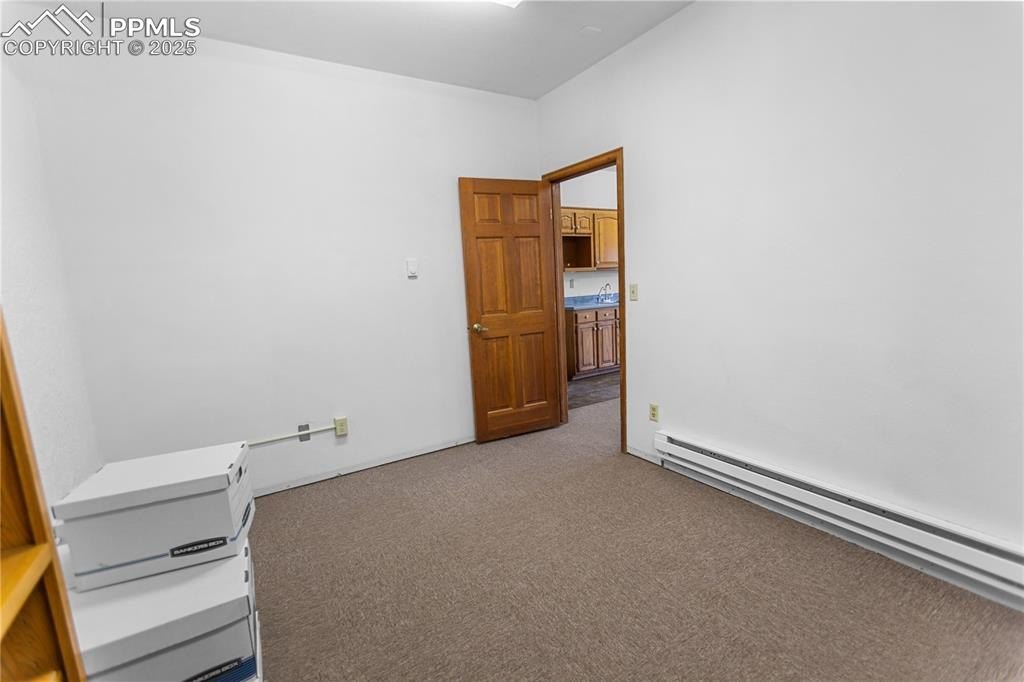
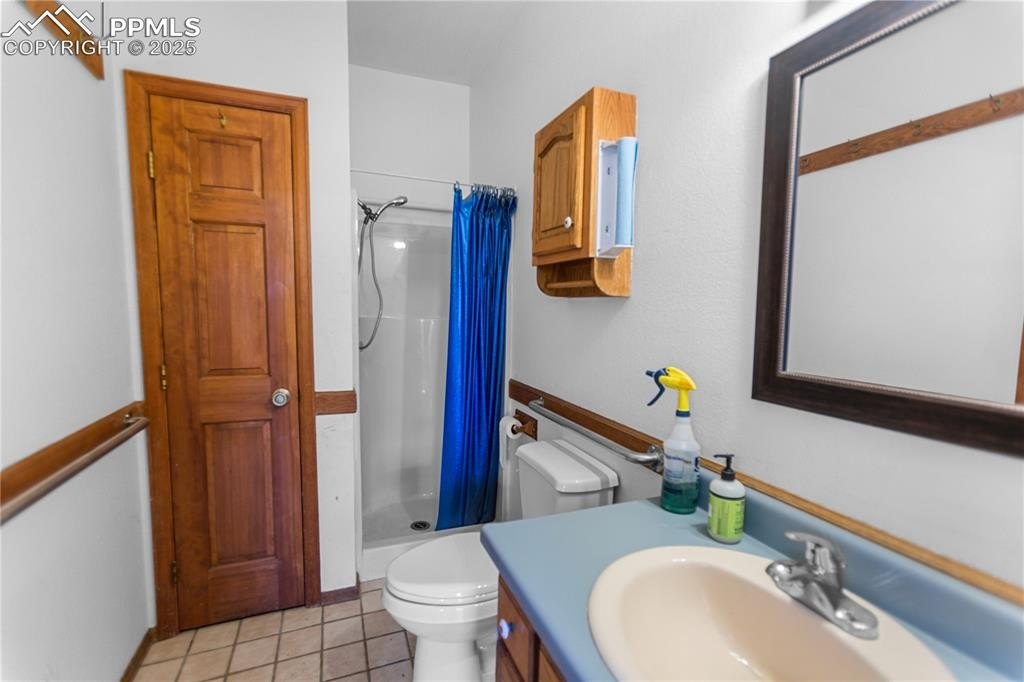
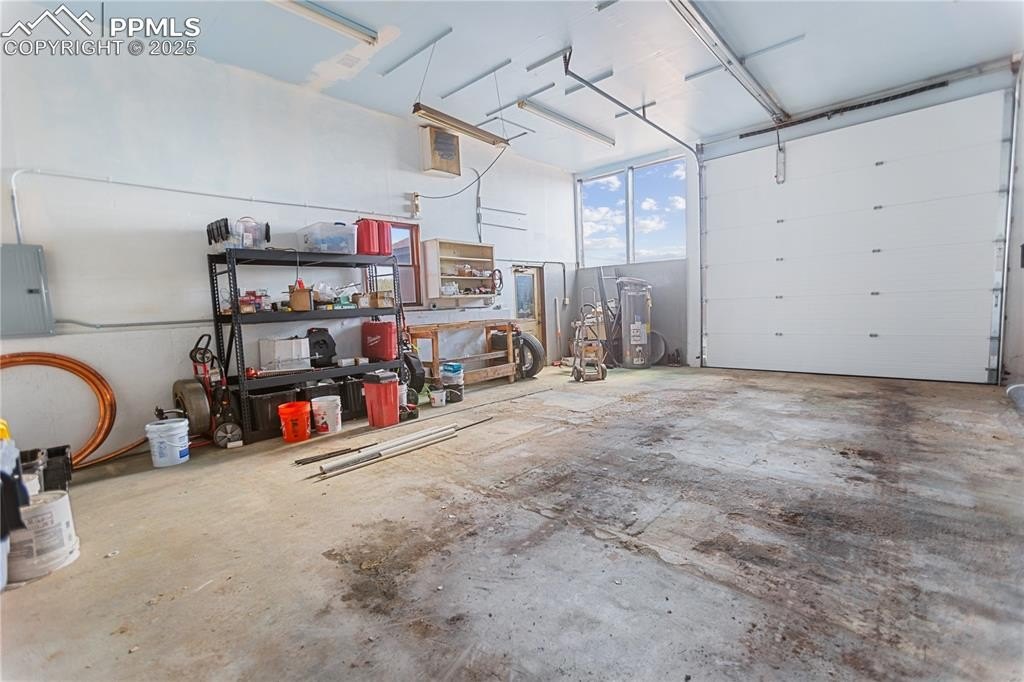
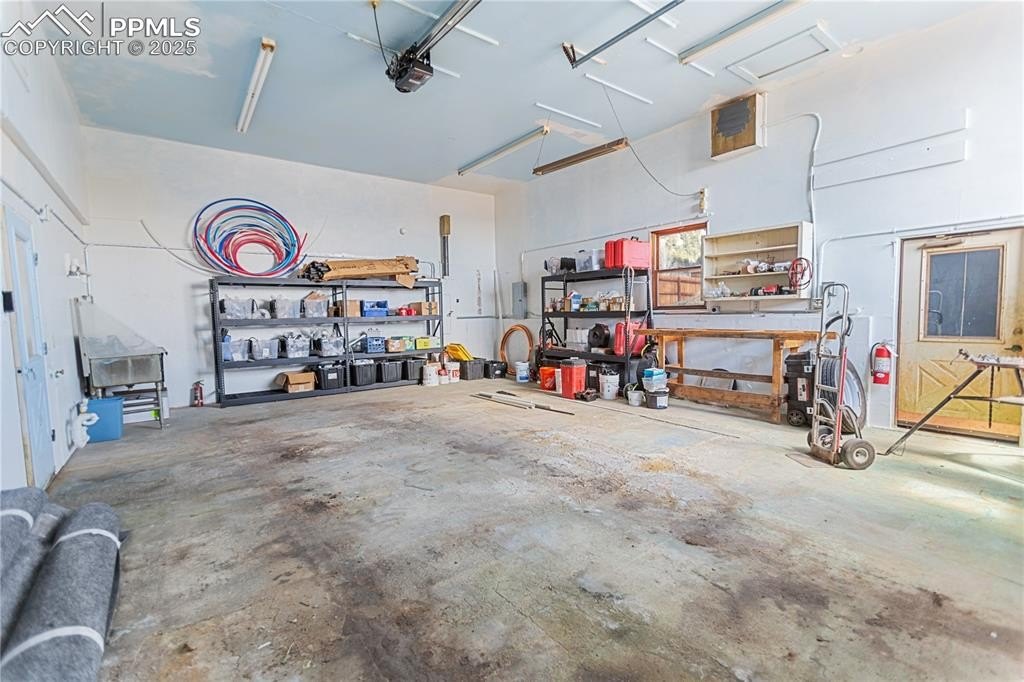
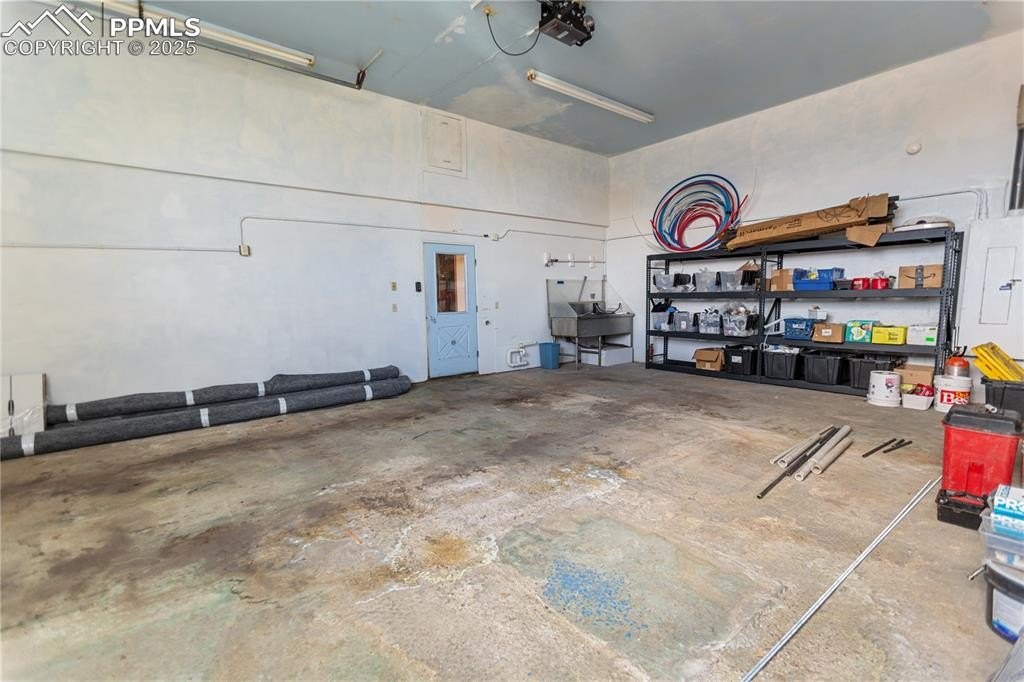
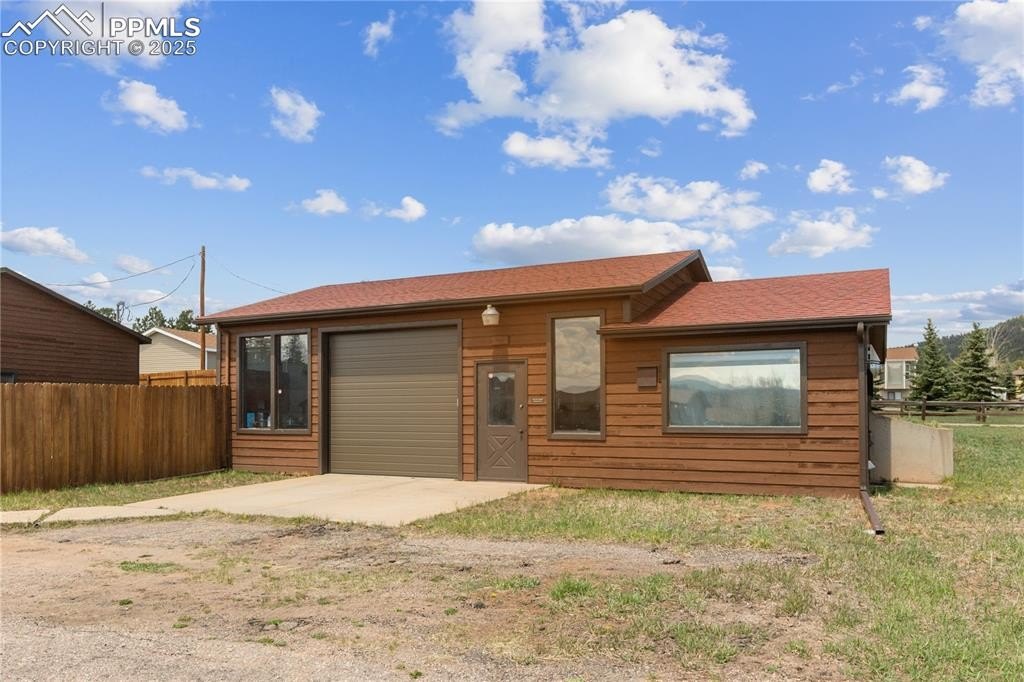
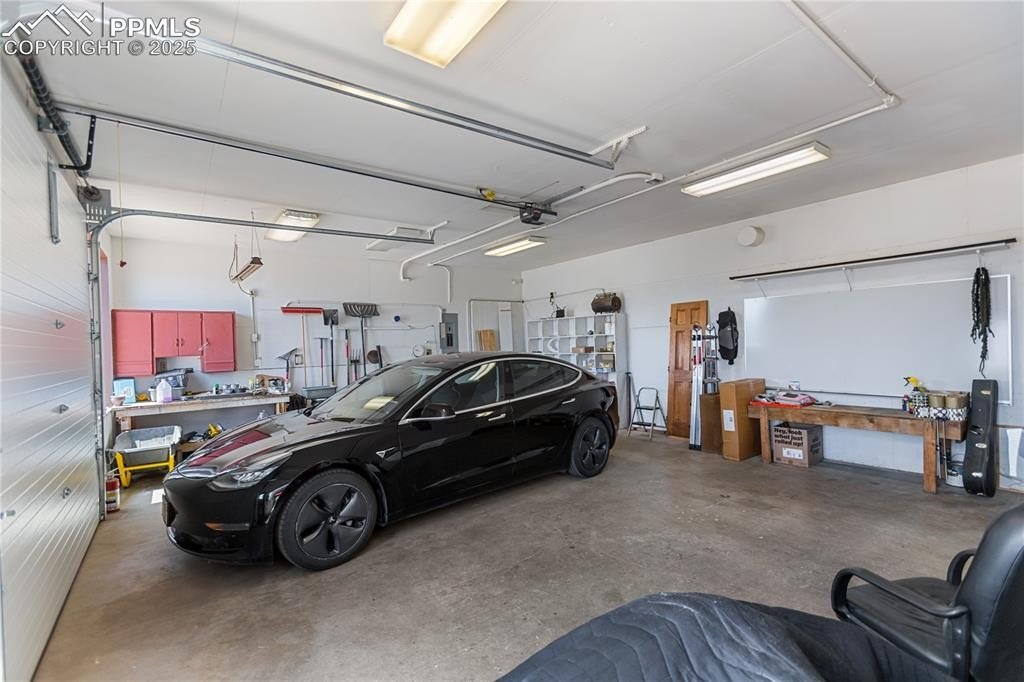
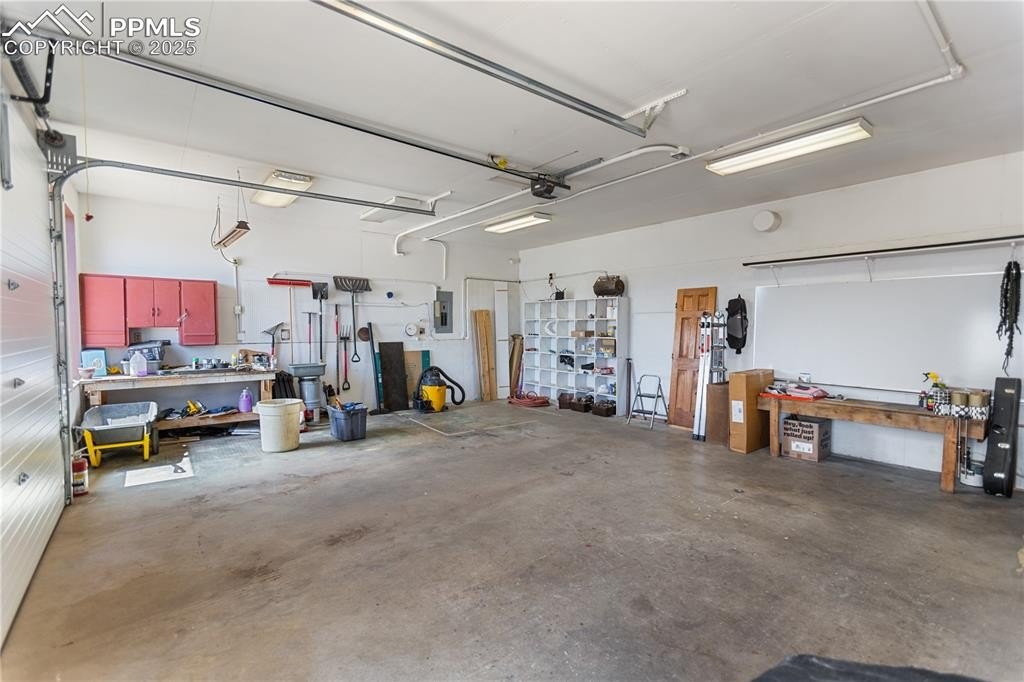
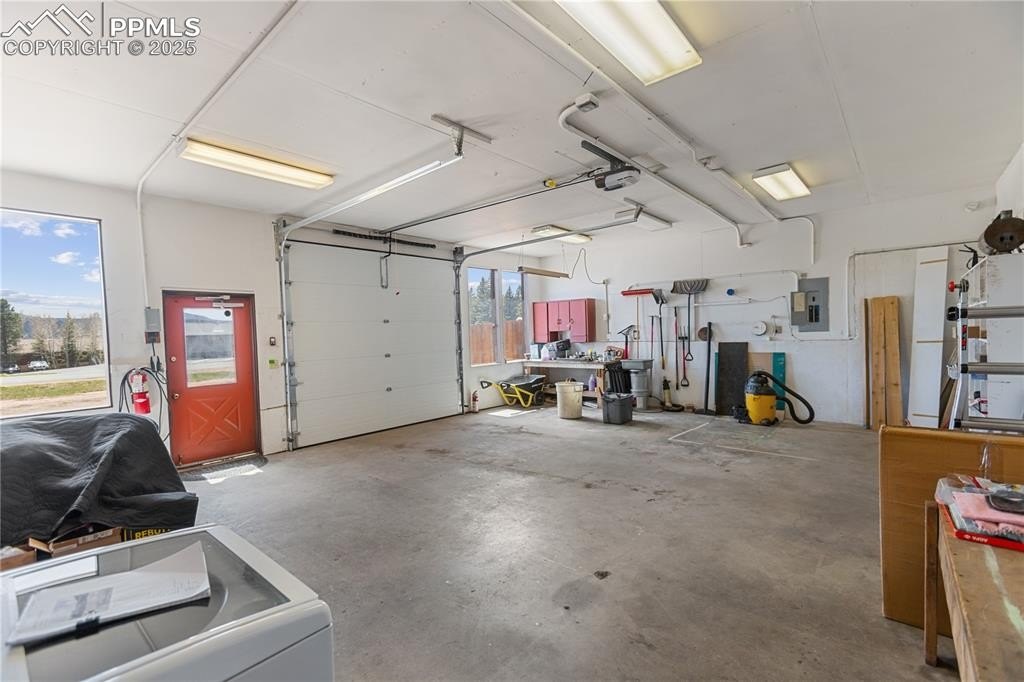
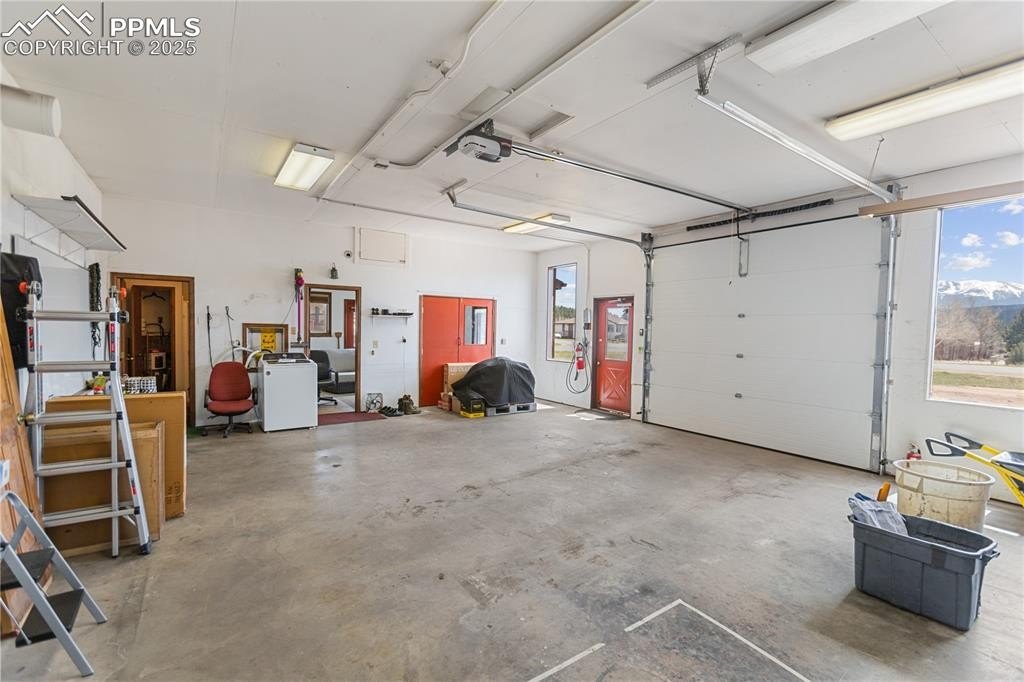
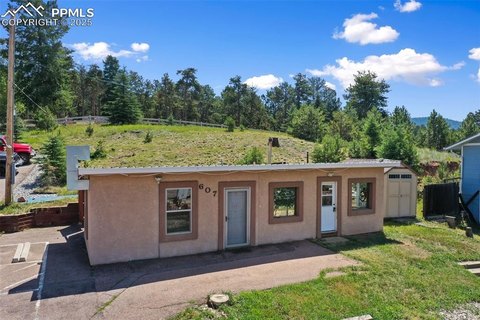
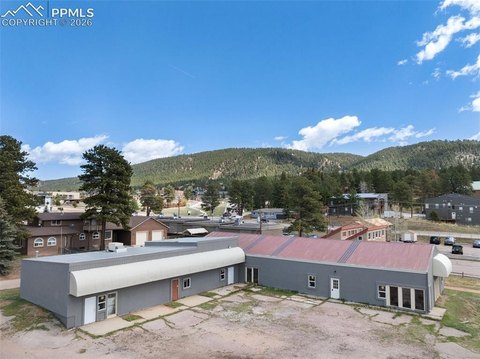
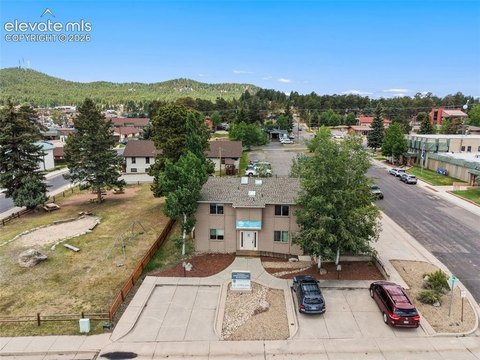
This flex property comprises two freestanding commercial buildings constructed in 1985, with a combined layout of approximately 2,368 square feet. Building 1 measures approximately 1,408 square feet and includes a 23-by-31-foot garage with a 13-foot ceiling, 12-by-12-foot overhead door, 400-amp electrical service, 30- and 50-amp outlets, and a wash sink. Its interior also provides a showroom, office, bathroom, and storage room. Building 2 measures approximately 960 square feet and offers a 23-by-28-foot garage, 10-foot ceilings, a 10-by-9-foot door, 200-amp service, and an industrial exhaust system. Both buildings have high-speed fiber internet.
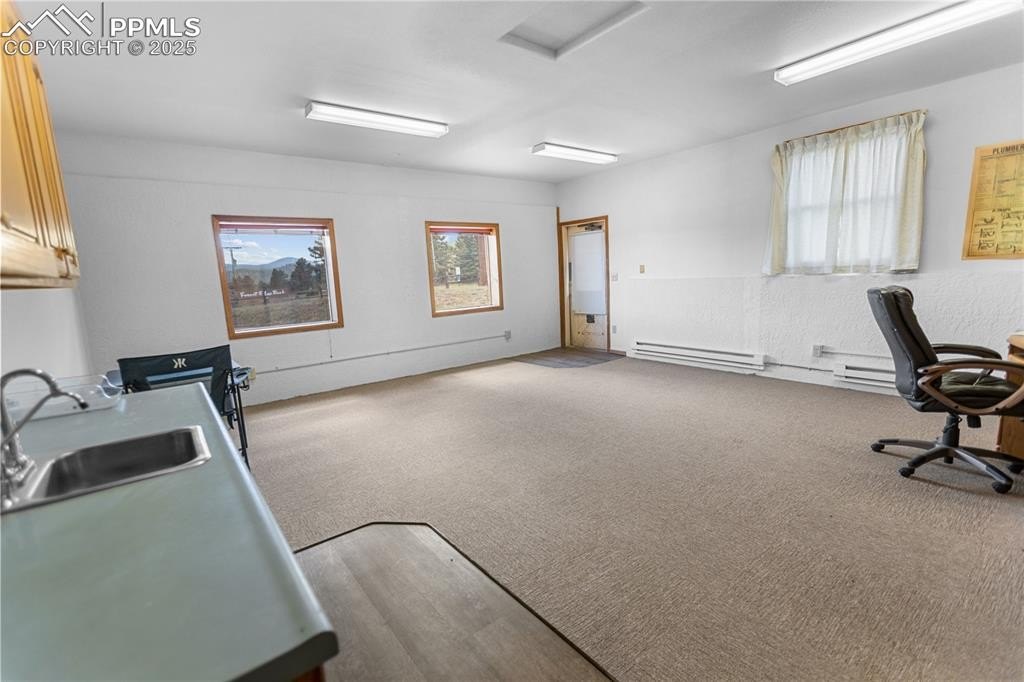
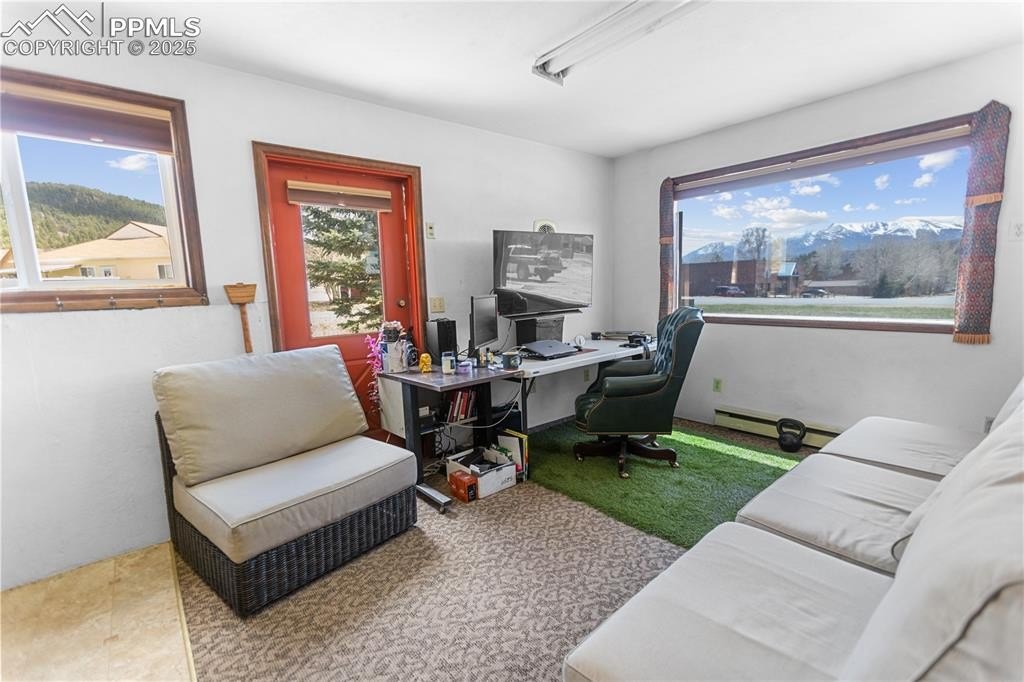
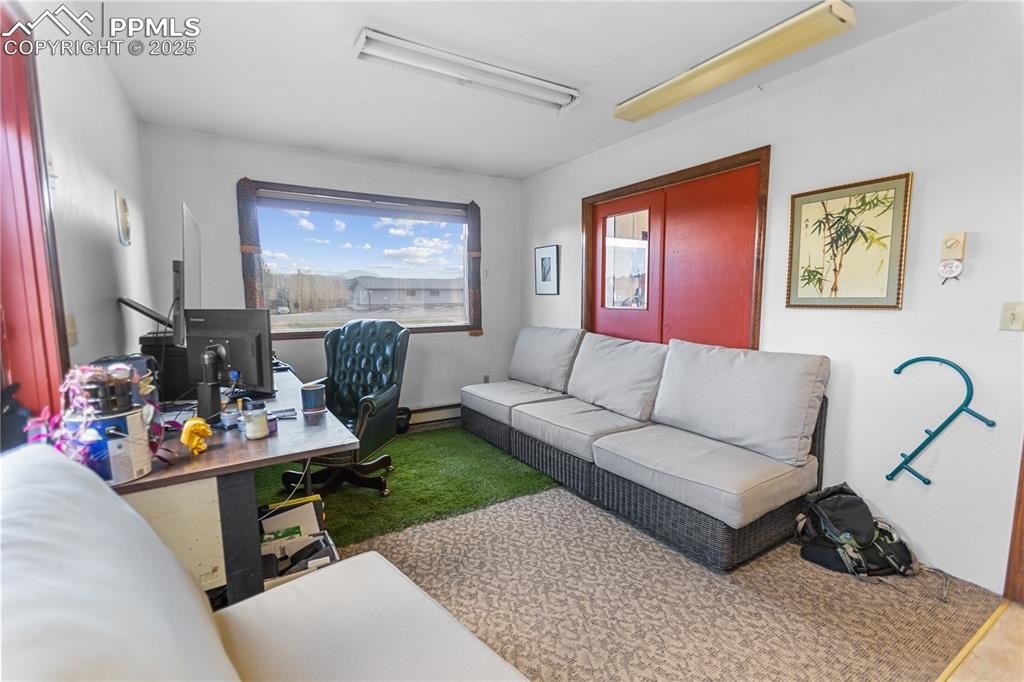
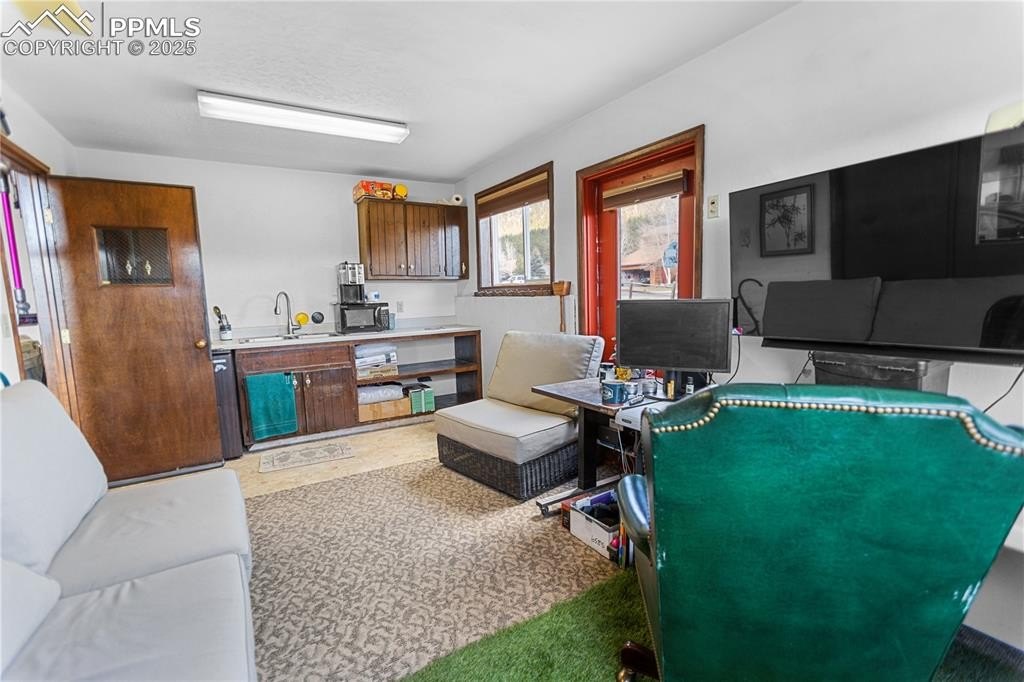
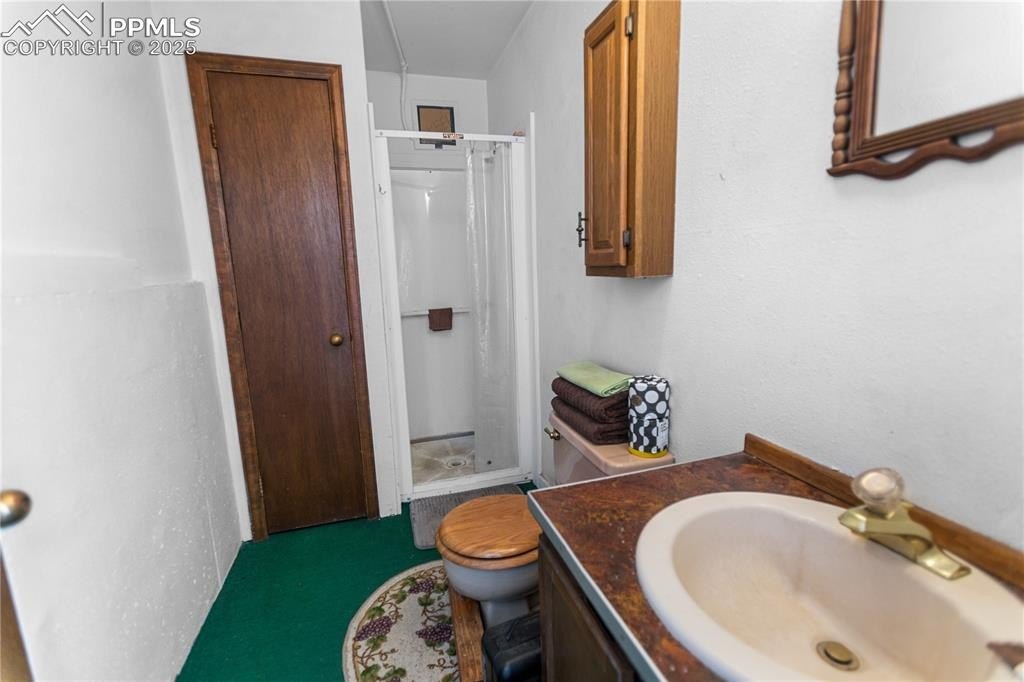
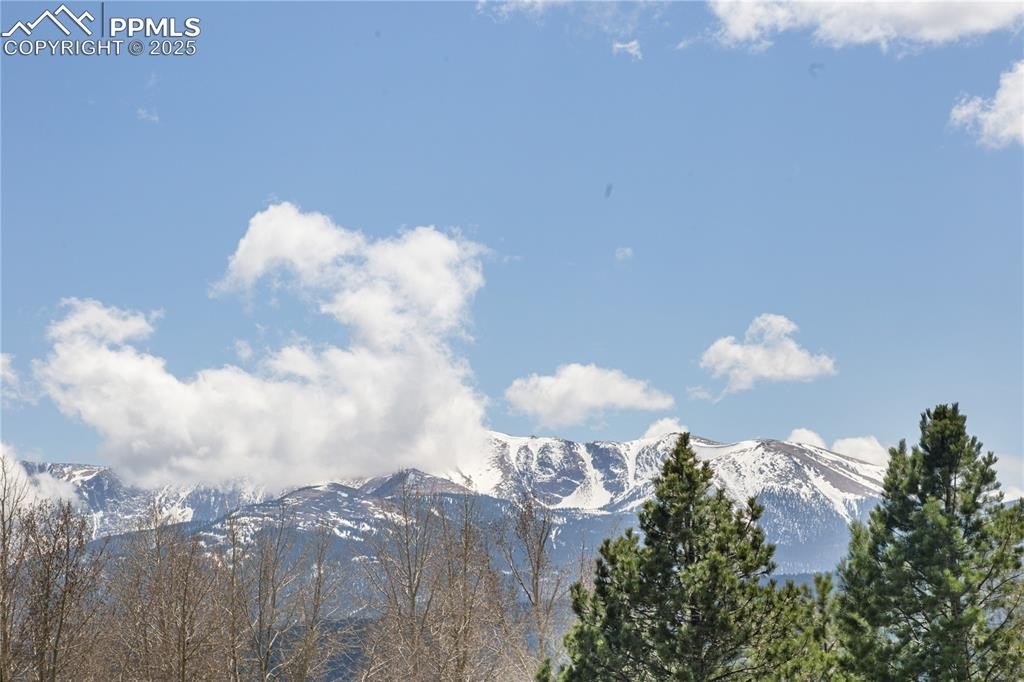
The second building adds an office with a kitchenette and refrigerator, along with a bathroom. Bermed construction and Trombe Wall passive solar design are incorporated into the property. Neighborhood Commercial zoning is in place, with a south-facing parking lot and views toward Pikes Peak. The property is located on Rampart Range Road in Woodland Park, Colorado.
The second building adds an office with a kitchenette and refrigerator, along with a bathroom. Bermed construction and Trombe Wall passive solar design are incorporated into the property. Neighborhood Commercial zoning is in place, with a south-facing parking lot and views toward Pikes Peak. The property is located on Rampart Range Road in Woodland Park, Colorado.
Key Highlights
- Two‑building flex property totaling approximately 2,368 square feet
- Building 1 includes approximately 1,408 sq ft, 400 amp service, and a 23x31 garage with 13 ft ceiling
- Building 2 includes approximately 960 sq ft, 200 amp service, and a 23x28 garage with 10 ft ceilings
Financial Insights
Estimated NOI and Cap Rate
NOI / Yr
$33,517
Cap Rate
8.38%
Suggested Prices Based on Cap Rates
Cap Rate 5%
$670,340
$670.3K
Cap Rate 7%
$478,814
$478.8K
Cap Rate 9%
$372,411
$372.4K
Market Conditions
NOI Build-Up for 2,368 SF
Gross rent
$50.3K $21.24/SF
− Vacancy
−$2.4K −$1.02/SF
EGI
$47.9K $20.22/SF
− OpEx
−$14.4K −$6.07/SF
NOI
$33.5K $14.15/SF
Area
Teller County, CO
Vacancy
4.80%
Lease Rate
$21.24 /SF/Yr
Expense Ratio
30.00%
Simulate Cap Rate and NOI
Suggested Prices Based on Cap Rates
Cap Rate 5%
$670,340
Cap Rate 7%
$478,814
Cap Rate 9%
$372,411
Alternative Uses
Best Use
Retail
$478.8K
$419.0K – $558.6K
NOI $33,517 @ 7.0% cap · market cap 8.38%
Second Best
Flex RnD
$448.8K
$392.7K – $523.6K
NOI $31,418 @ 7.0% cap · market cap 7.85%
Theoretical Best
Office A
$605.2K
$529.6K – $706.1K
NOI $42,367 @ 7.0% cap · market cap 10.59%
Zoning and permitted uses should be independently verified with authorities.
How Realmo checks its estimates
Property Analytics
Unlock full access to Insights
Subscribe to Realmo Intelligence
Open Analytics
Current Use
Lease Details
2
Office units
Yes
Paved road access
Yes
Utilities to site
Location Intelligence
Trade Area within ½ mile
564
Businesses Nearby
Under-served
Demand for This Use
Explore this area
Business Placement
Demographics for 80863, CO
12,738
Population
5,734
Households
2.2
Avg Household Size
49
Median Age
42%
College-Educated
97%
High-School Grad
173.4 sq mi
ZIP Area
73
Density / Sq Mi
$100,011
Median Household Income
$49,333
Median Earnings
$1,960
Median Rent
$503,400
Median Home Value
Check the figures for this property
Cap Rate, Value Estimation, Potential NOI and more
View Realmo Analytics
Market
Vacancy Rate% for Office in West region

Questions? Ask Rey
Realmo’s AI knows this listing — price, zoning, demand, history. Ask anything.





Frequently Asked Questions
What type of property is this?
Flex space - Neighborhood Commercial zoning accompanies garage, showroom, office, storage, and restroom areas across two separate buildings.
Where is this flex space located?
The property is located at 500 Rampart Range Road Woodland Park, CO.
What is the asking price?
The asking price for this property is $400,000.
What are key features of this property?
This property features: Two‑building flex property totaling approximately 2,368 square feet; Building 1 includes approximately 1,408 sq ft, 400 amp service, and a 23x31 garage with 13 ft ceiling; Building 2 includes approximately 960 sq ft, 200 amp service, and a 23x28 garage with 10 ft ceilings