Three-Unit Income
For Sale
$565,900
50 Mason Street, Biddeford, ME 04005
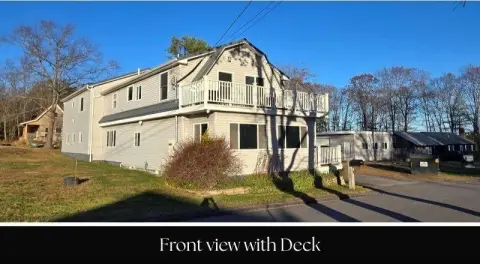
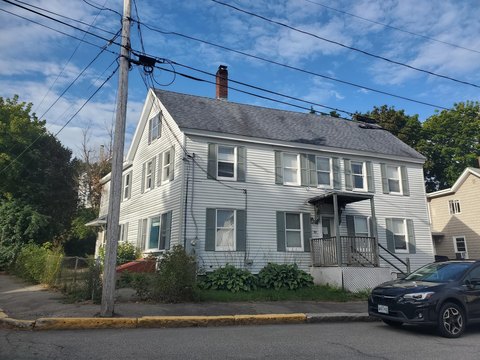
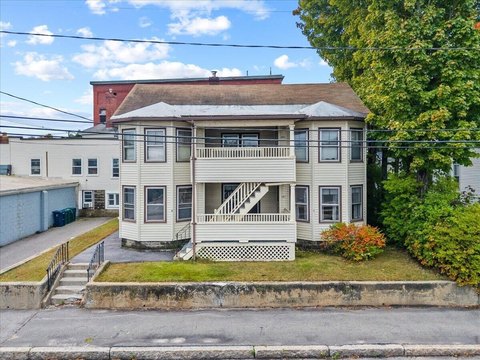
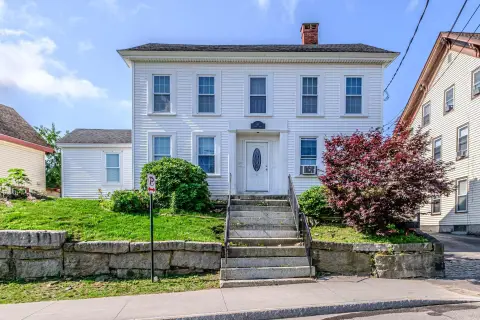
Three fully rented units with updated roof and deck plus ample off-street parking for convenient tenant access.
Property Size2,766 SF
Price / SF$204.59
Days on Market184
Property Features for 50 Mason Street
General Information
Standard status
Active
Size
2,766 SF
Total Parking Spaces
6
Property subtype
Multi-family
Occupancy
100%
Additional Details
Business Included
Yes
Multifamily Units
3
Building Details
Year Built
1899
Tenancy
Multi
Listing Agency:
Greater Portland Realty
Listed By:
Kathy Apon
(207) 797-7777
Source:
Profoundrealestate
Added: Apr 17
Changed: Oct 16
Last Checked: Oct 16 at 8:58AM
Displayed information is deemed reliable but is not guaranteed and should be independently verified. All listing content including descriptions, pricing, images are the copyrighted material of Greater Portland Realty

Ask AI about this property
Review the available facts, identify missing information and prepare questions for the agent.
Investment Insights
Based on property information with market context.
This three-unit triplex is fully rented and set up for straightforward residential income ownership. The unit mix includes a spacious multi-level 3-bedroom, 1.5-bath unit, a 2-bedroom, 1-bath unit, and a 1-bedroom, 1-bath unit. Recent updates include a new roof and a new deck, supporting a turn-key ownership experience.
The property is located on a quiet dead-end street, just minutes from downtown Biddeford. The setting provides easy access to local shops, restaurants, and everyday amenities, while the off-street parking layout includes a six-car lot to accommodate resident needs.
For tenants, the mix of bedroom sizes can fit a range of households within the same building, and the additional deck and updated roof help maintain day-to-day comfort. For owner-occupiers, the fully rented configuration also offers the option of future occupancy while continuing to generate rental income. With ample off-street parking and a clear three-unit layout, this is a practical residential investment opportunity or owner-occupancy path in Biddeford.
The property is located on a quiet dead-end street, just minutes from downtown Biddeford. The setting provides easy access to local shops, restaurants, and everyday amenities, while the off-street parking layout includes a six-car lot to accommodate resident needs.
For tenants, the mix of bedroom sizes can fit a range of households within the same building, and the additional deck and updated roof help maintain day-to-day comfort. For owner-occupiers, the fully rented configuration also offers the option of future occupancy while continuing to generate rental income. With ample off-street parking and a clear three-unit layout, this is a practical residential investment opportunity or owner-occupancy path in Biddeford.
Key Highlights
- Fully rented 3‑unit property with immediate income and future owner‑occupancy potential
- Unit mix includes a multi‑level 3‑bedroom, 1.5‑bath unit, a 2‑bedroom, 1‑bath unit, and a 1‑bedroom, 1‑bath unit
- Recent updates include a new roof and a new deck
Financial Insights
Estimated NOI and Cap Rate
NOI / Yr
$46,824
Cap Rate
8.27%
Suggested Prices Based on Cap Rates
Cap Rate 5%
$936,480
$936.5K
Cap Rate 7%
$668,914
$668.9K
Cap Rate 9%
$520,267
$520.3K
Market Conditions
NOI Build-Up for 2,766 SF
Gross rent
$70.4K $25.44/SF
− Vacancy
−$3.5K −$1.26/SF
EGI
$66.9K $24.18/SF
− OpEx
−$20.1K −$7.25/SF
NOI
$46.8K $16.93/SF
Area
York County, ME
Vacancy
4.94%
Lease Rate
$25.44 /SF/Yr
Expense Ratio
30.00%
Simulate Cap Rate and NOI
Suggested Prices Based on Cap Rates
Cap Rate 5%
$936,480
Cap Rate 7%
$668,914
Cap Rate 9%
$520,267
Alternative Uses
Best Use
Multifamily LT 5
$668.9K
$585.3K – $780.4K
NOI $46,824 @ 7.0% cap · market cap 8.27%
Second Best
Apartment 5plus
$610.7K
$534.3K – $712.5K
NOI $42,747 @ 7.0% cap · market cap 7.55%
Theoretical Best
Office A
$876.8K
$767.2K – $1.02M
NOI $61,377 @ 7.0% cap · market cap 10.85%
Zoning and permitted uses should be independently verified with authorities.
How Realmo checks its estimates
Property Analytics
Unlock full access to Insights
Subscribe to Realmo Intelligence
Open Analytics
Current Use
Lease Details
3
Residential units
100%
Occupancy
Multi-tenant
Tenancy
Turnkey business
Opportunity
Location Intelligence
Trade Area within ½ mile
986
Businesses Nearby
Explore this area
Business Placement
Demographics for 04005, ME
24,581
Population
11,001
Households
2.2
Avg Household Size
39
Median Age
29%
College-Educated
95%
High-School Grad
47.9 sq mi
ZIP Area
513
Density / Sq Mi
$71,268
Median Household Income
$39,176
Median Earnings
$1,186
Median Rent
$351,700
Median Home Value
Check the figures for this property
Cap Rate, Value Estimation, Potential NOI and more
View Realmo Analytics
Market
Vacancy Rate% for Multifamily in Northeast region




Frequently Asked Questions
What type of property is this?
Triplex - Three fully rented units with updated roof and deck plus ample off-street parking for convenient tenant access.
Where is this triplex located?
The property is located at 50 Mason Street Biddeford, ME.
What is the asking price?
The asking price for this property is $565,900.
What are key features of this property?
This property features: Fully rented 3‑unit property with immediate income and future owner‑occupancy potential; Unit mix includes a multi‑level 3‑bedroom, 1.5‑bath unit, a 2‑bedroom, 1‑bath unit, and a 1‑bedroom, 1‑bath unit; Recent updates include a new roof and a new deck


