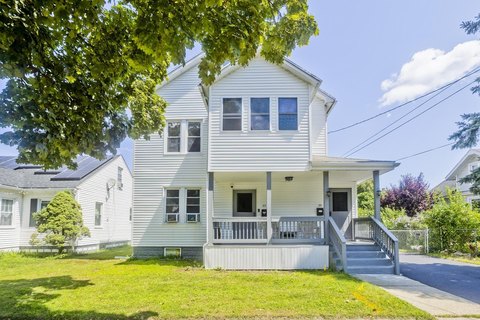
Renovated Two-Family
For Sale
$399,987
50-52 Sycamore St, Springfield, MA 01109
Vacant property with separate utilities, gas heat, and gas hot water serving both units.
Property Size1,880 SF
Price / SF$212.76
Days on Market68
Property Features for 50-52 Sycamore St
General Information
Standard status
Active
Size
1,880 SF
Property subtype
2 Family - 2 Units Up/Down
Additional Details
Highway Access
Yes
Building Details
Year Built
1911
Buildings
1
Tenancy
Multi
Listing Agency:
Hampden Realty Center, LLC
(413) 507-2988
Listed By:
Bill Nichols · License #452508723
(413) 887-8816
Source:
Lockandkeyre
Added: Jul 30
Changed: Oct 4
Last Checked: Oct 4 at 9:59AM
Displayed information is deemed reliable but is not guaranteed and should be independently verified. All listing content including descriptions, pricing, images are the copyrighted material of Hampden Realty Center, LLC
Investment Insights
Based on property information with market context.
This 1,880-square-foot duplex, built in 1911, contains two fully vacant units and has undergone a recent renovation. Each residence includes new cabinetry, granite countertops, stainless steel appliances, an updated bathroom, and hardwood flooring. Light-colored interiors provide a consistent finish throughout the property.
Utilities are separately metered, while both units use gas heat and gas hot water. The two-unit configuration supports either an owner-occupant arrangement with rental income from the second residence or continued leasing of both units. The property also offers convenient access to highways and downtown Springfield.
Utilities are separately metered, while both units use gas heat and gas hot water. The two-unit configuration supports either an owner-occupant arrangement with rental income from the second residence or continued leasing of both units. The property also offers convenient access to highways and downtown Springfield.
Key Highlights
- Two‑unit duplex with 1,880 SF of building area
- Fully vacant and recently renovated
- New cabinets, granite countertops, and stainless steel appliances in both units
Financial Insights
Estimated NOI and Cap Rate
NOI / Yr
$27,827
Cap Rate
6.96%
Suggested Prices Based on Cap Rates
Cap Rate 5%
$556,540
$556.5K
Cap Rate 7%
$397,529
$397.5K
Cap Rate 9%
$309,189
$309.2K
Market Conditions
NOI Build-Up for 1,880 SF
Gross rent
$41.7K $22.20/SF
− Vacancy
−$2.0K −$1.05/SF
EGI
$39.8K $21.15/SF
− OpEx
−$11.9K −$6.34/SF
NOI
$27.8K $14.80/SF
Area
Springfield, MA
Vacancy
4.75%
Lease Rate
$22.20 /SF/Yr
Expense Ratio
30.00%
Simulate Cap Rate and NOI
Suggested Prices Based on Cap Rates
Cap Rate 5%
$556,540
Cap Rate 7%
$397,529
Cap Rate 9%
$309,189
Alternative Uses
Best Use
Multifamily LT 5
$397.5K
$347.8K – $463.8K
NOI $27,827 @ 7.0% cap · market cap 6.96%
Second Best
Apartment 5plus
$353.6K
$309.4K – $412.6K
NOI $24,754 @ 7.0% cap · market cap 6.19%
Theoretical Best
Office A
$510.5K
$446.7K – $595.6K
NOI $35,735 @ 7.0% cap · market cap 8.93%
Zoning and permitted uses should be independently verified with authorities.
Property Analytics
Current Use
Lease Details
Multi-tenant
Tenancy
Yes
Highway access
Location Intelligence
Trade Area within ½ mile
498
Businesses Nearby
Explore this area
Business Placement
Demographics for 01109, MA
30,968
Population
10,786
Households
2.9
Avg Household Size
30
Median Age
17%
College-Educated
77%
High-School Grad
5.4 sq mi
ZIP Area
5,735
Density / Sq Mi
$46,821
Median Household Income
$34,971
Median Earnings
$1,112
Median Rent
$203,100
Median Home Value
Market
Vacancy Rate% for Multifamily in Northeast region

Questions? Ask Rey
Realmo’s AI knows this listing — price, zoning, demand, history. Ask anything.




Frequently Asked Questions
What type of property is this?
Duplex - Vacant property with separate utilities, gas heat, and gas hot water serving both units.
Where is this duplex located?
The property is located at 50-52 Sycamore St Springfield, MA.
What is the asking price?
The asking price for this property is $399,987.
What are key features of this property?
This property features: Two‑unit duplex with 1,880 SF of building area; Fully vacant and recently renovated; New cabinets, granite countertops, and stainless steel appliances in both units



