Flex Building with Drive-In
For Sale
Contact for pricing
4941 E ADMIRAL PL, Tulsa, OK 74115
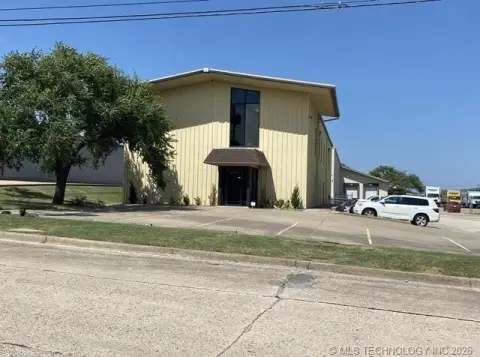
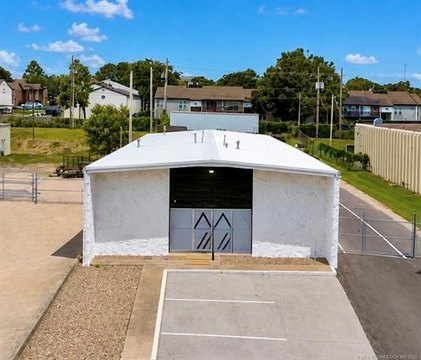
Versatile flex property with retail frontage, multiple service bays, and on-site apartments for owner-operator use.
Property Size11,515 SF
Price / SF$60.79
Days on Market150
Property Features for 4941 E ADMIRAL PL
General Information
Standard status
Active
Size
11,515 SF
Class
C
Total Parking Spaces
7
Property subtype
Retail, Mixed Use
Zoning
CS
Investment Type
Owner/User
Site & Location
Neighborhood
Maxwell
Highway Access
Yes
Additional Details
Heavy Power
Yes
Multifamily Units
2
Building Details
Year Built
1938
Buildings
1
Stories
2
Units
1
Listing Agency:
SVN | OAK Realty Advisors
Listed By:
Dakota Owen · License #210600
(832) 769-1128
Source:
Crexi
Added: May 28
Changed: Oct 18
Last Checked: Oct 23 at 6:56AM
Displayed information is deemed reliable but is not guaranteed and should be independently verified. All listing content including descriptions, pricing, images are the copyrighted material of SVN | OAK Realty Advisors

Ask AI about this property
Review the available facts, identify missing information and prepare questions for the agent.
Investment Insights
Based on property information with market context.
This flex building totals 11,515 SF and is configured to support a mix of retail, service, and storage use. The property features a prominent retail showroom/storefront with street exposure, along with multiple garage/service bays with drive-in access. Dedicated warehouse or storage areas provide approximately 4,920 SF for inventory, equipment, or operational needs. The building also includes two small live-in apartments, currently under renovation, which can support on-site management or additional rental income. A two-story layout provides flexible rooming options for a variety of mixed-use concepts, and the property is equipped with a 600-amp electrical service. Surface parking is available for approximately seven vehicles.
The property is located on East Admiral Place in a high-visibility commercial corridor zoned CH. It sits directly across from a QuikTrip convenience store and gas station, and it offers convenient access to the I-244 interchange for regional connectivity. The positioning along a heavily trafficked corridor supports daily customer and delivery access.
With its combination of showroom frontage, drive-in service bays, and dedicated warehouse/storage space, the building is well-suited to automotive repair and service, retail or service operations, light industrial use, or live-work configurations. For an owner-user, the on-site apartments provide a practical way to keep management close to the operation during renovations and turn-key buildout planning.
The property is located on East Admiral Place in a high-visibility commercial corridor zoned CH. It sits directly across from a QuikTrip convenience store and gas station, and it offers convenient access to the I-244 interchange for regional connectivity. The positioning along a heavily trafficked corridor supports daily customer and delivery access.
With its combination of showroom frontage, drive-in service bays, and dedicated warehouse/storage space, the building is well-suited to automotive repair and service, retail or service operations, light industrial use, or live-work configurations. For an owner-user, the on-site apartments provide a practical way to keep management close to the operation during renovations and turn-key buildout planning.
Key Highlights
- 11,515 SF flexible commercial building for retail, service, automotive, warehouse, owner‑user, or mixed‑use uses
- About 4,920 SF dedicated warehouse/storage area plus a two‑story layout for versatile space configuration
- Multiple garage/service bays with drive‑in access and a prominent retail showroom/storefront with street exposure
Financial Insights
Estimated NOI and Cap Rate
NOI / Yr
$59,728
Cap Rate
8.53%
Suggested Prices Based on Cap Rates
Cap Rate 5%
$1,194,560
$1.2M
Cap Rate 7%
$853,257
$853.3K
Cap Rate 9%
$663,644
$663.6K
Market Conditions
NOI Build-Up for 11,515 SF
Gross rent
$96.7K $8.40/SF
− Vacancy
−$4.8K −$0.42/SF
EGI
$91.9K $7.98/SF
− OpEx
−$32.2K −$2.79/SF
NOI
$59.7K $5.19/SF
Area
Tulsa, OK
Vacancy
5.00%
Lease Rate
$8.40 /SF/Yr
Expense Ratio
35.00%
Simulate Cap Rate and NOI
Suggested Prices Based on Cap Rates
Cap Rate 5%
$1,194,560
Cap Rate 7%
$853,257
Cap Rate 9%
$663,644
Alternative Uses
Best Use
Retail
$1.58M
$1.39M – $1.85M
NOI $110,848 @ 7.0% cap · market cap 15.84%
Second Best
Warehouse
$960.3K
$840.2K – $1.12M
NOI $67,218 @ 7.0% cap · market cap 9.60%
Theoretical Best
Office A
$2.46M
$2.15M – $2.87M
NOI $171,918 @ 7.0% cap · market cap 24.56%
Zoning and permitted uses should be independently verified with authorities.
How Realmo checks its estimates
Property Analytics
Who owns this building?
See the owner, sales and loan history
Open Analytics
Current Use
Lease Details
2
Residential units
Yes
Heavy power
Yes
Highway access
Location Intelligence
Trade Area within ½ mile
302
Businesses Nearby
Under-served
Demand for This Use
Explore this area
Business Placement
Demographics for 74115, OK
24,461
Population
9,583
Households
2.6
Avg Household Size
32
Median Age
9%
College-Educated
72%
High-School Grad
16.0 sq mi
ZIP Area
1,529
Density / Sq Mi
$43,111
Median Household Income
$27,179
Median Earnings
$987
Median Rent
$74,900
Median Home Value
Check the figures for this property
Cap Rate, Value Estimation, Potential NOI and more
View Realmo Analytics
Market
Vacancy Rate% for Industrial in Tulsa, OK




Frequently Asked Questions
What type of property is this?
Flex space - Versatile flex property with retail frontage, multiple service bays, and on-site apartments for owner-operator use.
Where is this flex space located?
The property is located at 4941 E ADMIRAL PL Tulsa, OK.
What is the asking price?
The asking price for this property is $700,000.
What are key features of this property?
This property features: 11,515 SF flexible commercial building for retail, service, automotive, warehouse, owner‑user, or mixed‑use uses; About 4,920 SF dedicated warehouse/storage area plus a two‑story layout for versatile space configuration; Multiple garage/service bays with drive‑in access and a prominent retail showroom/storefront with street exposure


