Mixed-Use Office and Apartment
49 Portland Street South Berwick, ME 03908
New
For Sale
$565,000
COMMERCIAL - South Berwick, ME
Property Size3,120 SF
Lot Size0.27 Acres
Price / SF$181.09
Days on Market2
Property Features for 49 Portland Street
General Information
- Property type
- Commercial Sale
- Property subtype
- Office
- Zoning
- B1
- Rooms
- Basement
- Parking features
- Off Street
- Basement
- Unfinished, Full
- Standard status
- Active
- Size
- 3,120 SF
- Lot size
- 0.27 Acres
Taxes and HOA fees
- Tax Year
- 2023
- Tax Annual Amount
- 8355
Utilities
- Sewer type
- Public Sewer
- Heating system
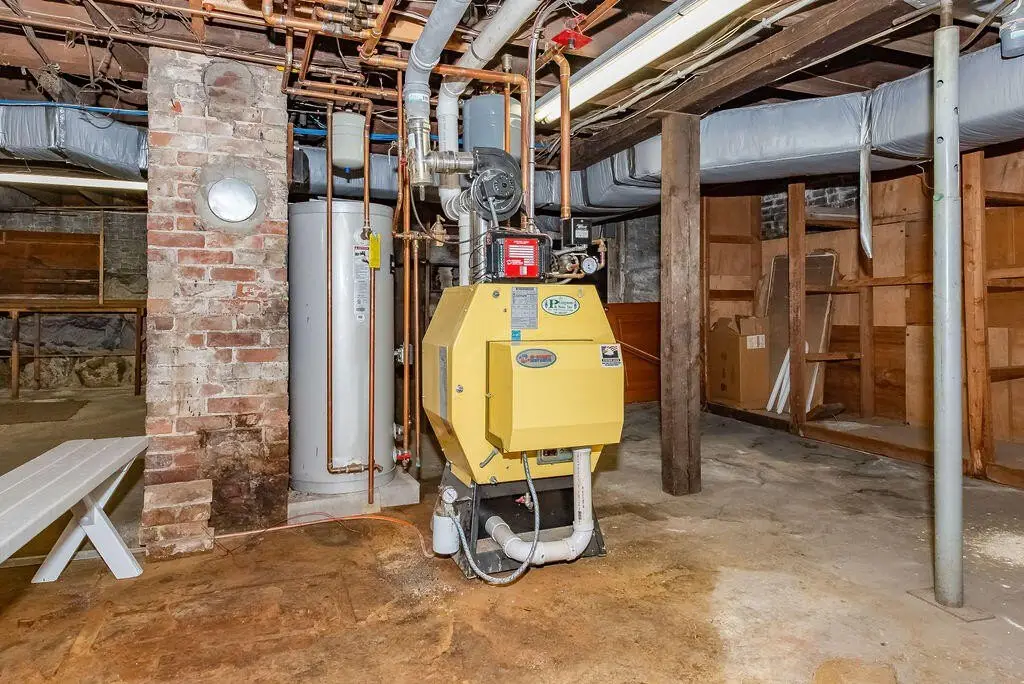
- Baseboard, Hot Water(Heating), Oil
- Cooling system
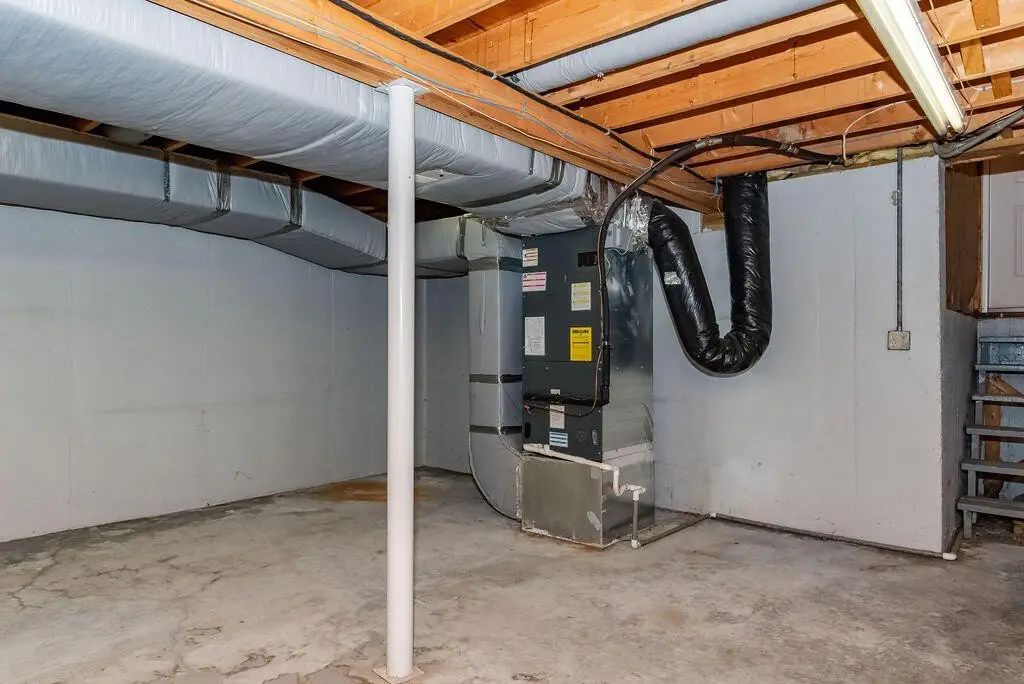
- Central Air
- Water source
- Public
Building Details
- Year built
- 1900
- Number of units
- 3
- Flooring type
- Carpet, Wood
- Building materials
- Wood Frame, Wood Siding
- Roof type
- Shingle, Membrane
Listing Agency:
CENTURY 21 Barbara Patterson
(207) 384-4008
Listed By:
W Gerard Tatlock
(207) 752-0407
Added: Jul 25
Last Checked: Jul 26 at 4:06PM
MLS# 1601934
Copyright © 2026 Maine Listings. All rights reserved. All information provided by the listing agent/broker is deemed reliable but is not guaranteed and should be independently verified.
Investment Insights
Based on property information with market context.
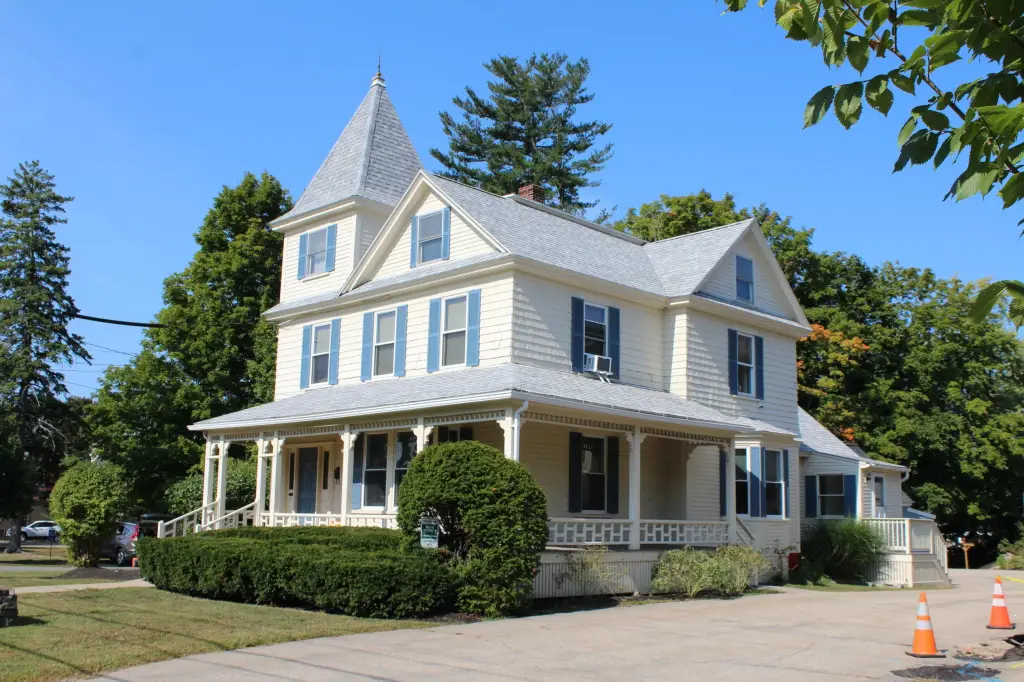
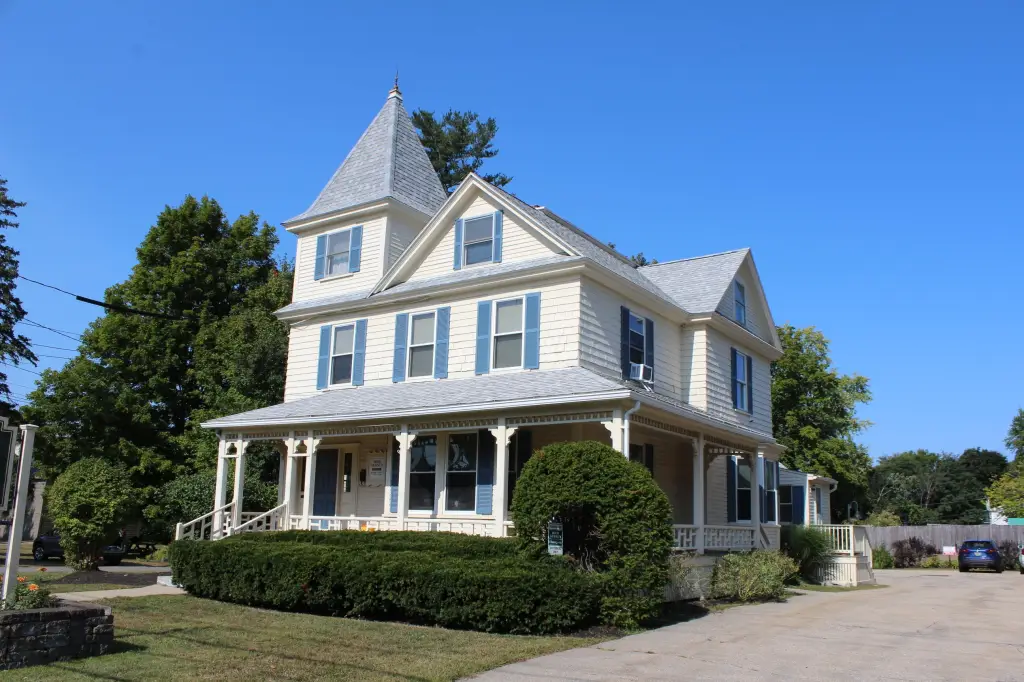
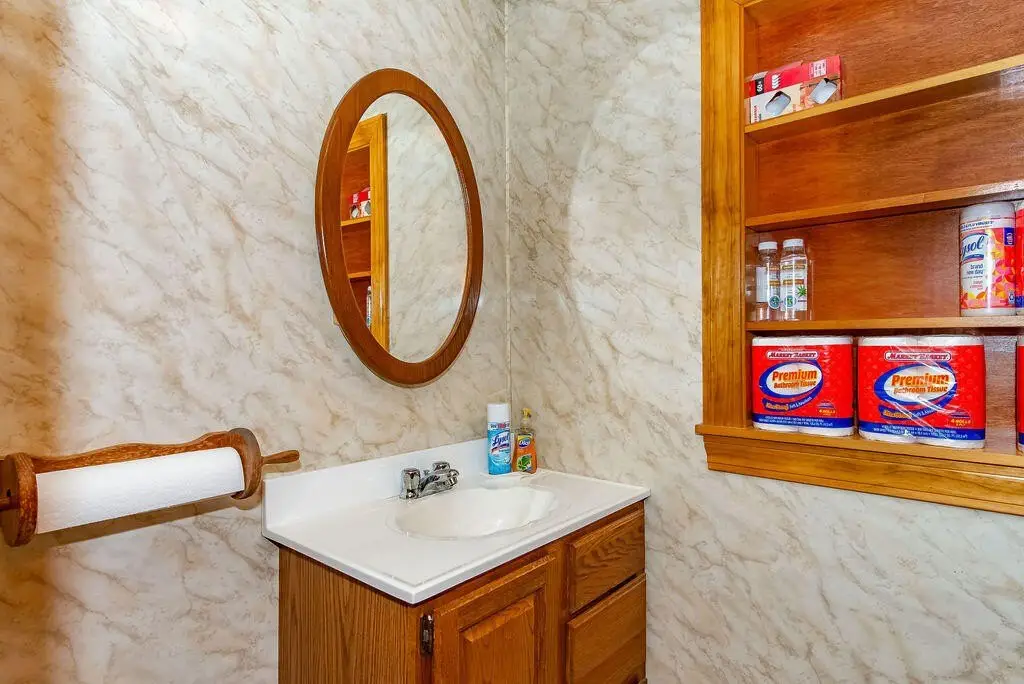
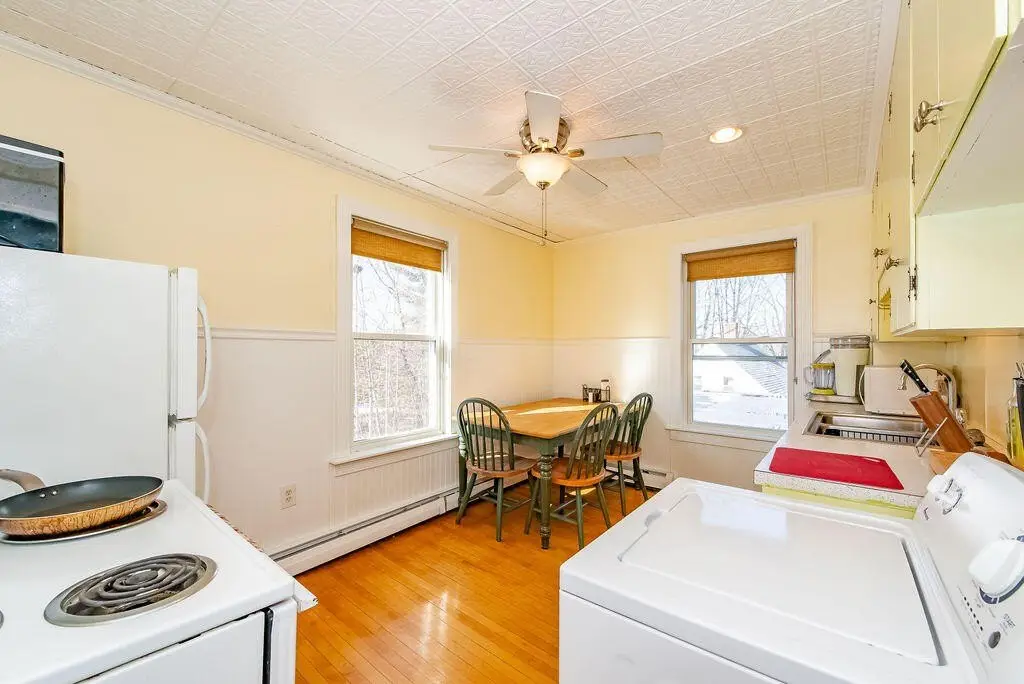
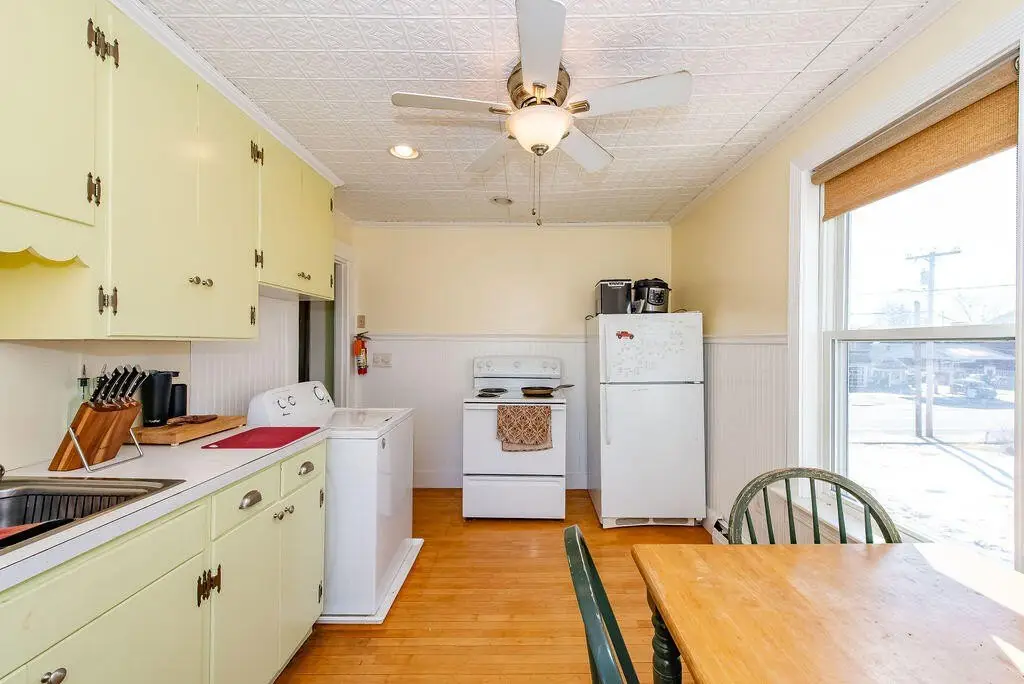
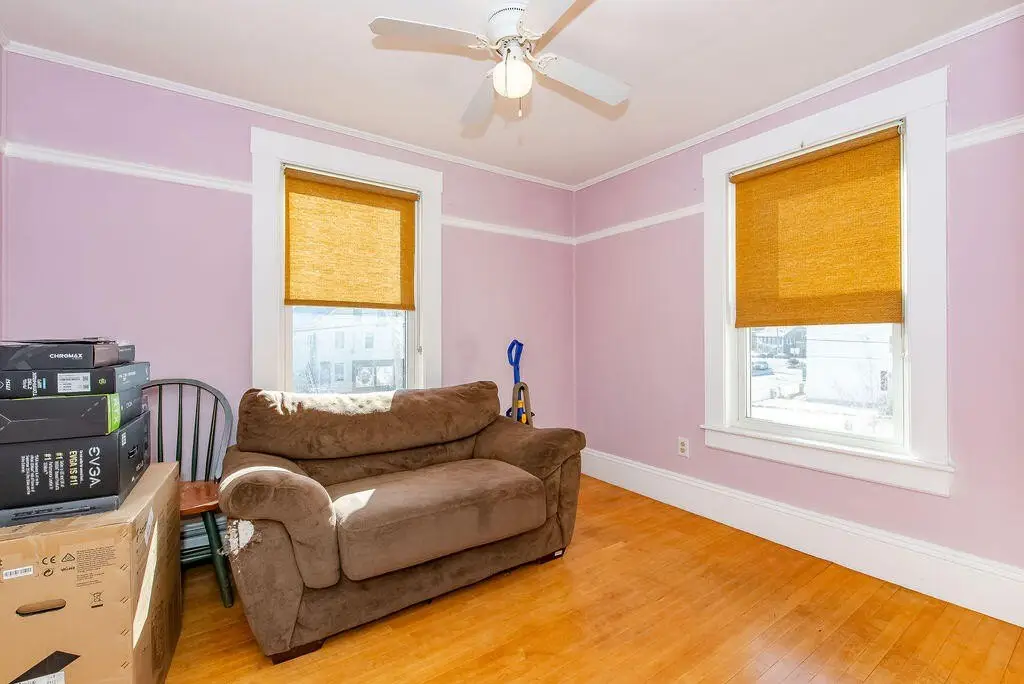
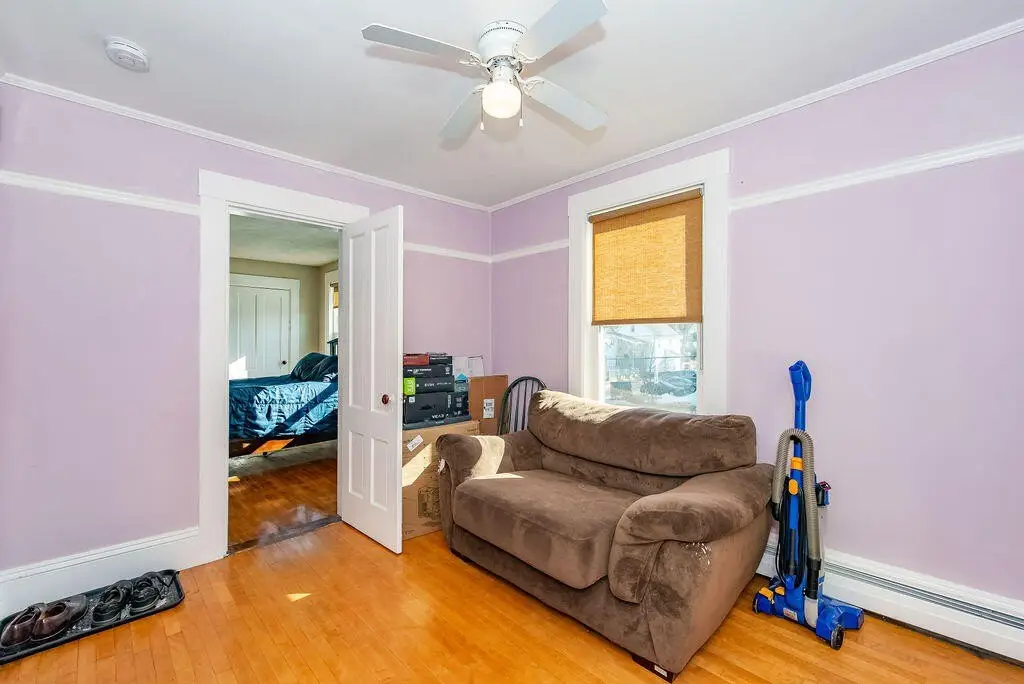
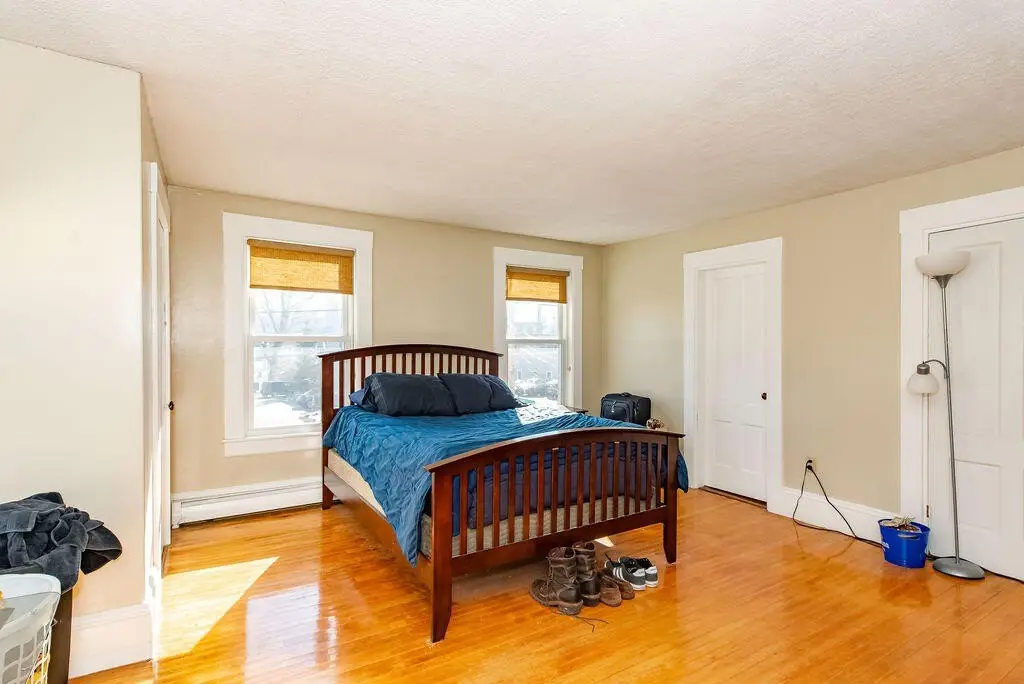
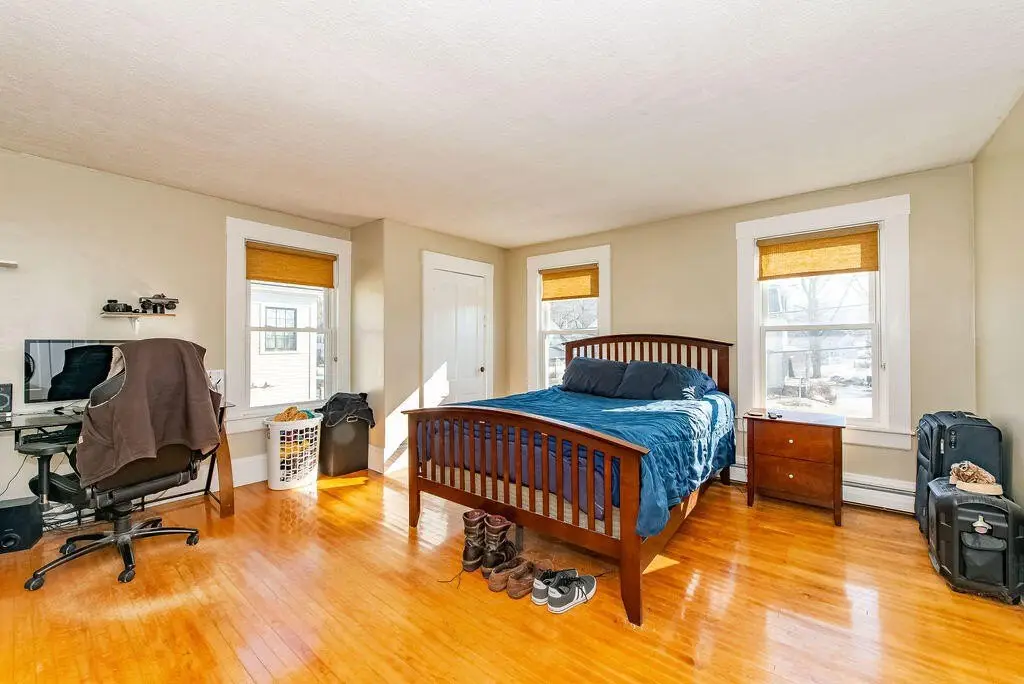
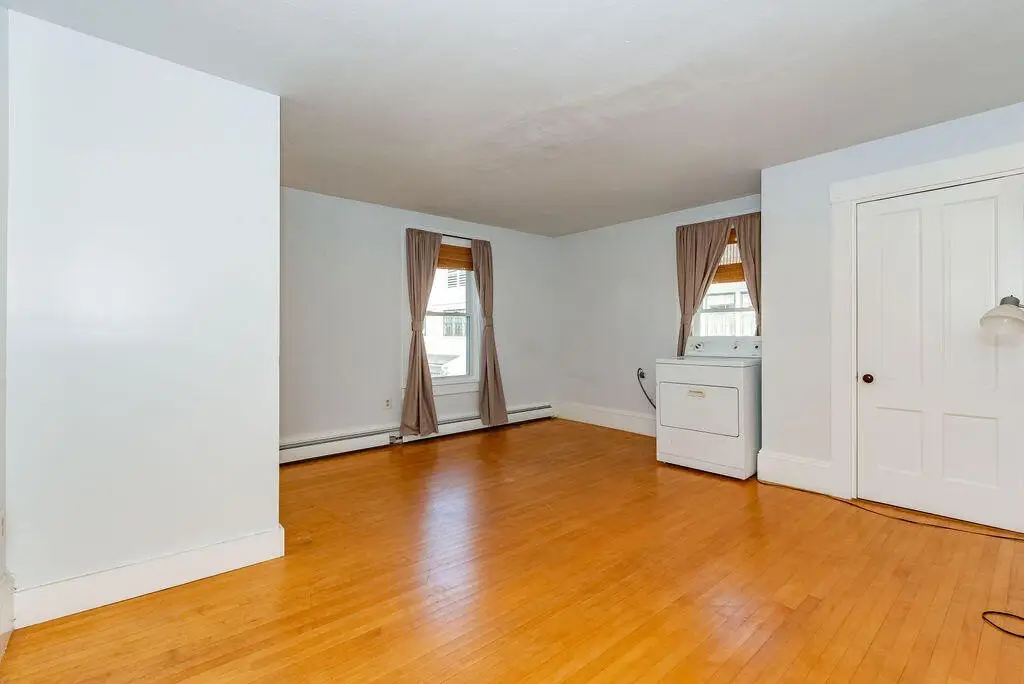
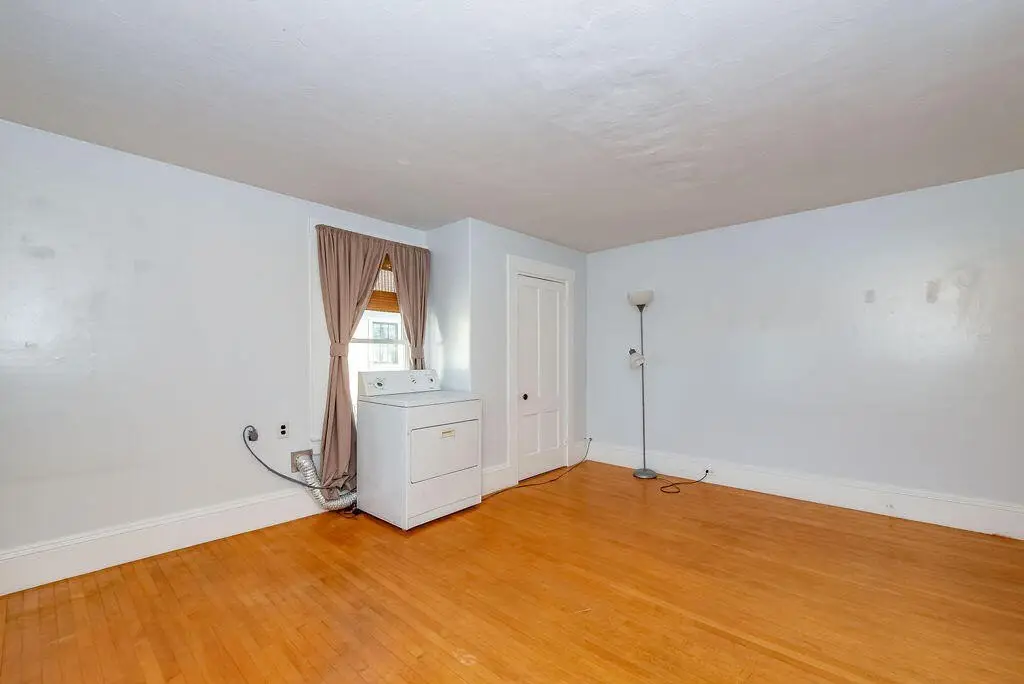
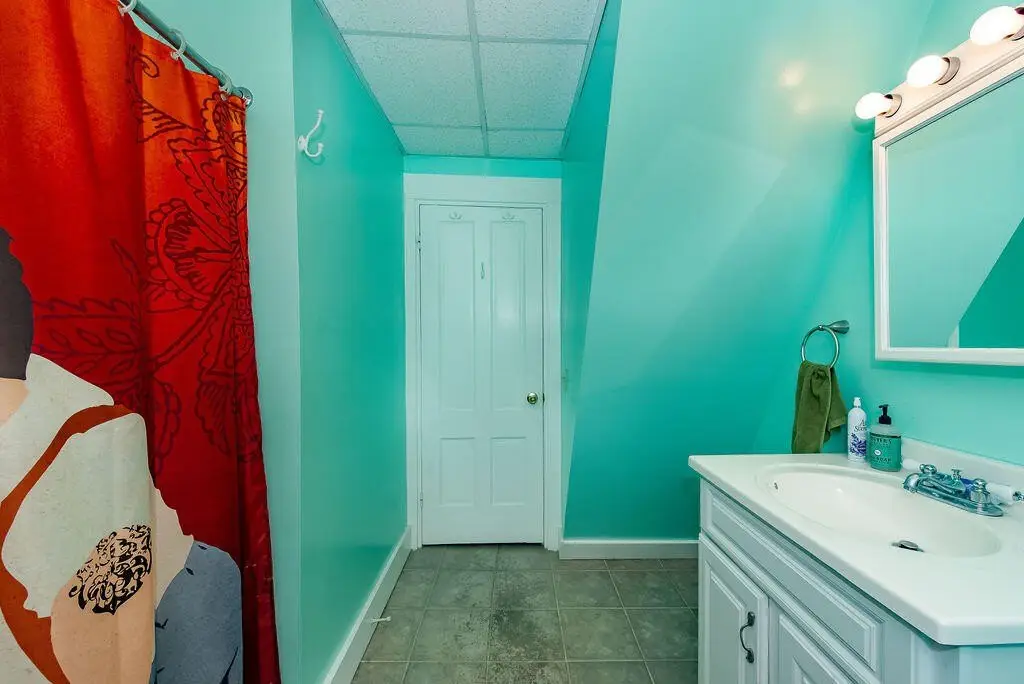
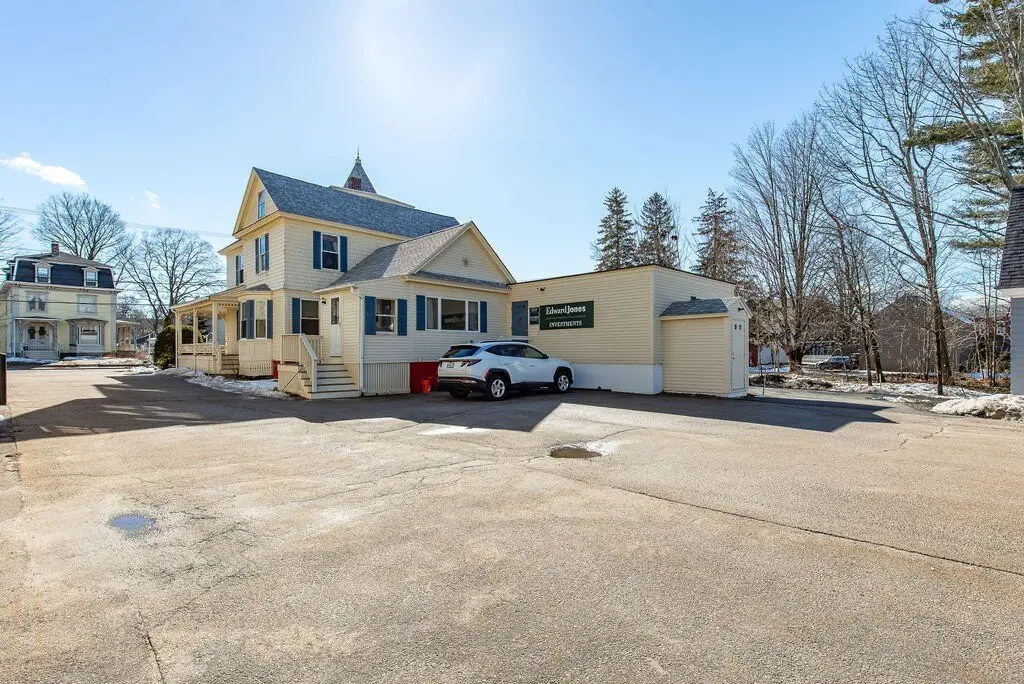
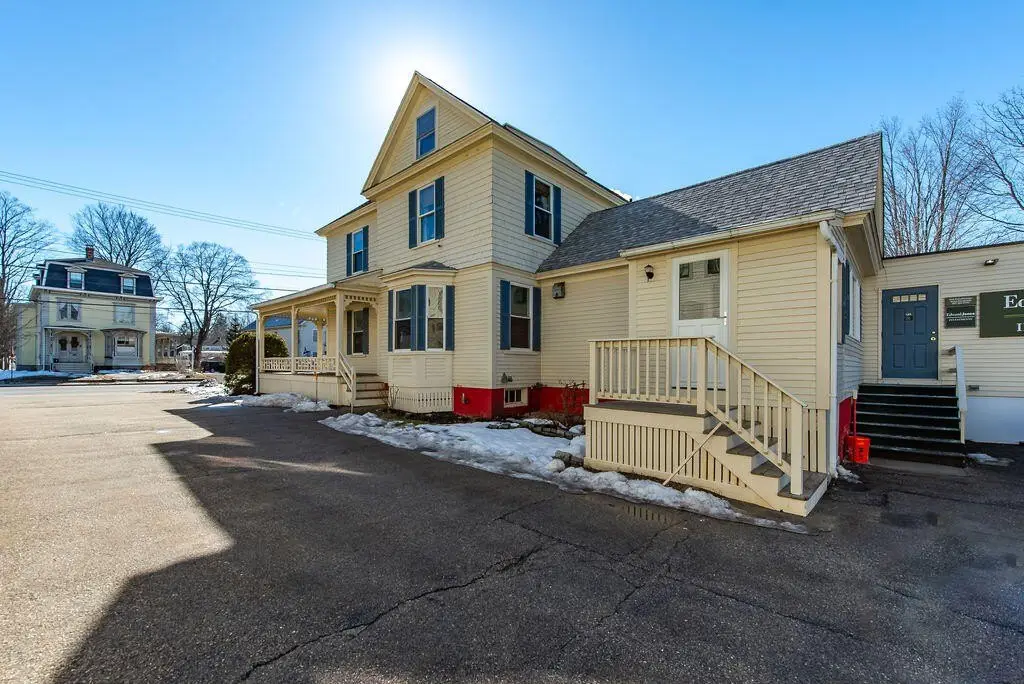
Classic Victorian mixed-use building in downtown South Berwick offering commercial office space and a residential unit. The property currently includes two separate offices, each with its own exterior entrance, plus a second-floor two-bedroom apartment.
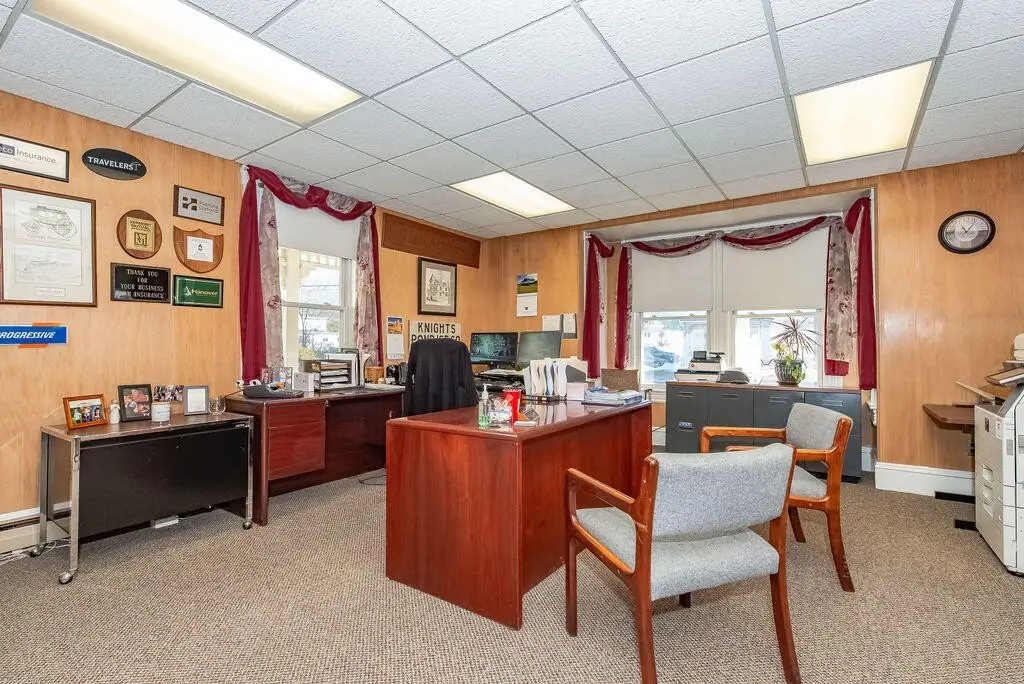
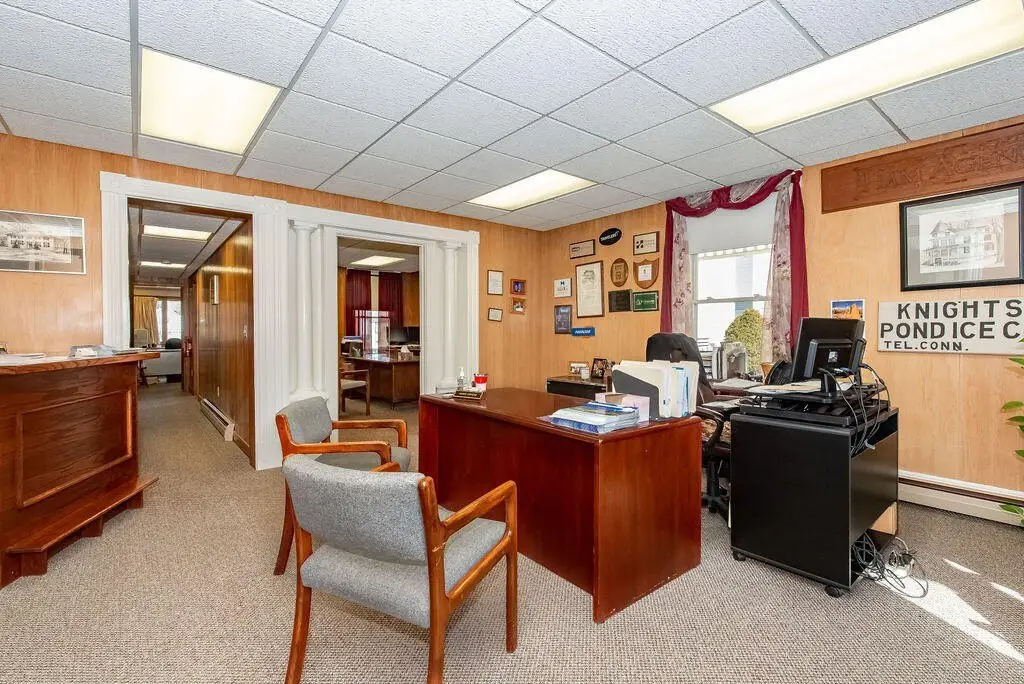
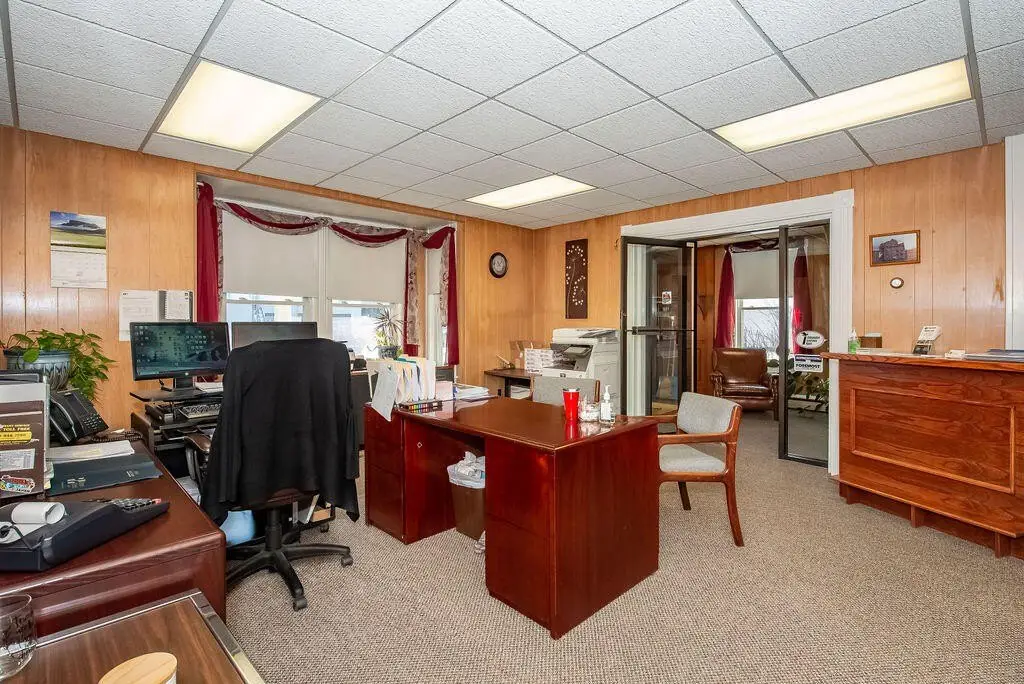
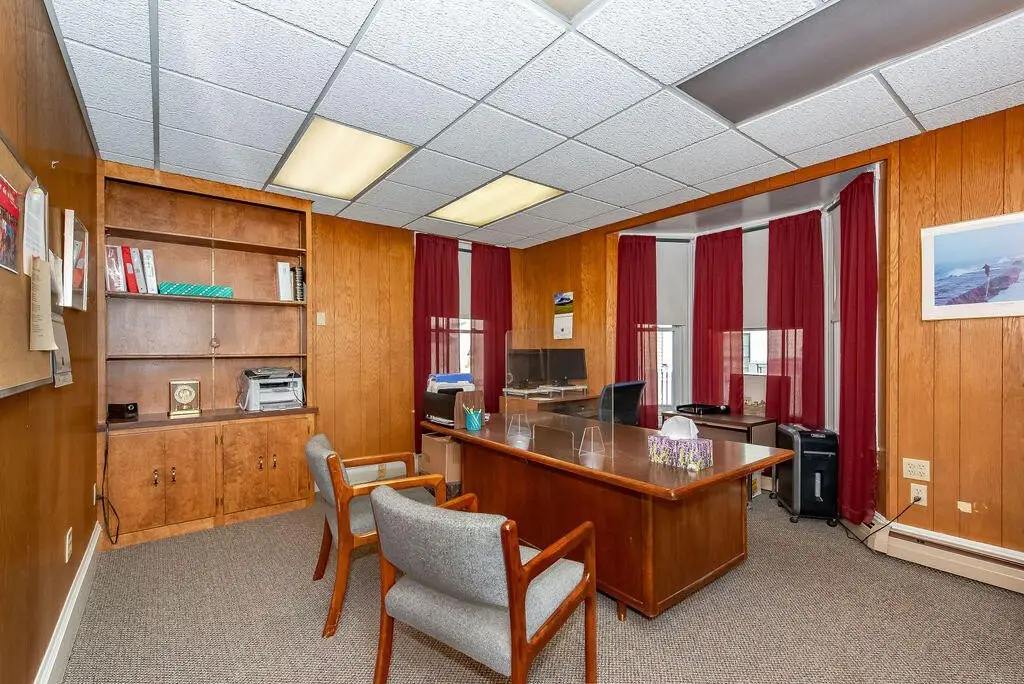
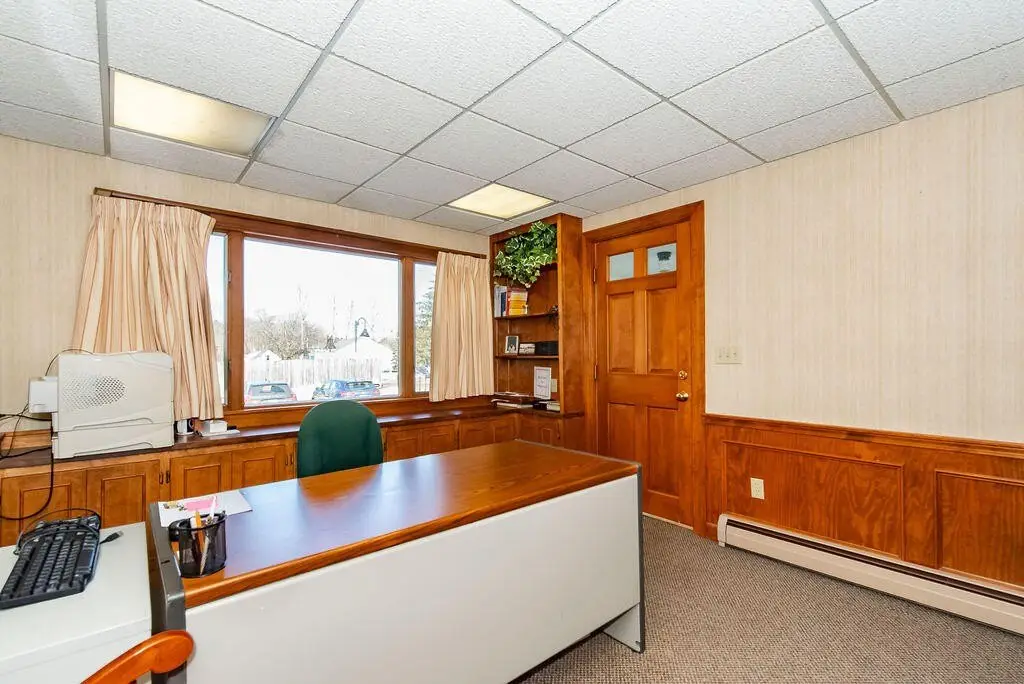
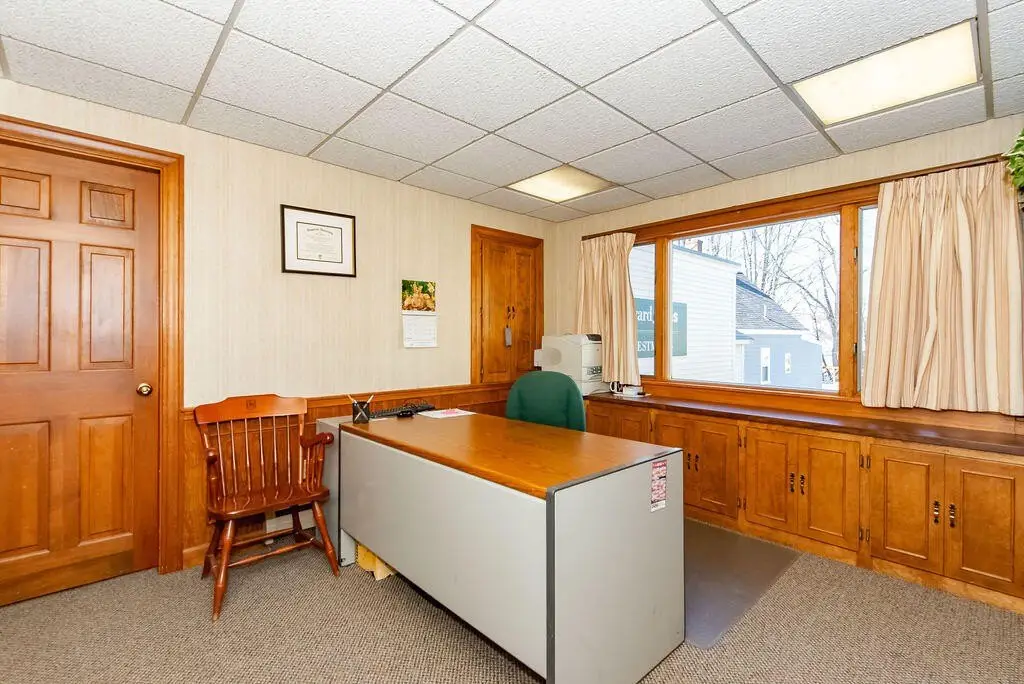
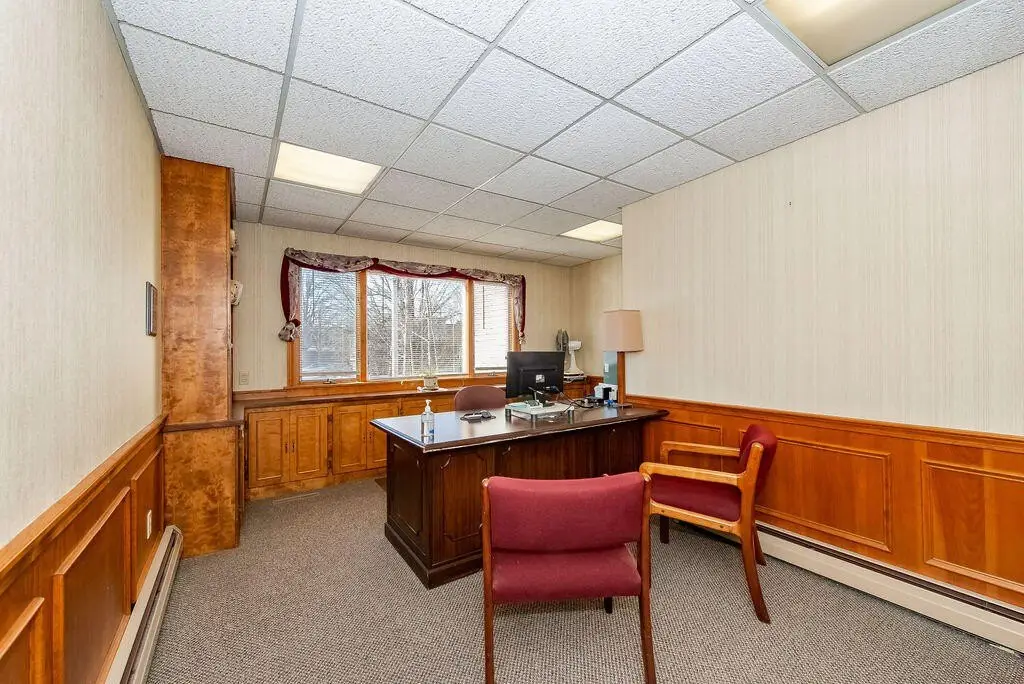
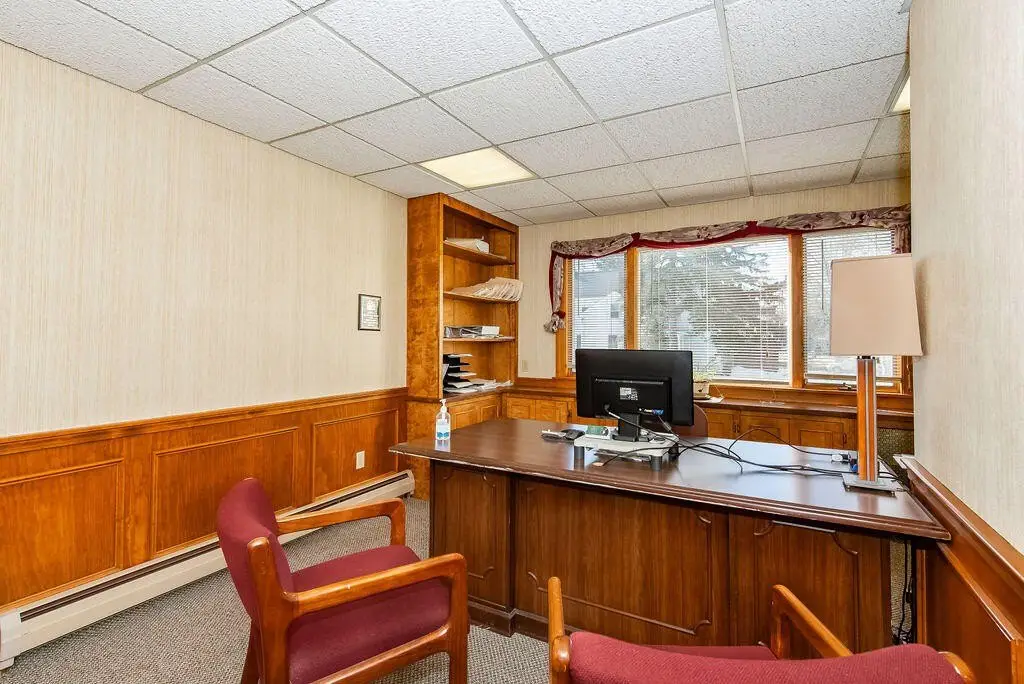
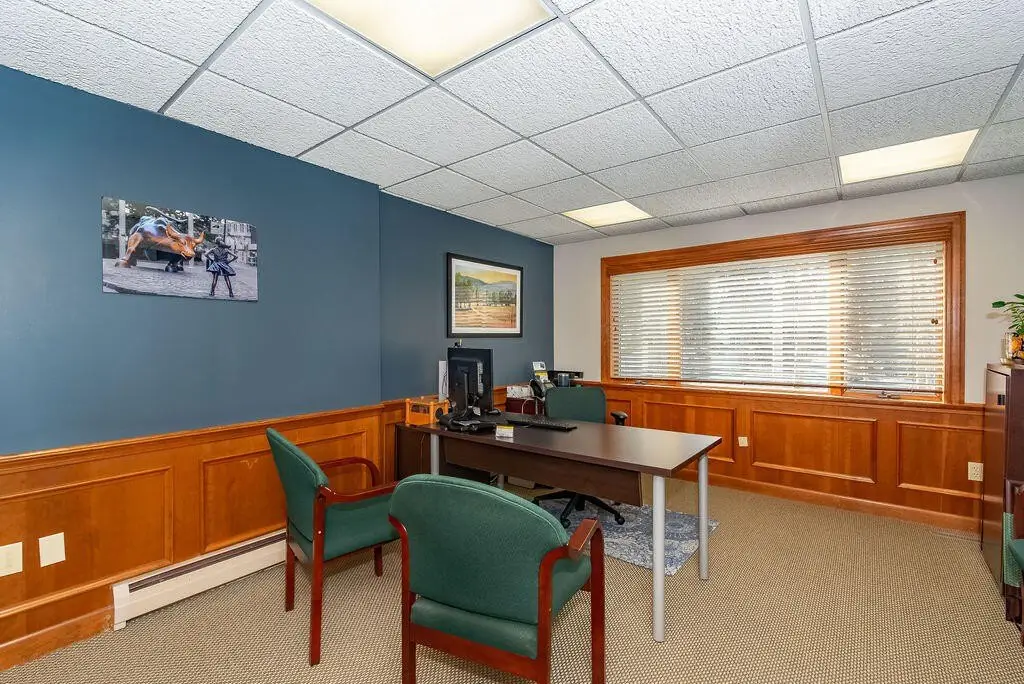
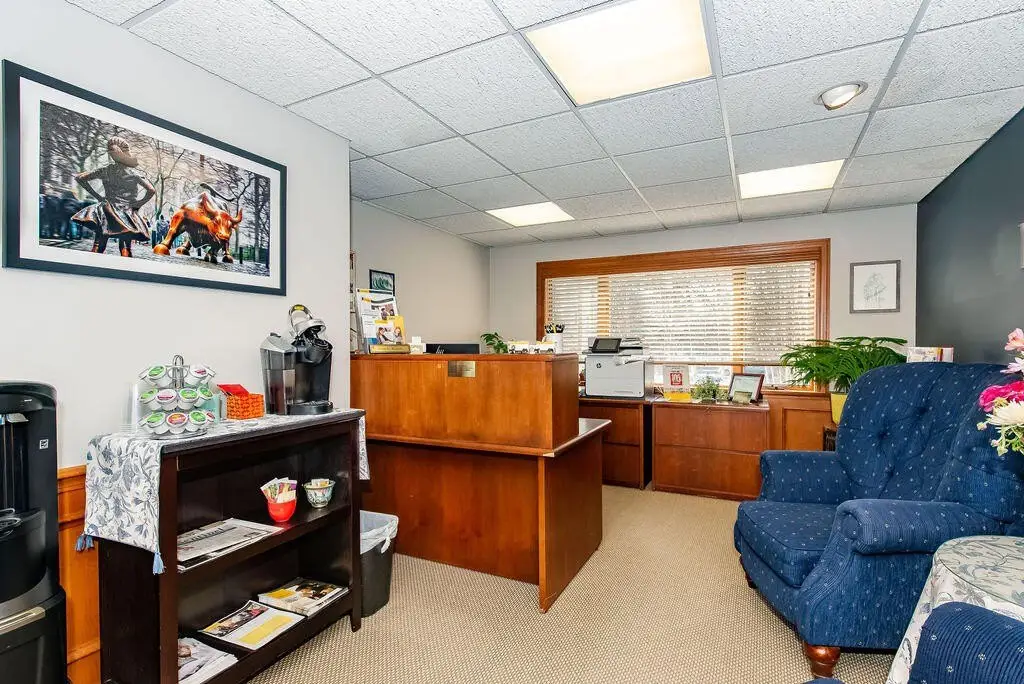
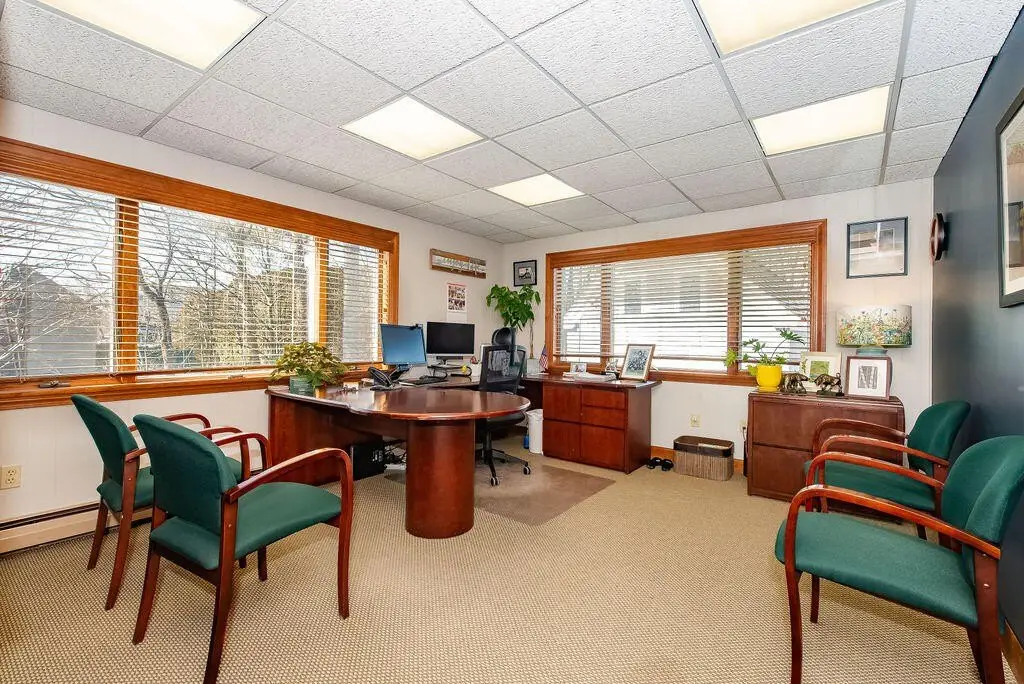
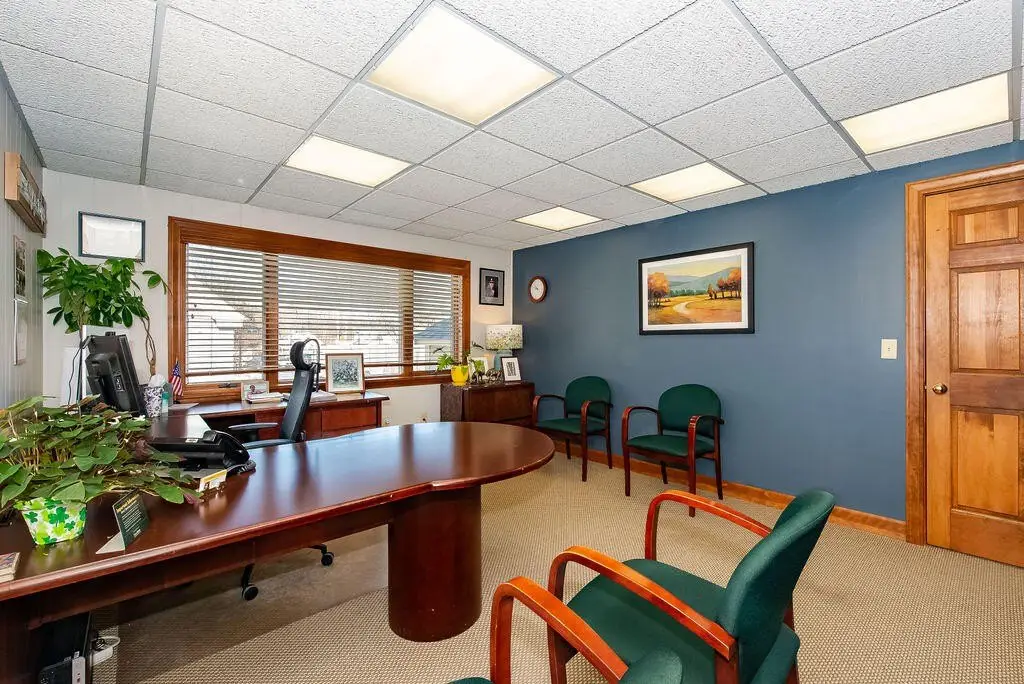
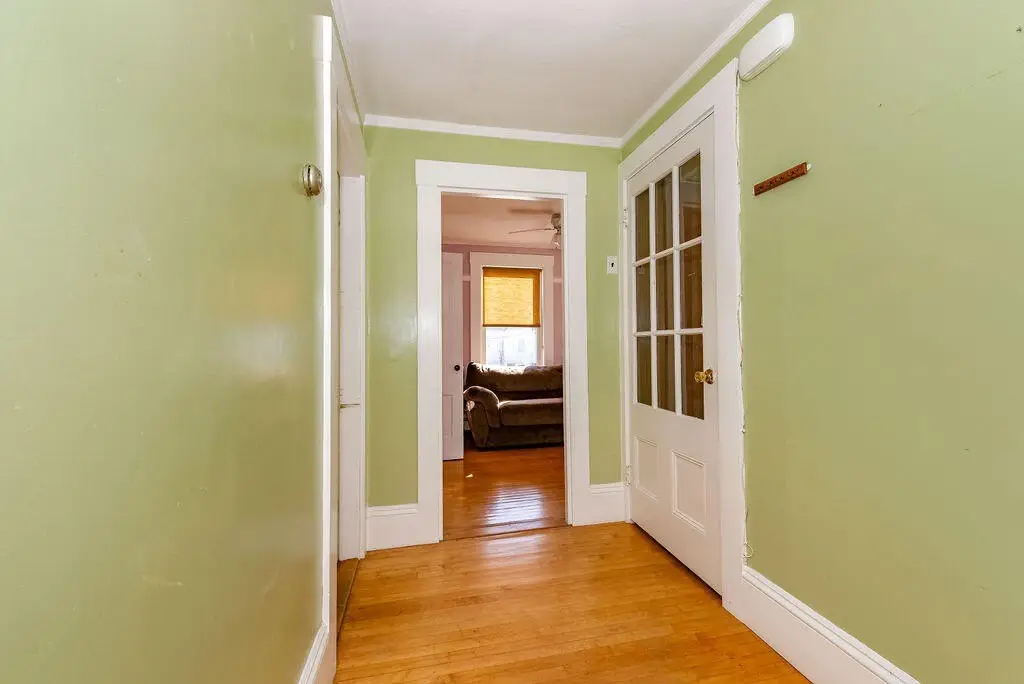
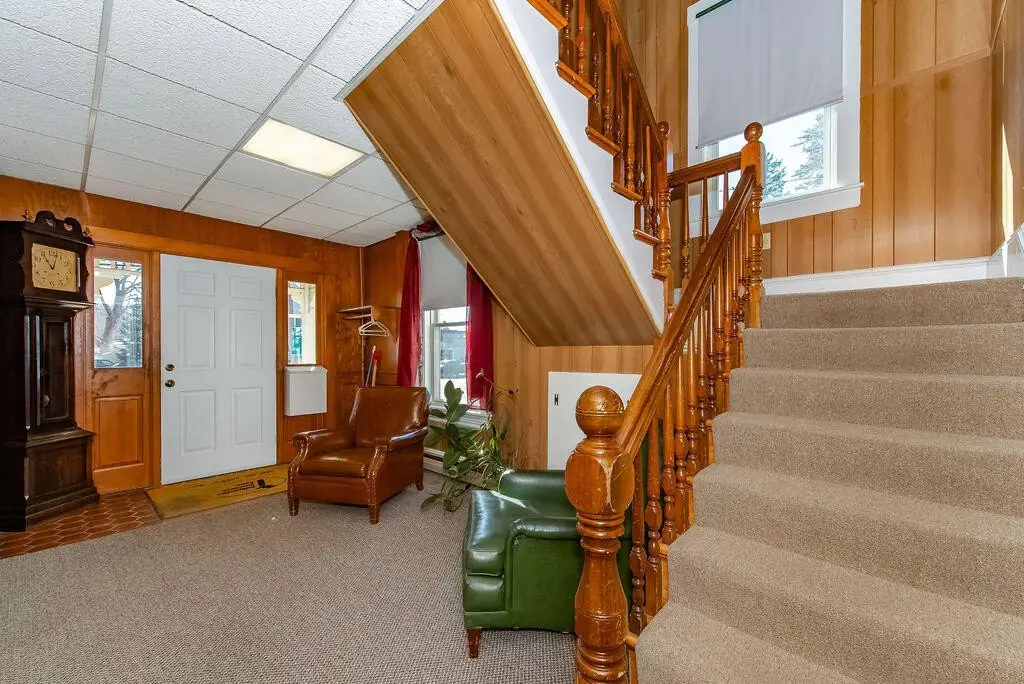
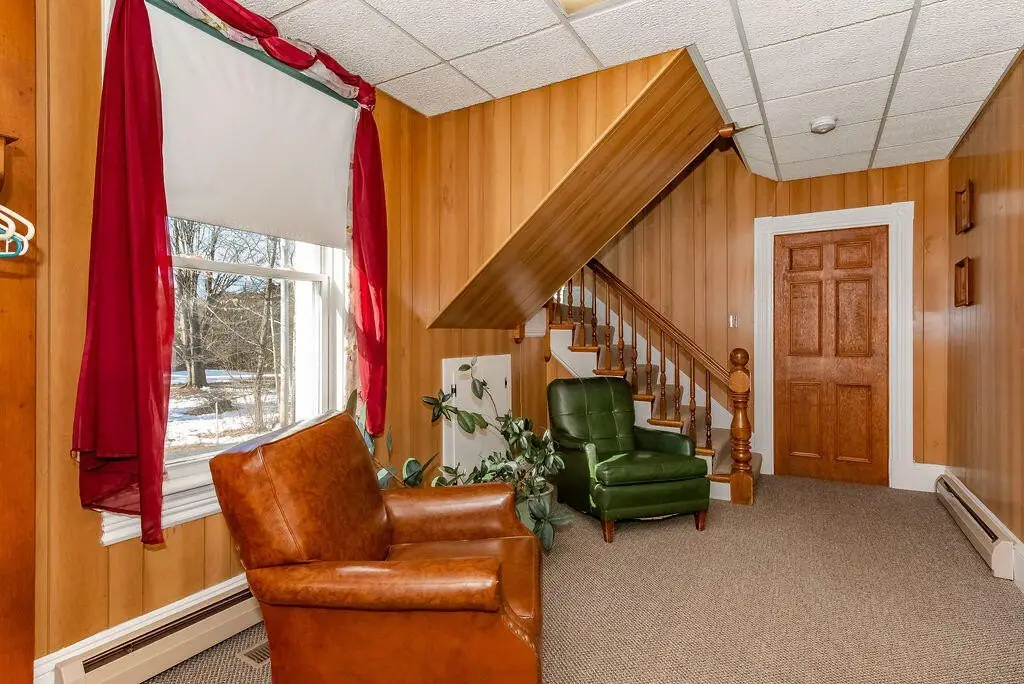
Office 1 features three individual private offices and a reception area. Office 2 features two individual offices and a reception area. Off-street parking is provided for both the businesses and tenants.
The building is described as very well maintained, with replacement windows, an updated heating system, central air conditioning, and separate electrical services. The listing also states there are existing leases for all units.
Office 1 features three individual private offices and a reception area. Office 2 features two individual offices and a reception area. Off-street parking is provided for both the businesses and tenants.
The building is described as very well maintained, with replacement windows, an updated heating system, central air conditioning, and separate electrical services. The listing also states there are existing leases for all units.
Key Highlights
- Downtown South Berwick mixed‑use building with commercial office space plus a second‑floor 2‑bedroom apartment
- Two commercial office suites: Office 1 has 3 private offices and a reception area; Office 2 has 2 private offices and a reception area
- Each office suite has its own exterior entrance
Financial Insights For Office B
Simulate Cap Rate and NOI
NOI Build-Up
- Vacancy
- income lost from leasable area expected to sit empty during the year — subtracted from gross rent.
- EGI (Effective Gross Income)
- gross rent minus vacancy losses — the realistic income before paying operating costs.
- OpEx (Operating Expenses)
- recurring costs to operate the property (property tax, insurance, utilities, maintenance, management) — excludes financing and capital improvements.
- NOI (Net Operating Income)
- income a property generates after operating costs but before financing and taxes.
| Component | $ | $/SF |
|---|---|---|
| Gross rent | $77.9k | $24.96 |
| − Vacancy | −$9.7k | −$3.12 |
| EGI | $68.1k | $21.84 |
| − OpEx | −$17.0k | −$5.46 |
| NOI | $51.1k | $16.38 |
3,120 SF · lease $24.96/SF/yr · vacancy 12.50% · expense 25.00%
Alternative Uses
Best Use
Office B
$730.1K
$638.8K – $851.8K
NOI $51,106 @ 7.0% cap · market cap 9.05%
Second Best
Mixed Use
$553.6K
$484.4K – $645.8K
NOI $38,750 @ 7.0% cap · market cap 6.86%
Theoretical Best
Office A
$989.0K
$865.4K – $1.15M
NOI $69,232 @ 7.0% cap · market cap 12.25%
Zoning and permitted uses should be independently verified with local authorities.
Property Analytics
Property Profile
Location Intelligence
Current Use by Public Records
Ham insurance
Insurance Agency
FAQs
What type of property is this?
Live-work space - Well-maintained building with two street-level offices and a second-floor two-bedroom apartment, each with separate exterior entrances.
Where is this live-work space located?
The property is located at 49 Portland Street South Berwick, ME.
What is the asking price?
The asking price for this property is $565,000.
What are key features of this property?
This property features: Downtown South Berwick mixed‑use building with commercial office space plus a second‑floor 2‑bedroom apartment; Two commercial office suites: Office 1 has 3 private offices and a reception area; Office 2 has 2 private offices and a reception area; Each office suite has its own exterior entrance


