Established Restaurant with
For Sale
$1,595,000
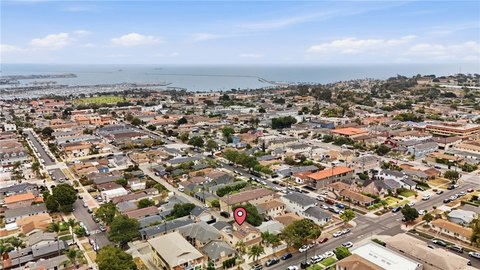
486 West 20th Street, San Pedro, CA 90731
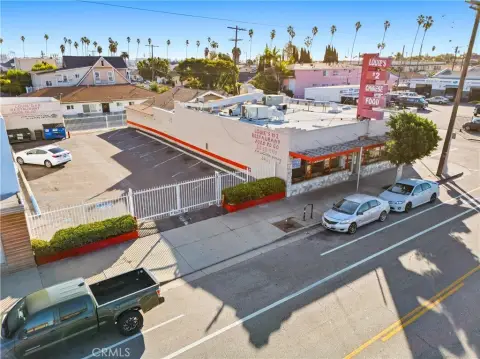
Corner-site restaurant offering an equipped kitchen, dedicated parking, and a renovated two-bedroom residence with separate utilities.
Property Size2,996 SF
Lot Size0.21 Acres
Price / SF$532.38
Days on Market373
Property Features for 486 West 20th Street
General Information
Standard status
Active
Size
2,996 SF
Total Parking Spaces
14
Lot size
0.21 Acres
Property subtype
Commercial Sale / Mixed Use
Net Operating Income
$480,000
Additional Details
Business Included
Yes
Equipment Included
Yes
Building Details
Year Built
1922
Buildings
3
Listing Agency:
T.N.G. Real Estate Consultants
Listed By:
Jacob Abeelen · License #01973535
(714) 987-3310
Source:
Compass
Added: Oct 9, 2025
Changed: Oct 14
Last Checked: Oct 15 at 1:51AM
Displayed information is deemed reliable but is not guaranteed and should be independently verified. All listing content including descriptions, pricing, images are the copyrighted material of T.N.G. Real Estate Consultants

Ask AI about this property
Review the available facts, identify missing information and prepare questions for the agent.
Investment Insights
Based on property information with market context.
This offering combines an operating restaurant, a separate parking parcel, and a renovated residence across two contiguous parcels. The restaurant occupies approximately 2,340 square feet within 2,986 square feet of total improvements and includes a commercial kitchen, dining area, and restroom. Restaurant equipment is included and owned outright. A 15’ x 20’ storage building supports the restaurant’s operations.
The additional 4,502-square-foot parcel is configured as a parking lot with approximately 14 spaces, including two reserved for the neighboring single-family residence. The restaurant site is positioned on a corner with street visibility. The business has operated for more than 70 years, including 25 years under the same family ownership.
The property also includes a fully renovated 656-square-foot, 2-bedroom, 1-bathroom residence with independent utility services. The residence provides residential flexibility alongside the restaurant and commercial improvements.
The additional 4,502-square-foot parcel is configured as a parking lot with approximately 14 spaces, including two reserved for the neighboring single-family residence. The restaurant site is positioned on a corner with street visibility. The business has operated for more than 70 years, including 25 years under the same family ownership.
The property also includes a fully renovated 656-square-foot, 2-bedroom, 1-bathroom residence with independent utility services. The residence provides residential flexibility alongside the restaurant and commercial improvements.
Key Highlights
- Operating restaurant business, real estate, and equipment included
- Approximately 2,340 SF restaurant with commercial kitchen, dining area, and restroom
- Two contiguous 4,502‑square‑foot parcels
Financial Insights
Estimated NOI and Cap Rate
NOI / Yr
$81,139
Cap Rate
5.09%
Suggested Prices Based on Cap Rates
Cap Rate 5%
$1,622,780
$1.6M
Cap Rate 7%
$1,159,129
$1.2M
Cap Rate 9%
$901,544
$901.5K
Market Conditions
NOI Build-Up for 2,996 SF
Gross rent
$110.7K $36.96/SF
− Vacancy
−$2.5K −$0.85/SF
EGI
$108.2K $36.11/SF
− OpEx
−$27.0K −$9.03/SF
NOI
$81.1K $27.08/SF
Area
Los Angeles, CA
Vacancy
2.30%
Lease Rate
$36.96 /SF/Yr
Expense Ratio
25.00%
Simulate Cap Rate and NOI
Suggested Prices Based on Cap Rates
Cap Rate 5%
$1,622,780
Cap Rate 7%
$1,159,129
Cap Rate 9%
$901,544
Alternative Uses
Best Use
Specialty Retail
$1.16M
$1.01M – $1.35M
NOI $81,139 @ 7.0% cap · market cap 5.09%
Second Best
Mixed Use
$866.7K
$758.4K – $1.01M
NOI $60,669 @ 7.0% cap · market cap 3.80%
Theoretical Best
Multifamily LT 5
$60.70M
$53.11M – $70.81M
NOI $4,248,801 @ 7.0% cap · market cap 266.38%
Zoning and permitted uses should be independently verified with authorities.
How Realmo checks its estimates
Property Analytics
Unlock full access to Insights
Subscribe to Realmo Intelligence
Open Analytics
Current Use
Lease Details
Turnkey business
Opportunity
Location Intelligence
Trade Area within ½ mile
5,060
Businesses Nearby
Under-served
Demand for This Use
Explore this area
Business Placement
Demographics for 90731, CA
61,270
Population
24,477
Households
2.5
Avg Household Size
38
Median Age
25%
College-Educated
81%
High-School Grad
9.3 sq mi
ZIP Area
6,588
Density / Sq Mi
$71,936
Median Household Income
$41,324
Median Earnings
$1,645
Median Rent
$808,800
Median Home Value
Check the figures for this property
Cap Rate, Value Estimation, Potential NOI and more
View Realmo Analytics
Market
Vacancy Rate% for Retail in West region





Frequently Asked Questions
What type of property is this?
Conventional restaurant - Corner-site restaurant offering an equipped kitchen, dedicated parking, and a renovated two-bedroom residence with separate utilities.
Where is this conventional restaurant located?
The property is located at 486 West 20th Street San Pedro, CA.
What is the asking price?
The asking price for this property is $1,595,000.
What are key features of this property?
This property features: Operating restaurant business, real estate, and equipment included; Approximately 2,340 SF restaurant with commercial kitchen, dining area, and restroom; Two contiguous 4,502‑square‑foot parcels


