Ranch Duplex Conversion



For Sale
$699,000
4823 W Tumbleweed Lane, McNeal, AZ 85617
Residential Income, Ranch, Southwestern, Mc Neal, AZ
Property Size4,700 SF
Lot Size20.00 Acres
Price / SF$148.72
Days on Market65
Property Features for 4823 W Tumbleweed Lane
General Information
Property type
Residential Multi Family
Property subtype
Duplex
Zoning
Cochise - Call
Parking
20
Patio and Porch features
Deck
Interior features
Walk-In Closet(s)
Exterior features
Balcony, Barbecue, Built-in Barbecue, Courtyard
Fencing
Chain Link
Appliances
Electric Range, Refrigerator
Lot features
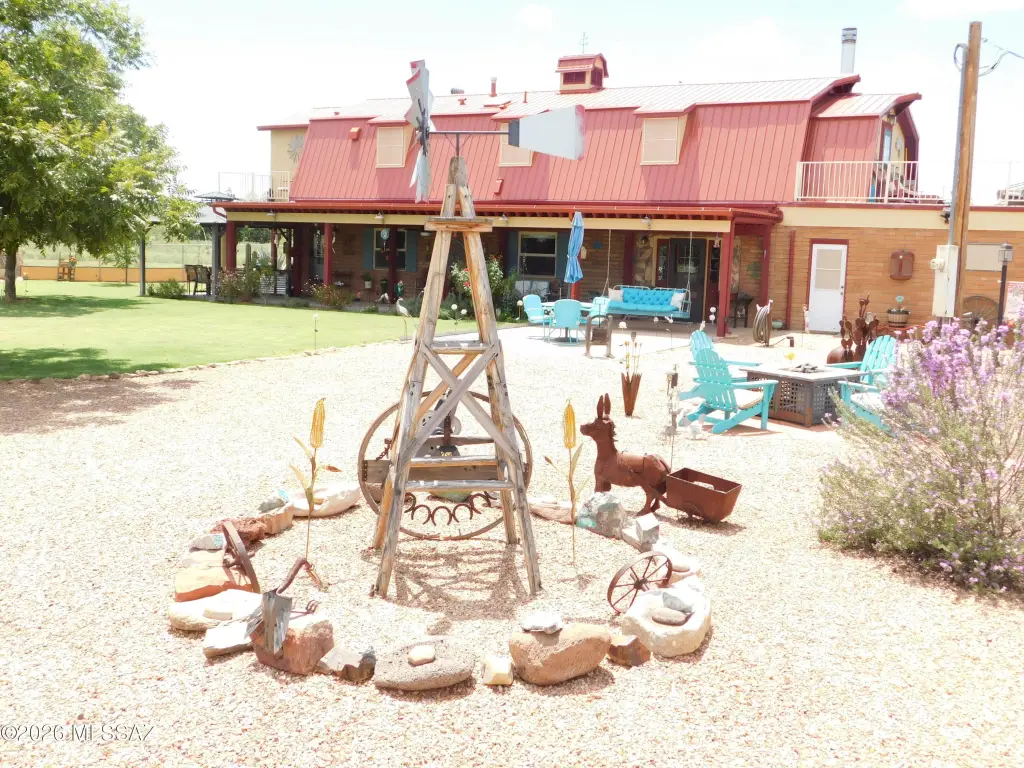
Decorative Gravel, Flower Beds, Shrubs, Sprinklers In Front, Dividable Lot
Elementary school
Greenway
Middle school
Lowell
High school
Bisbee
Elementary school district
Bisbee
Middle school district
Bisbee
High school district
Bisbee
Directions
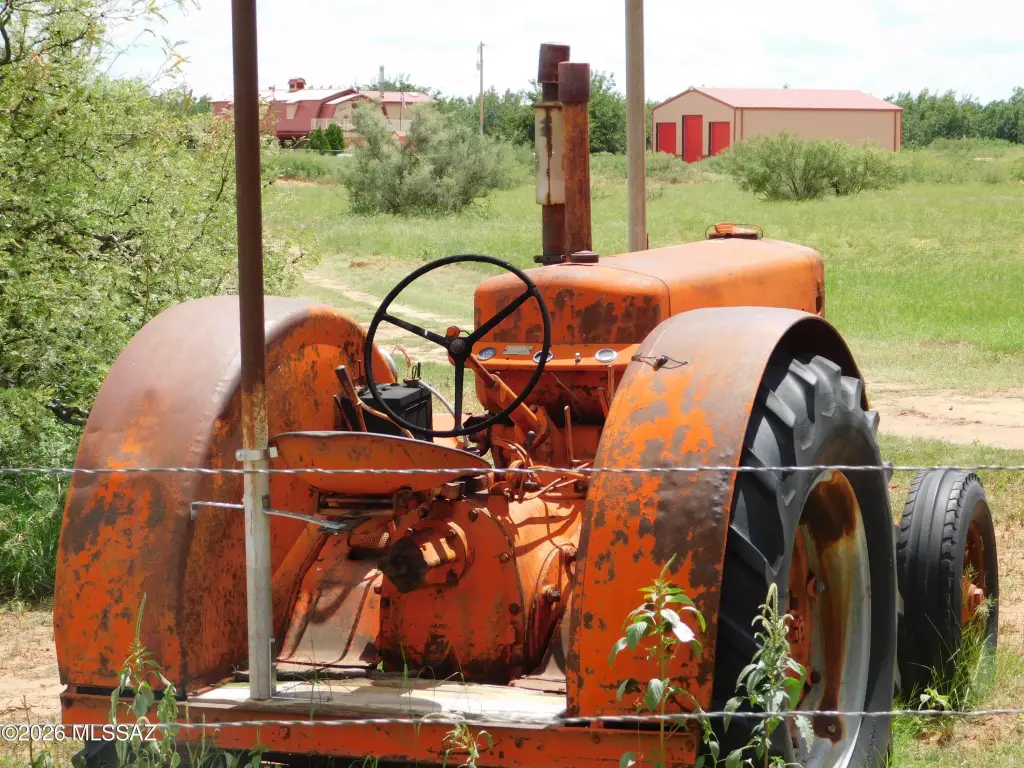
From Double Adobe Road, Go North on Frontier Road to Tumbleweed Lane*** NOT Tumbleweed Road***down to the end of Tumbleweed Turn Right-South at entrance with Orange Tractor and Ranch Sign ''Rocking E Hideout''
Subdivision
Cochise
Standard status
Active
APN
405070300
Size
4,700 SF
Lot size
20.00 Acres
Taxes and HOA fees
Tax Year
2025
Tax Description
E2SWSE SEC 6 22 26 20.00 AC
Legal Description
E2SWSE SEC 6 22 26 20.00 AC
Utilities
Sewer type
Septic Tank
Heating system
Electric (Heating), Zoned, Propane (Heating)
Cooling system
Zoned
Water source
Well
Amenities
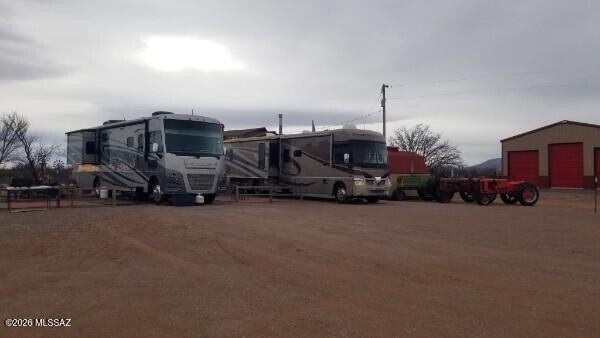
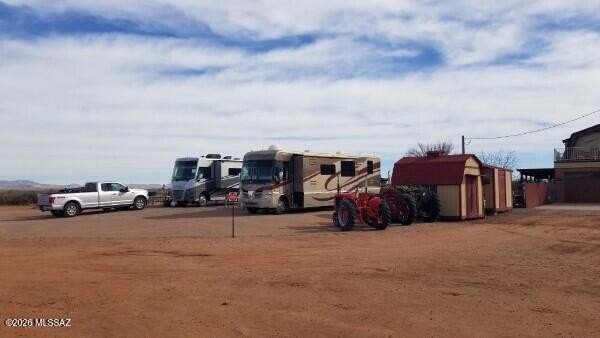
RV hookups
outdoor kitchen
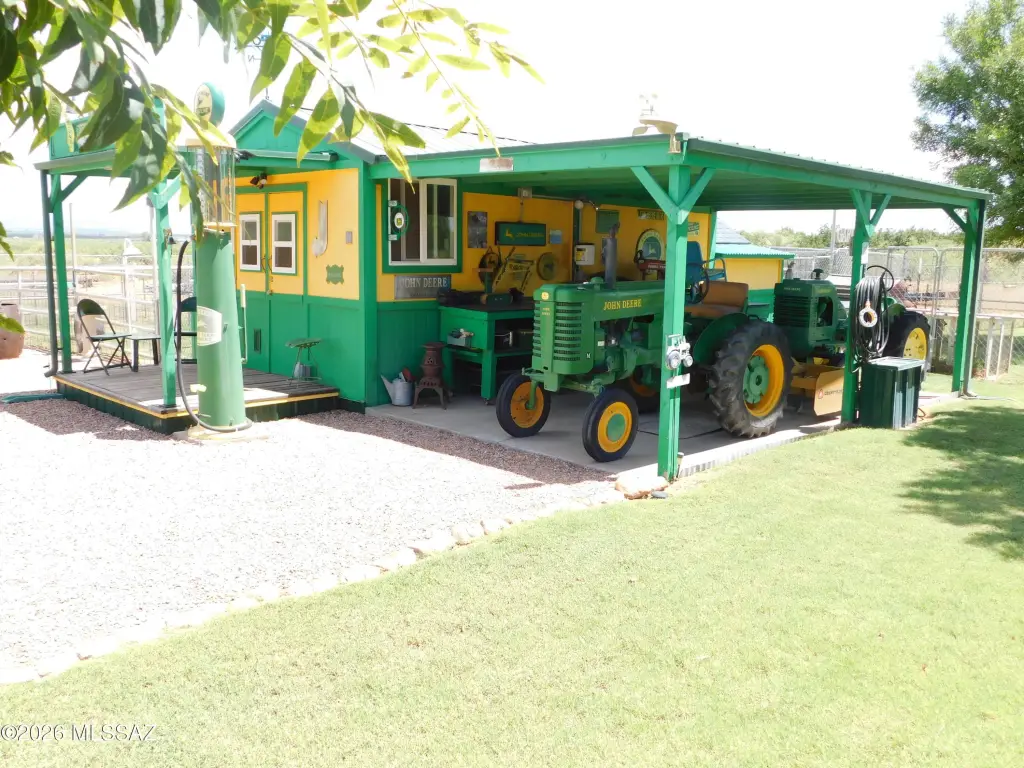
fruit trees
dog run
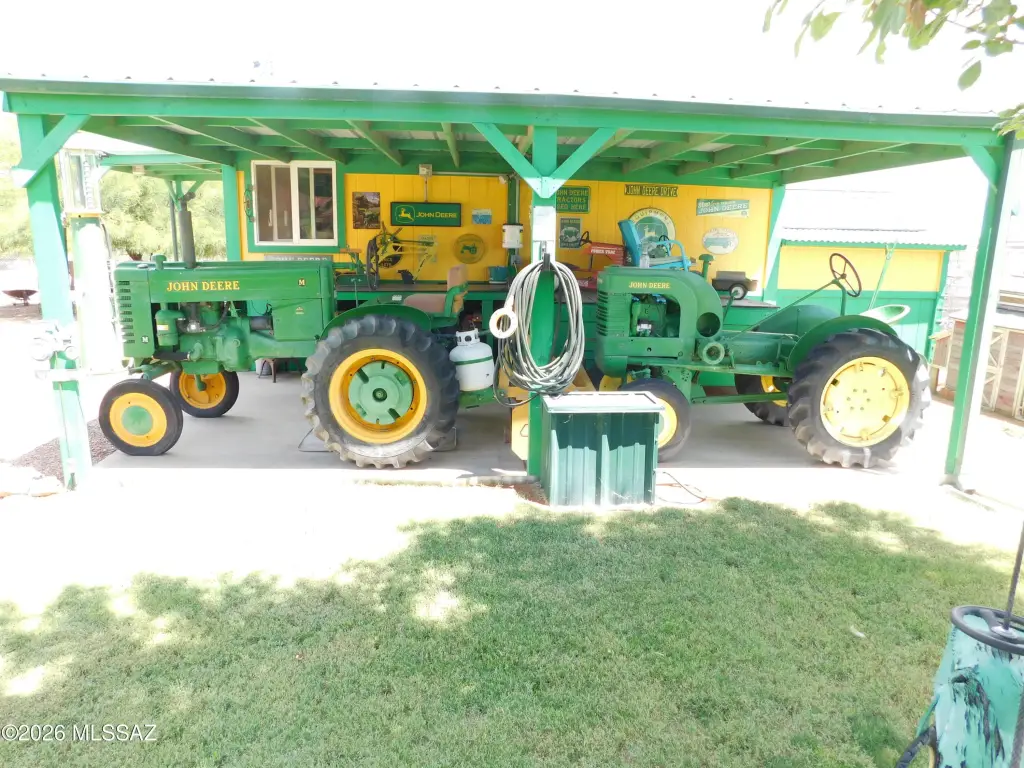
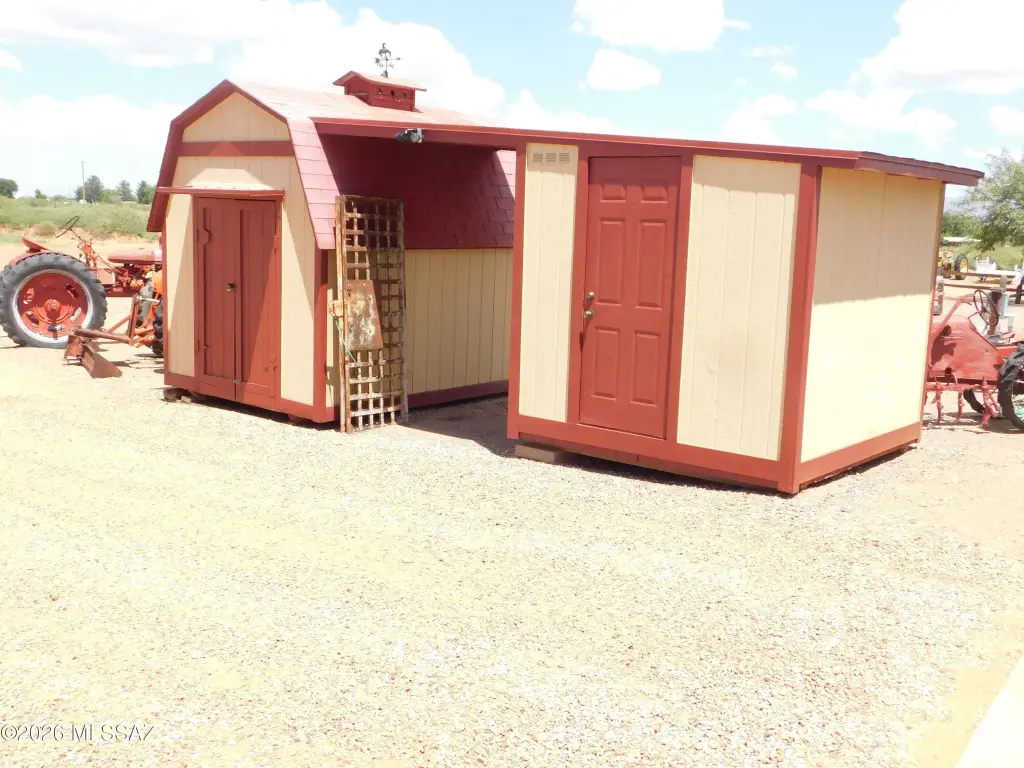
workshop
snake fencing
Building Details
Year built
1995
Number of units
2
Flooring type
Wood, Carpet, Tile
Building materials
Frame
Roof type
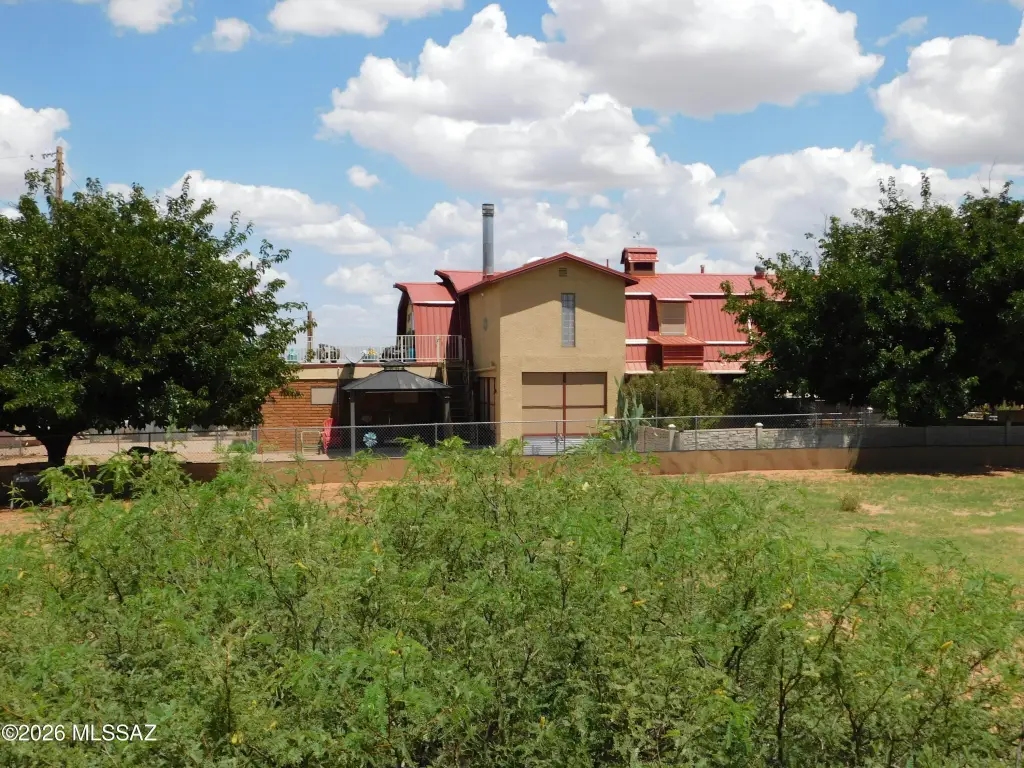
Metal
Architectural style
Ranch
Additional Structures
Greenhouse
Listing Agency:
Pepper Realty
Listed By:
Paula J Sindelar
(520) 360-8593
Added: Aug 20
Changed: Oct 15
Last Checked: Oct 23 at 6:06AM
MLS# 22620466
Copyright © 2026 Multiple Listing Service of Southern Arizona. All rights reserved. All information provided by the listing agent/broker is deemed reliable but is not guaranteed and should be independently verified.

Ask AI about this property
Review the available facts, identify missing information and prepare questions for the agent.
Investment Insights
Based on property information with market context.
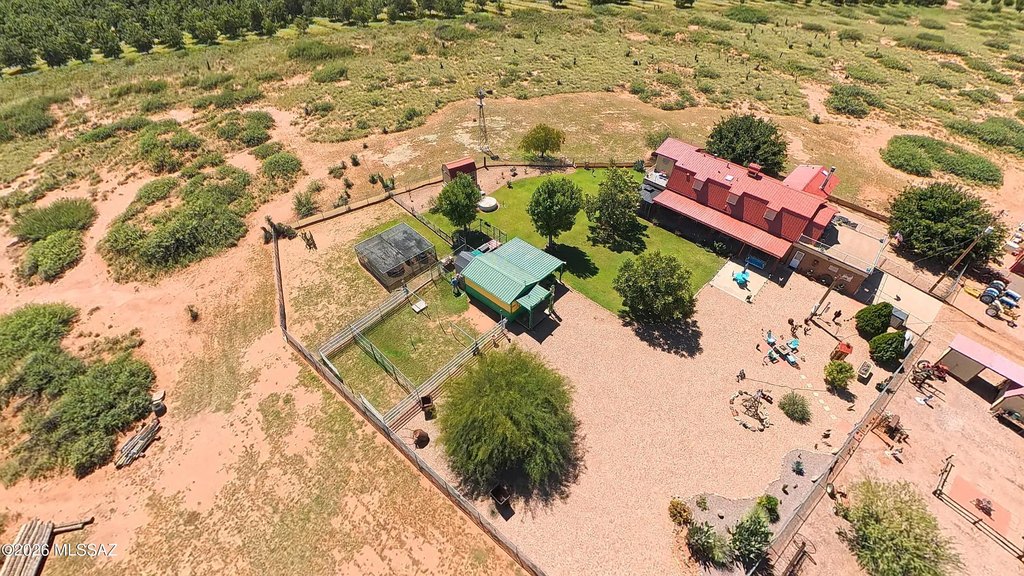
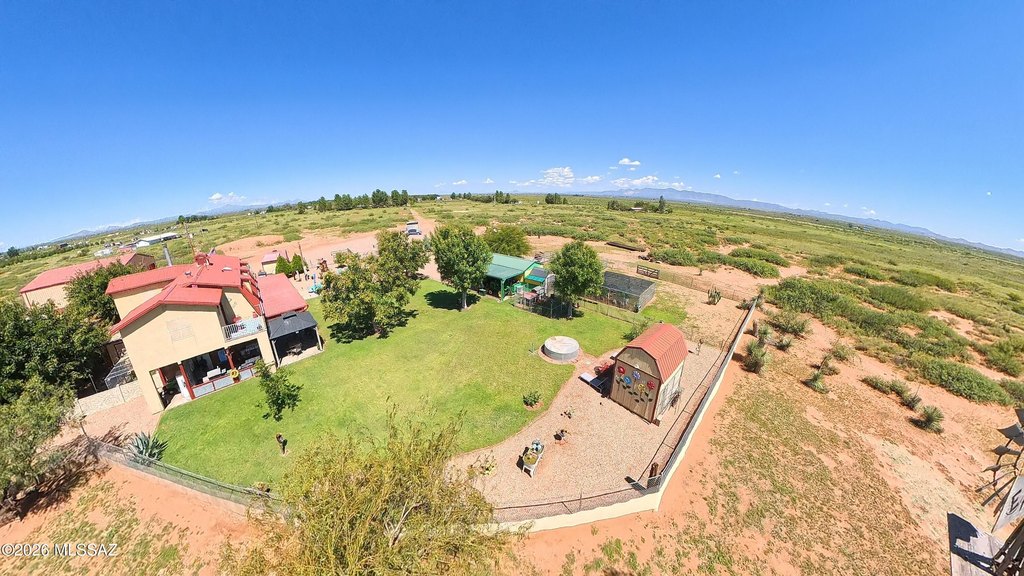
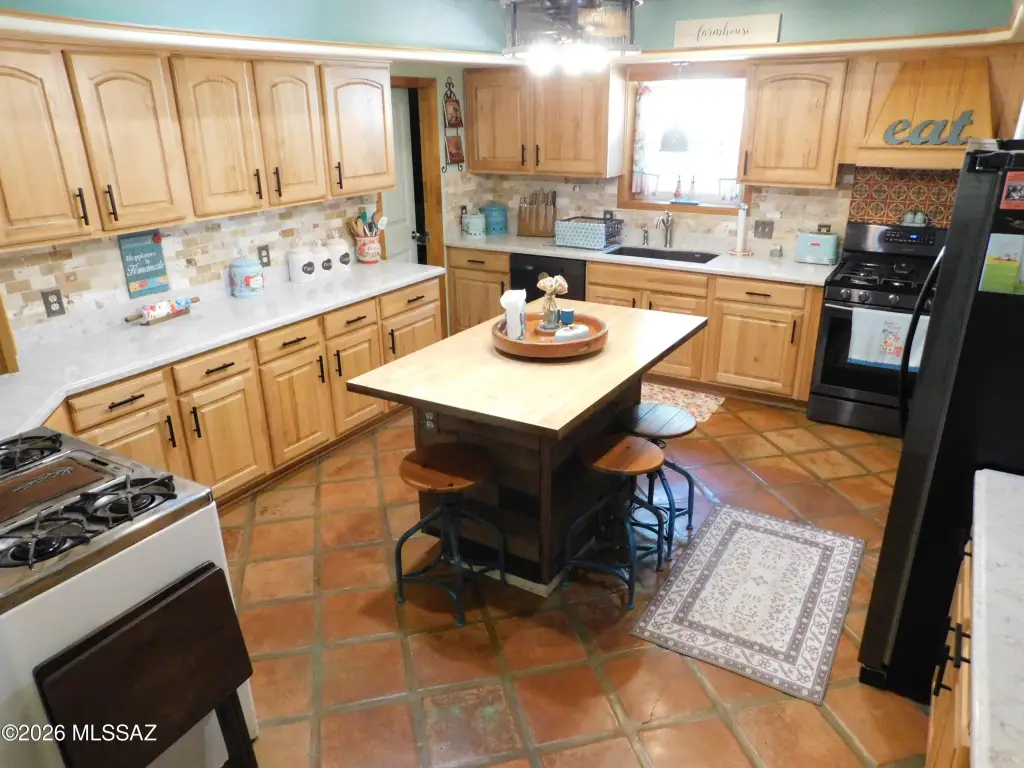
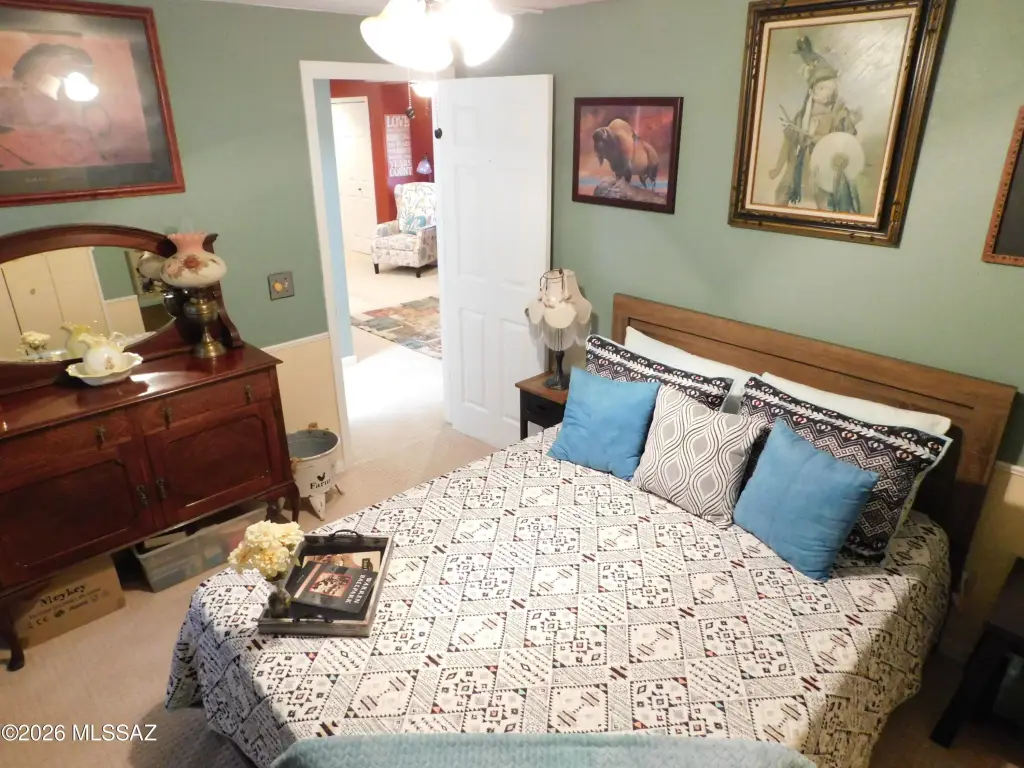
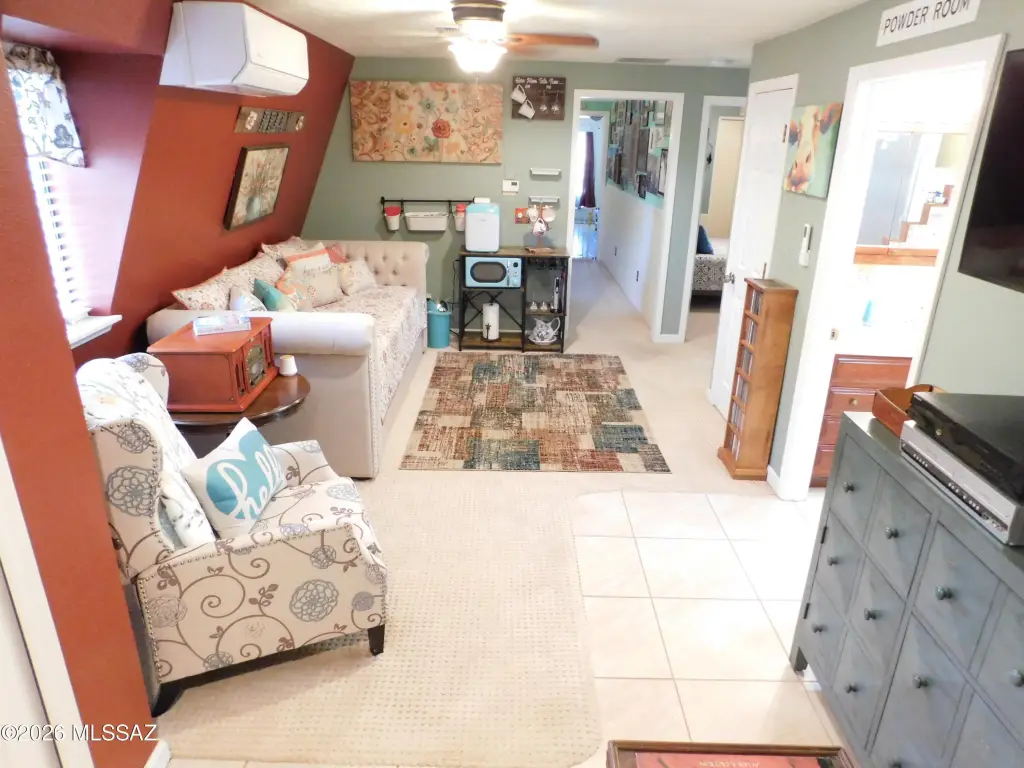
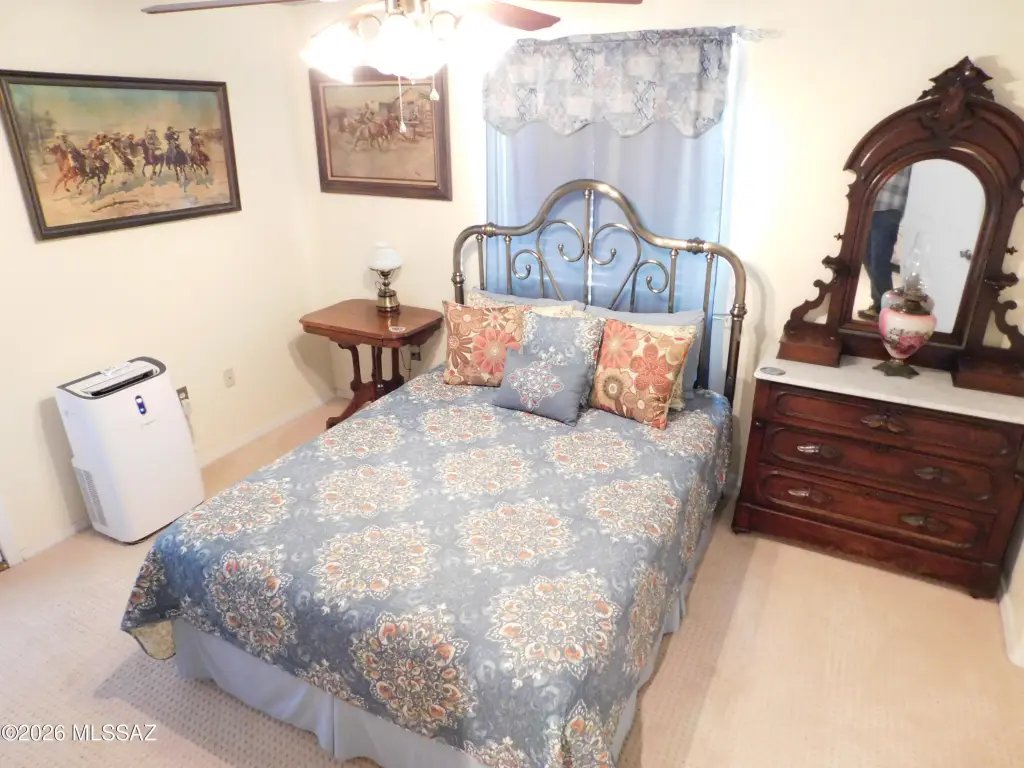
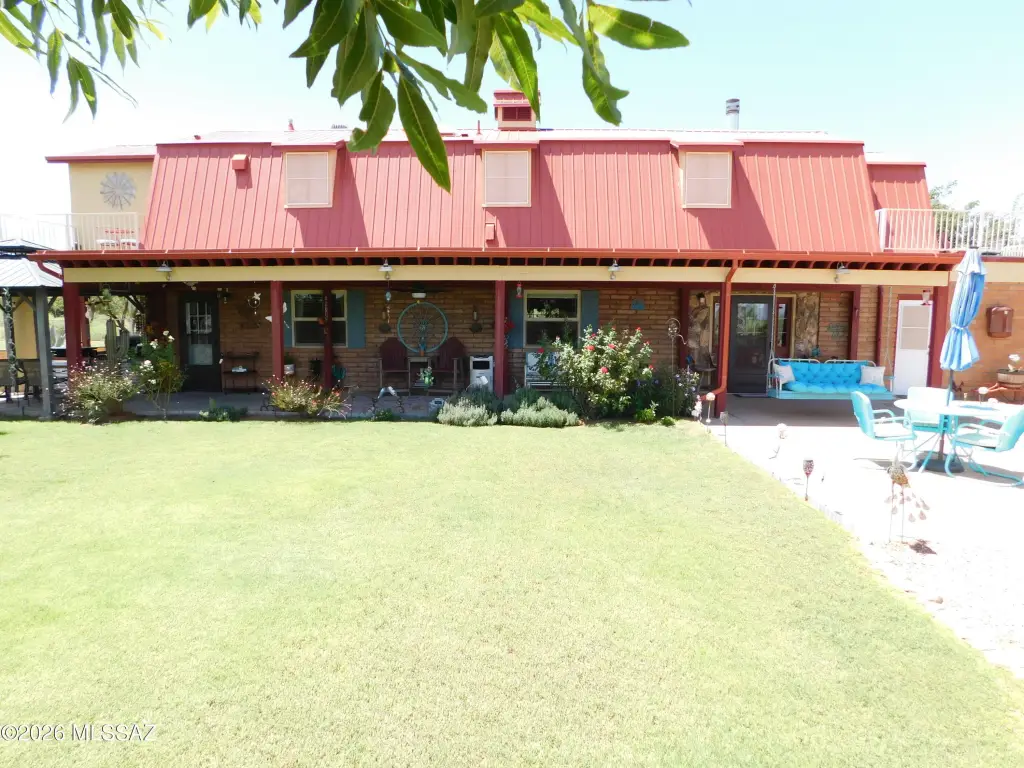
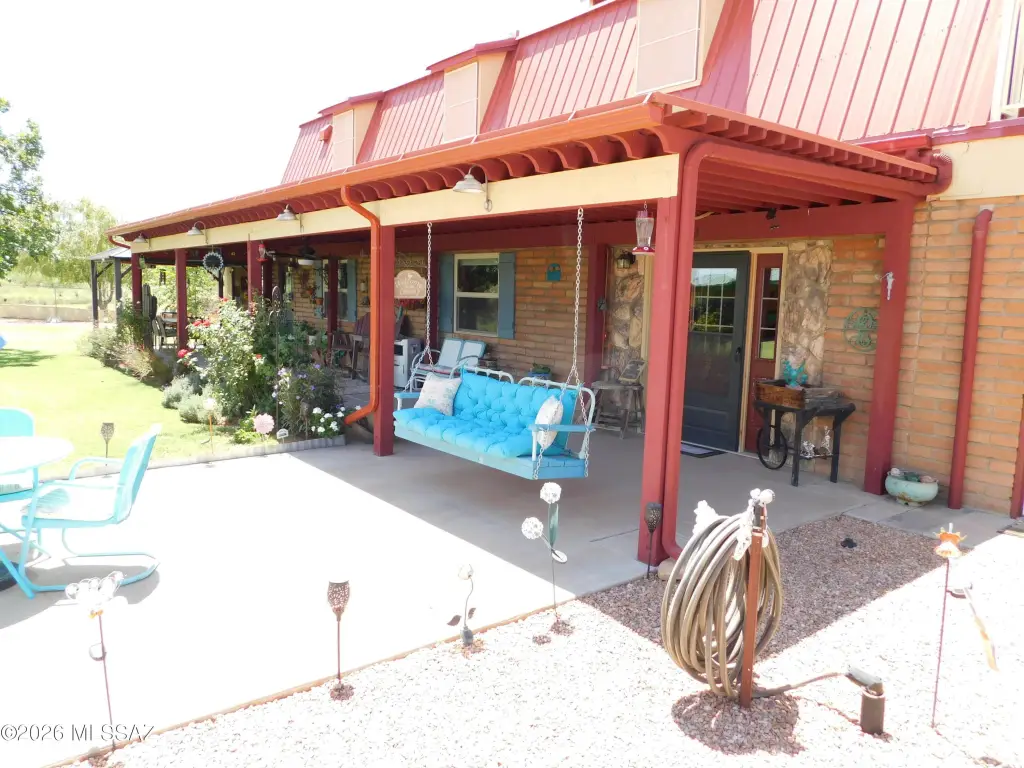
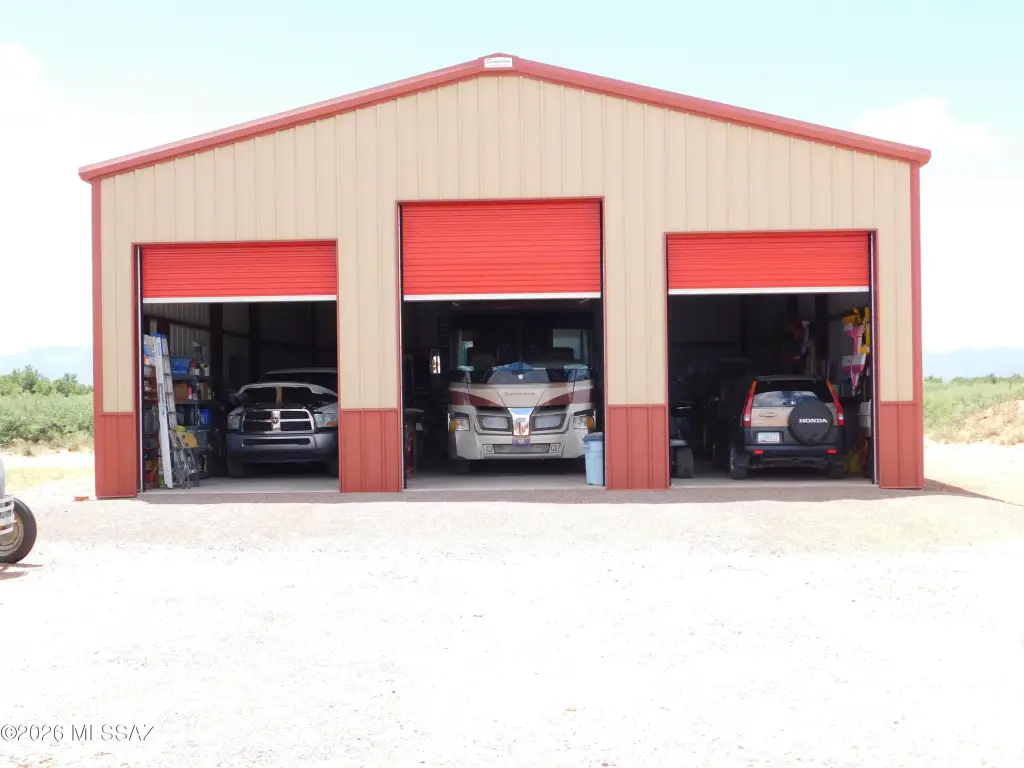
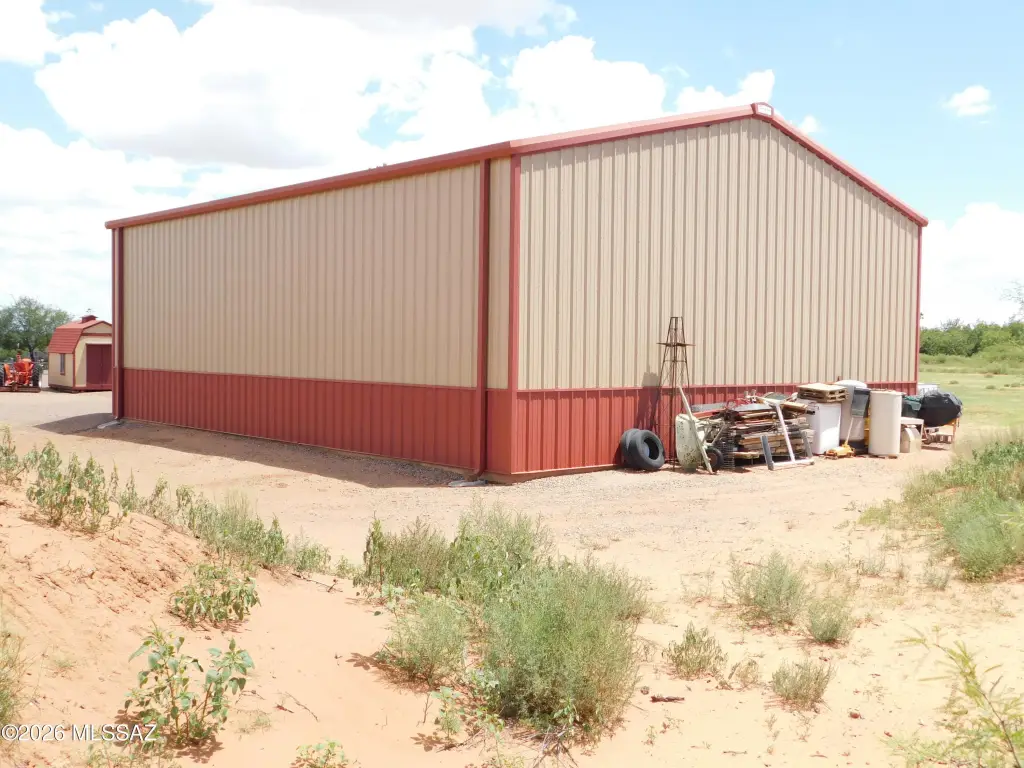
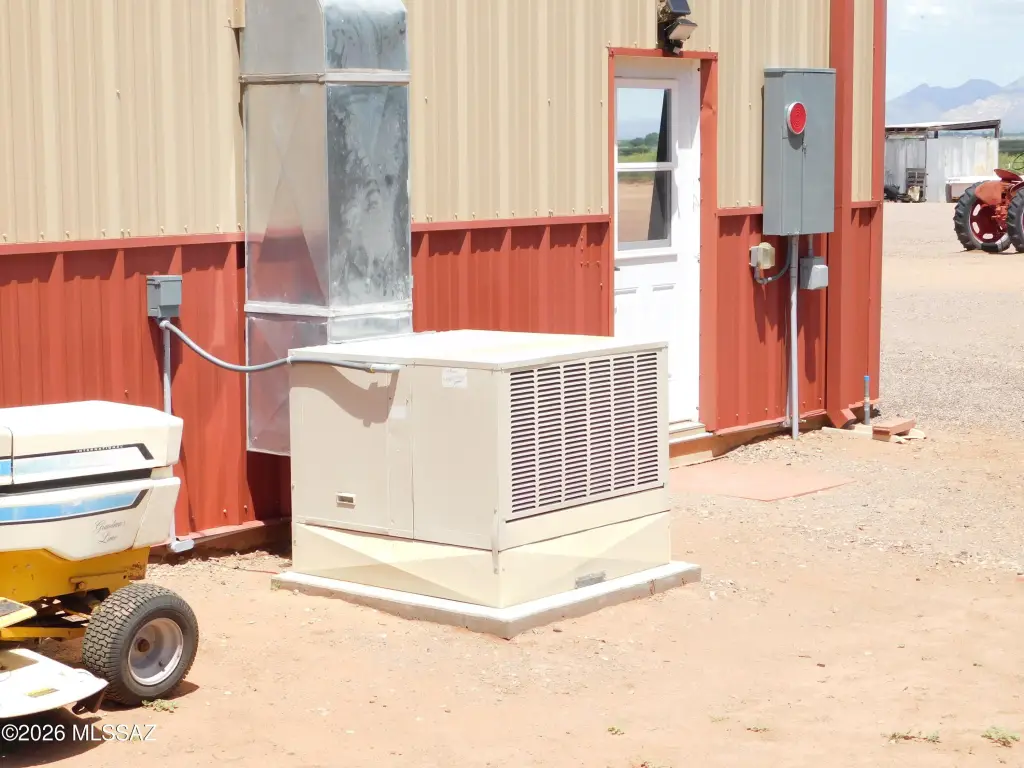
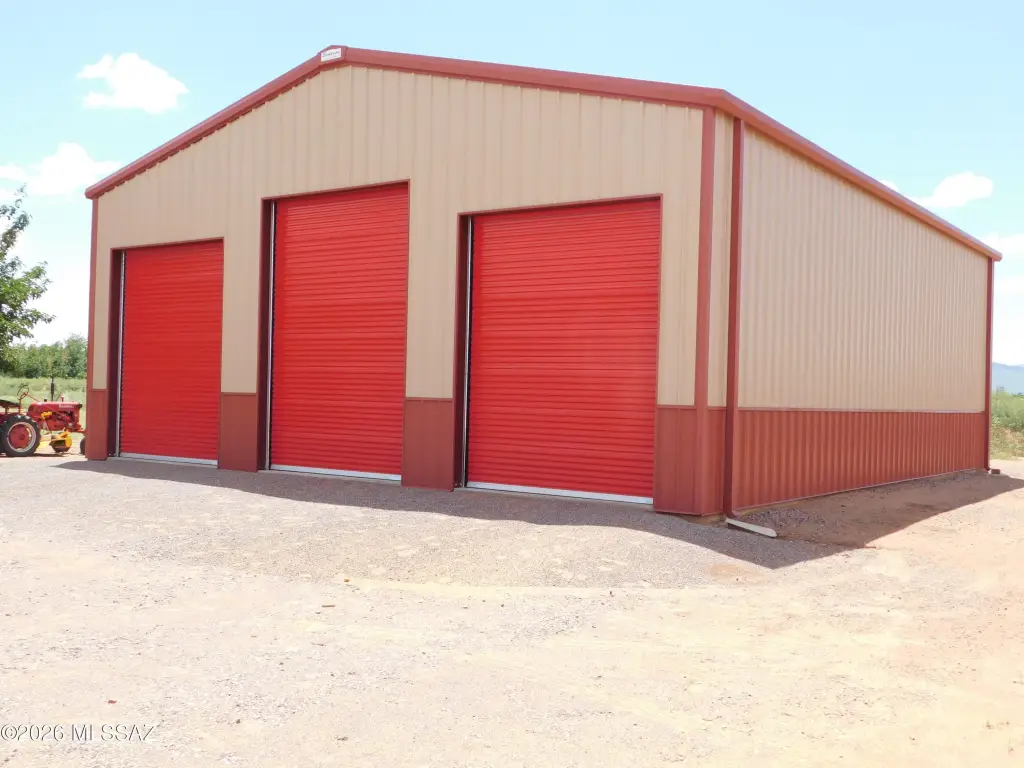
Set on 20 acres in Mc Neal, this ranch-style property combines a 2,700-square-foot main residence with a separate 2,000-square-foot heated and cooled building. The secondary structure has water and electricity and offers a flexible layout for guest accommodations, an apartment, or a duplex conversion. A tandem garage and hangar provides nine spaces, with capacity for vehicles or large recreational equipment, while three full RV hookups add additional utility.
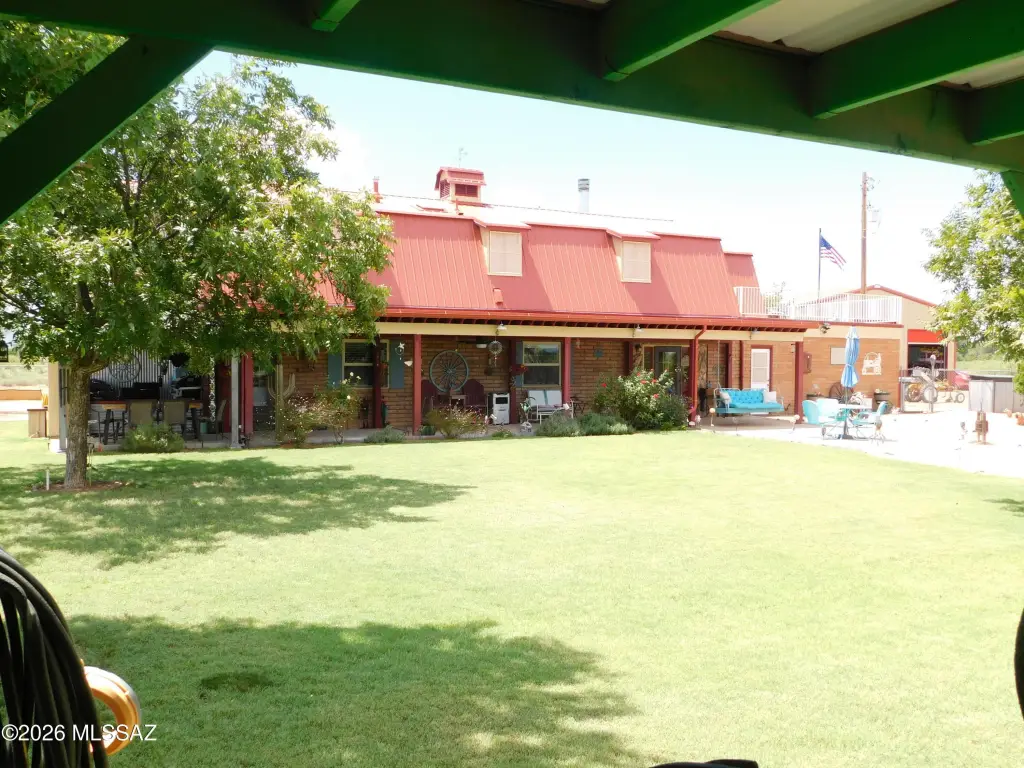
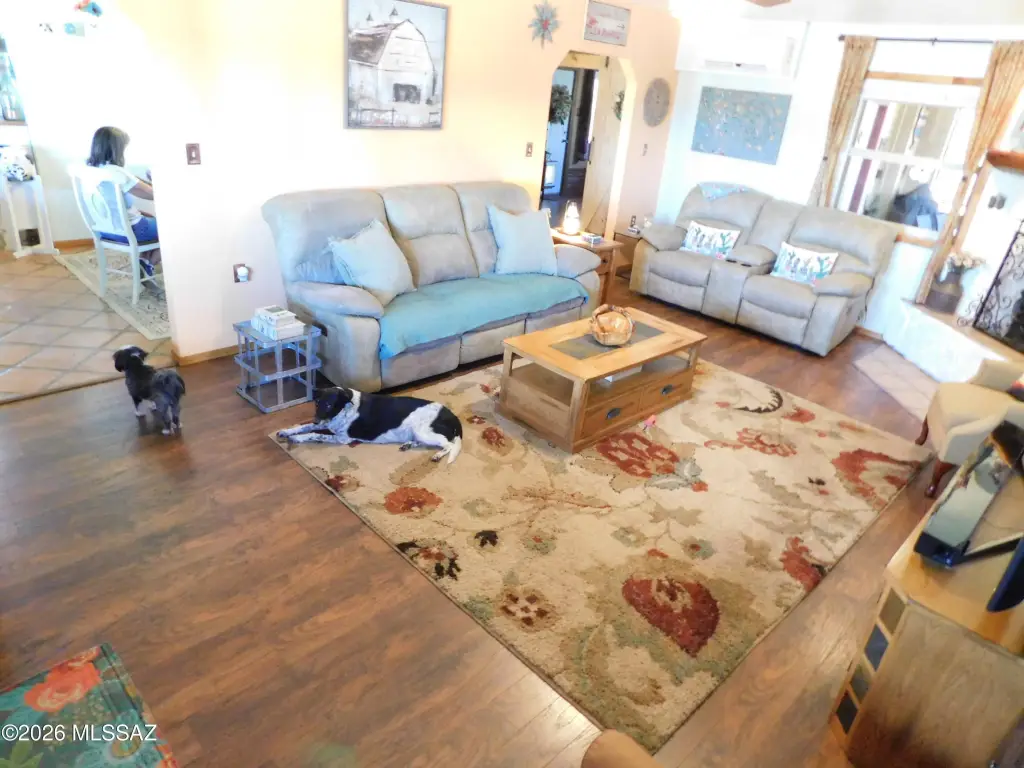
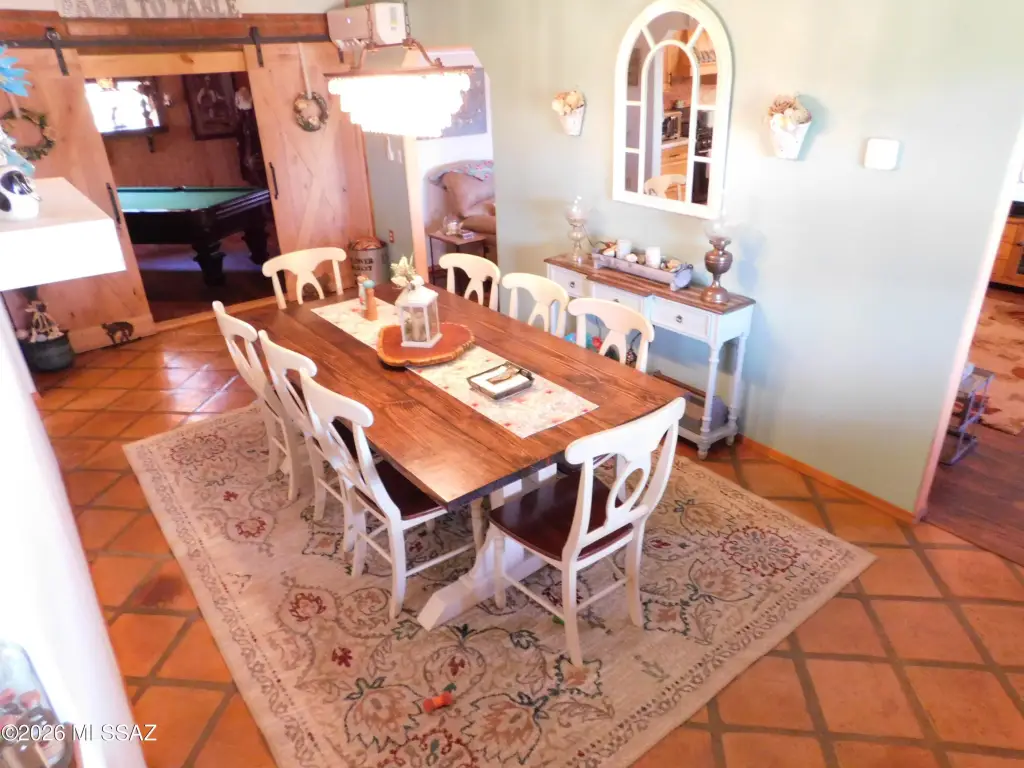
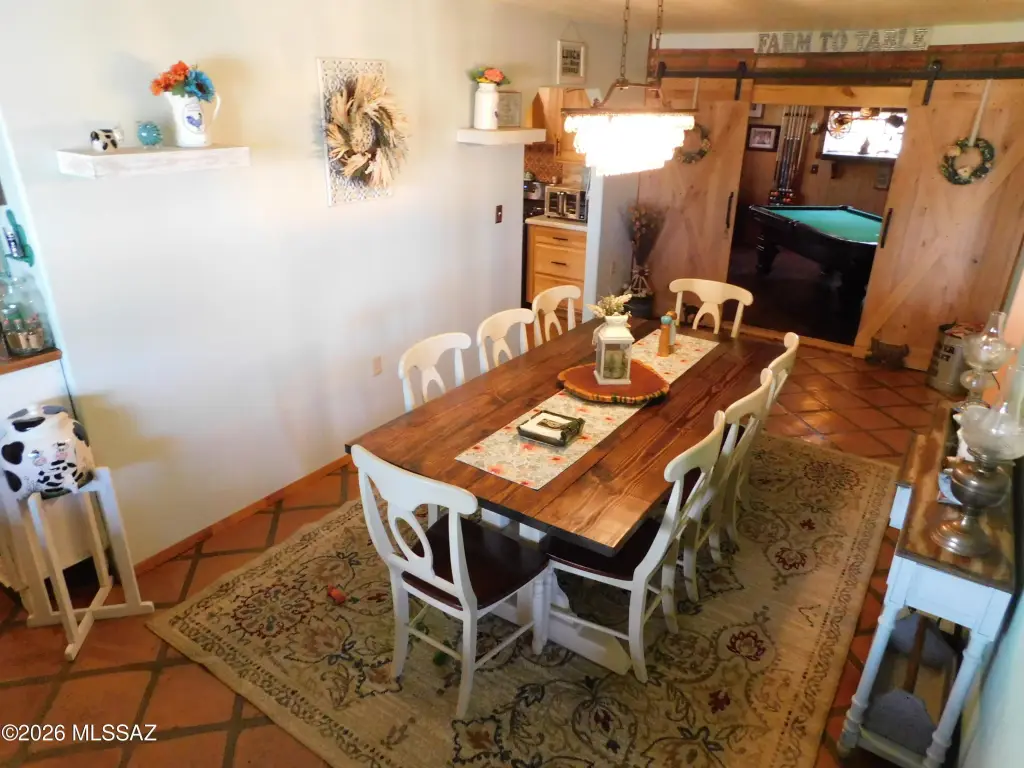
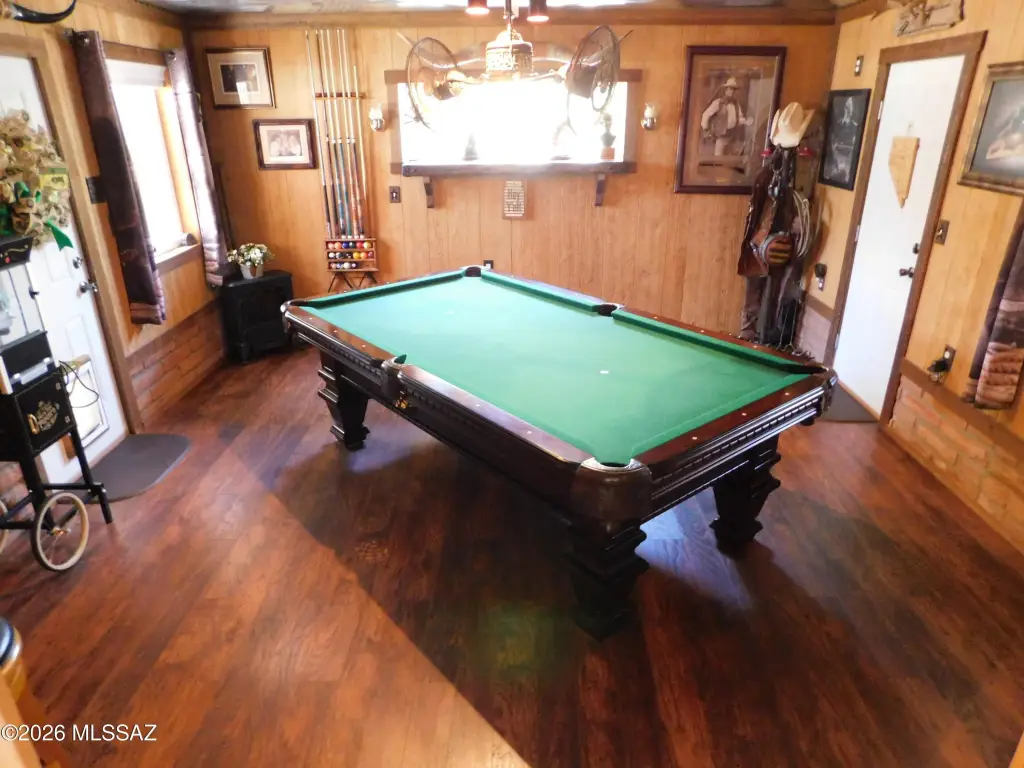
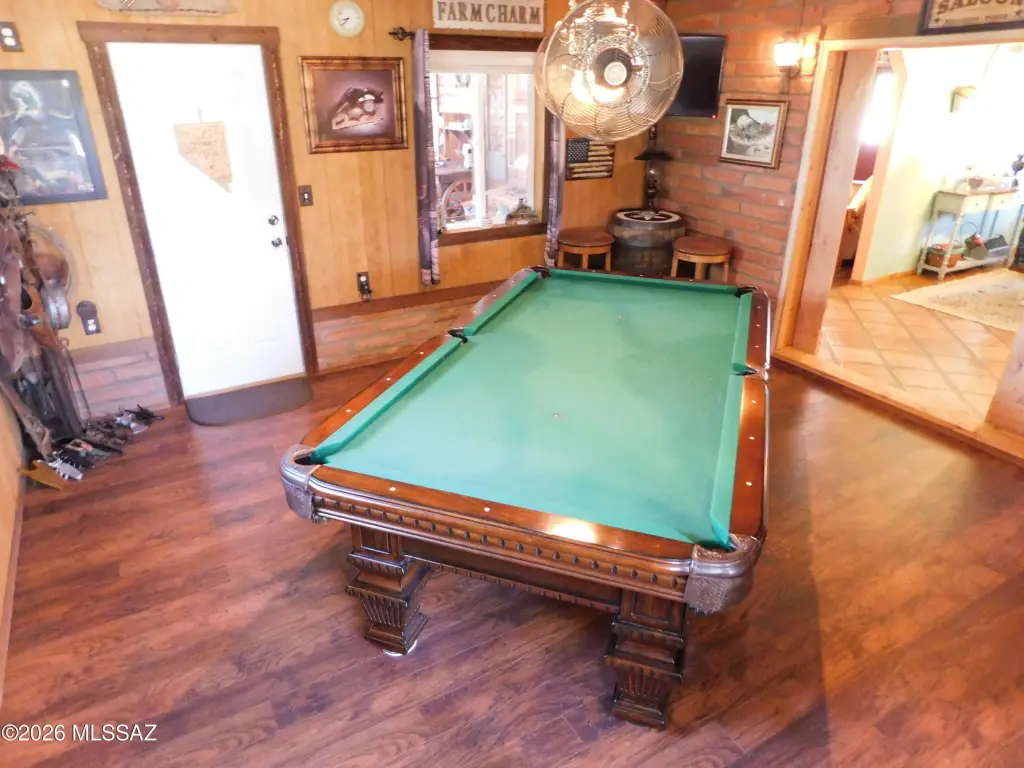
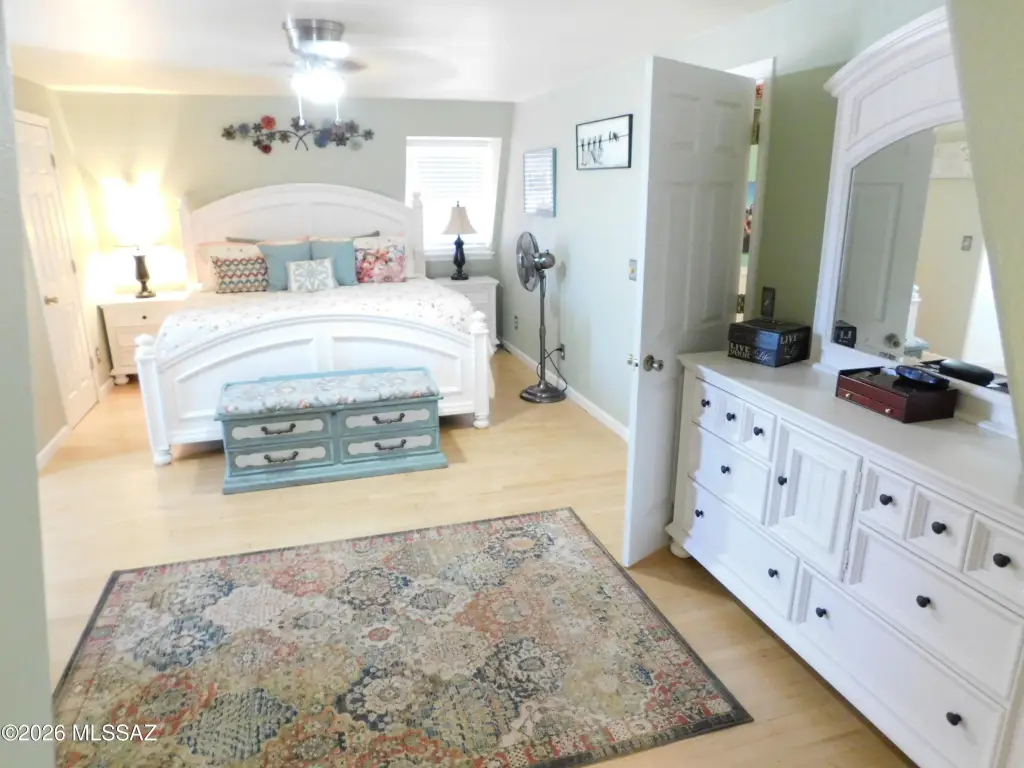
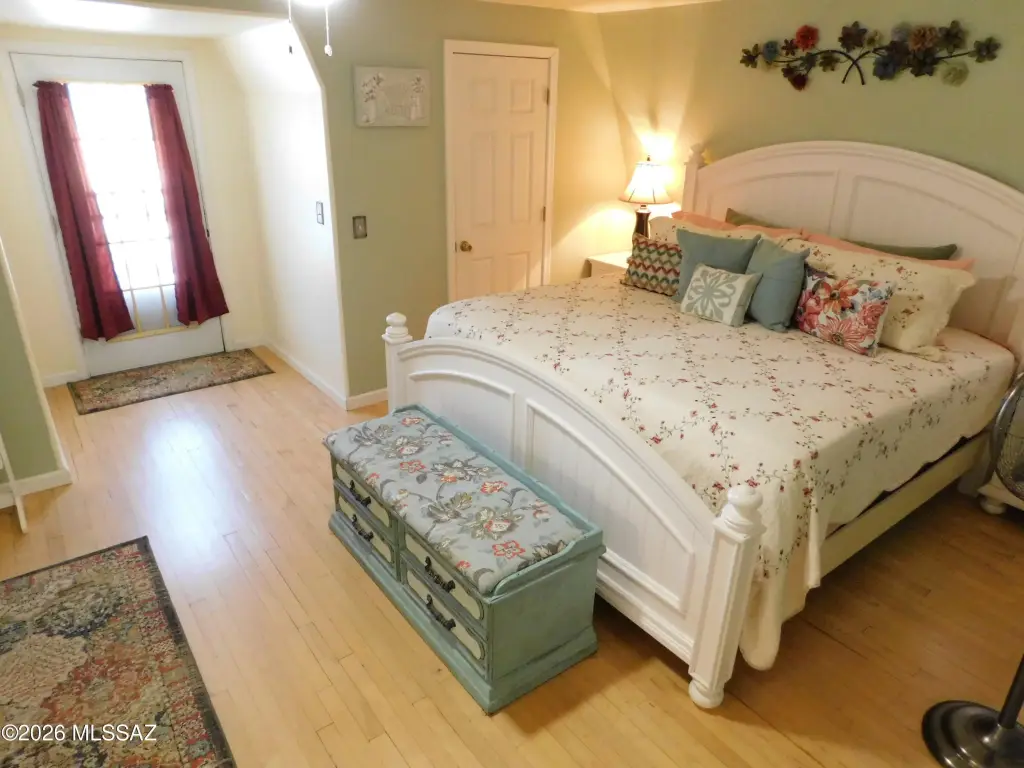
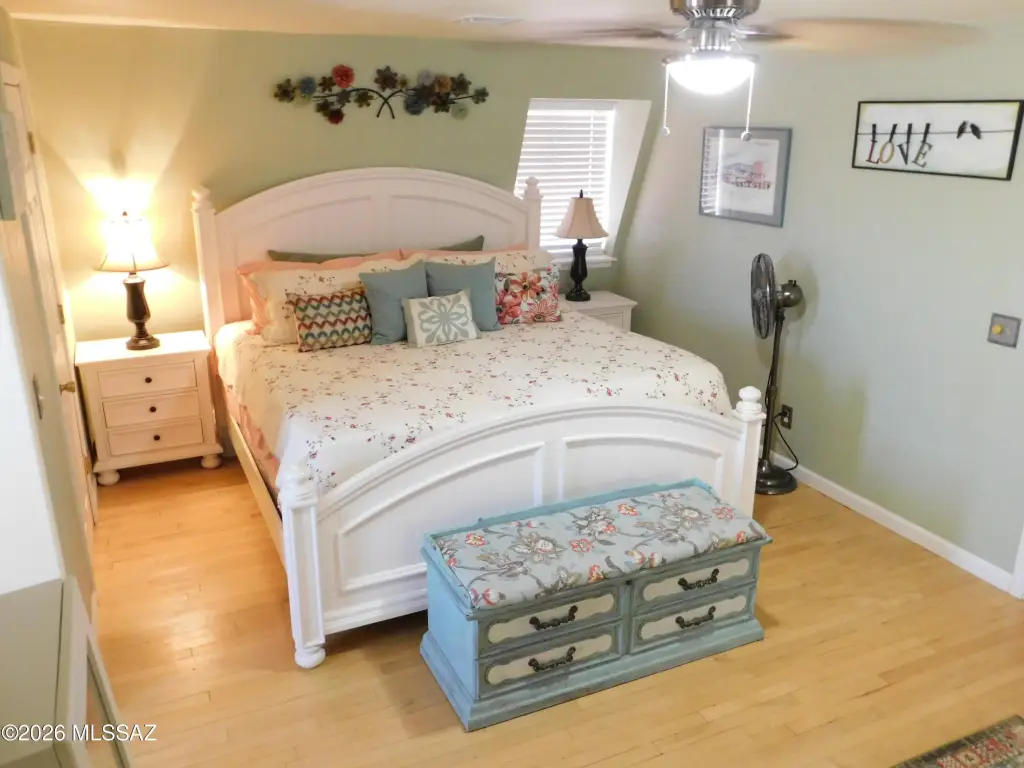
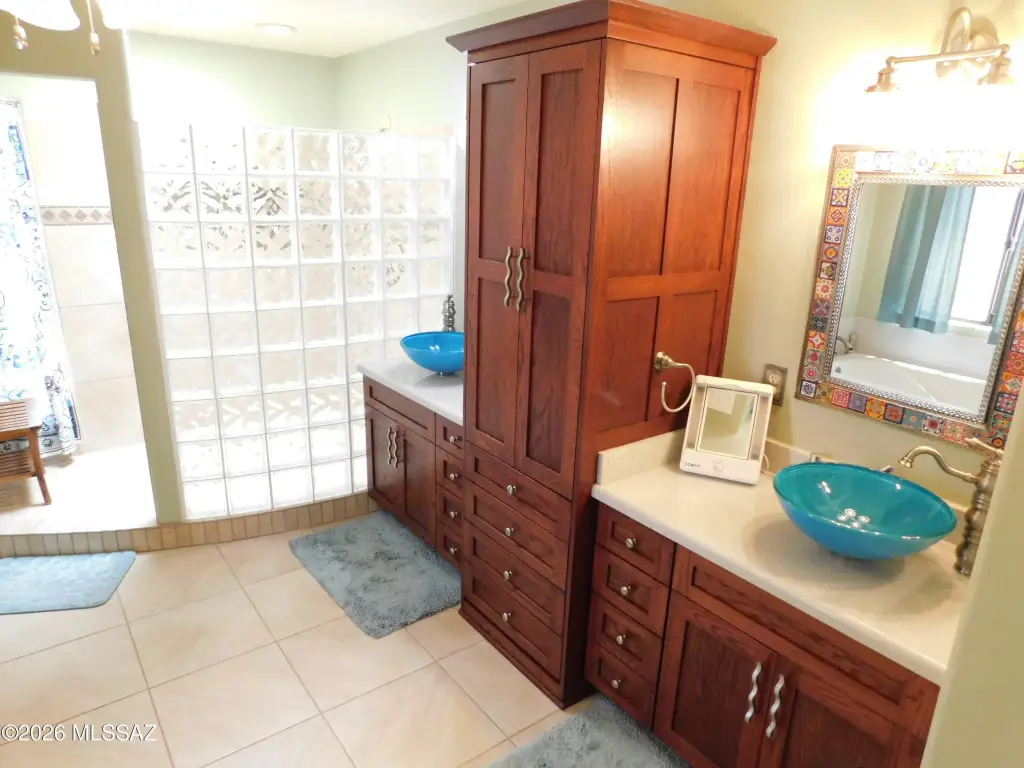
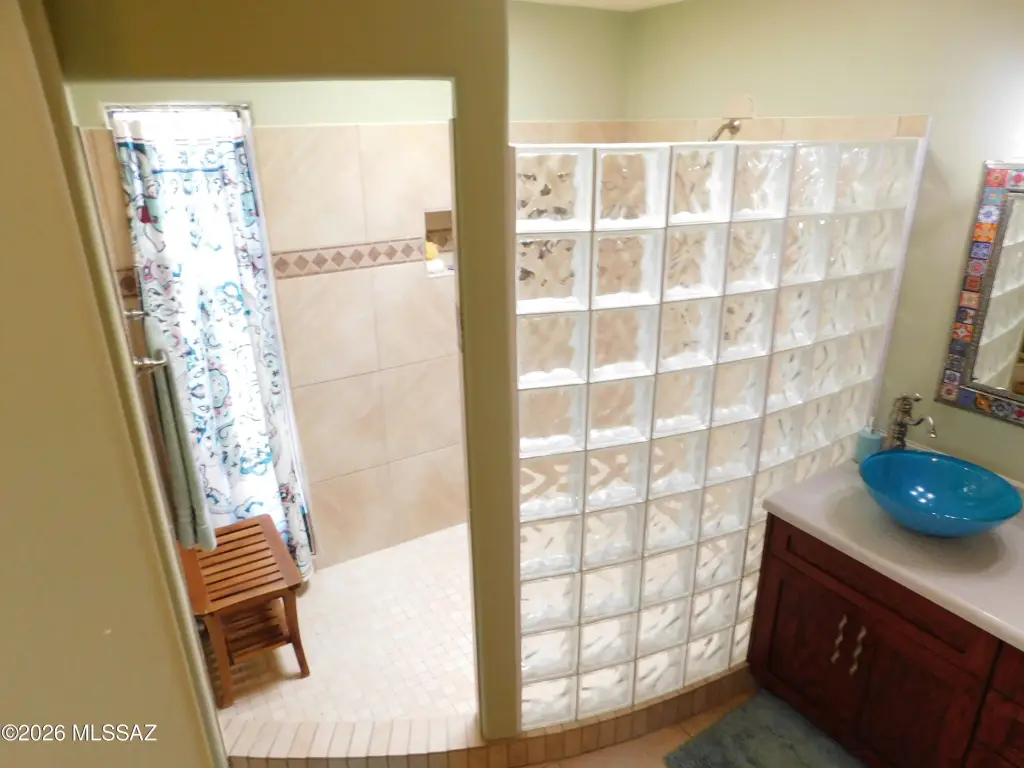
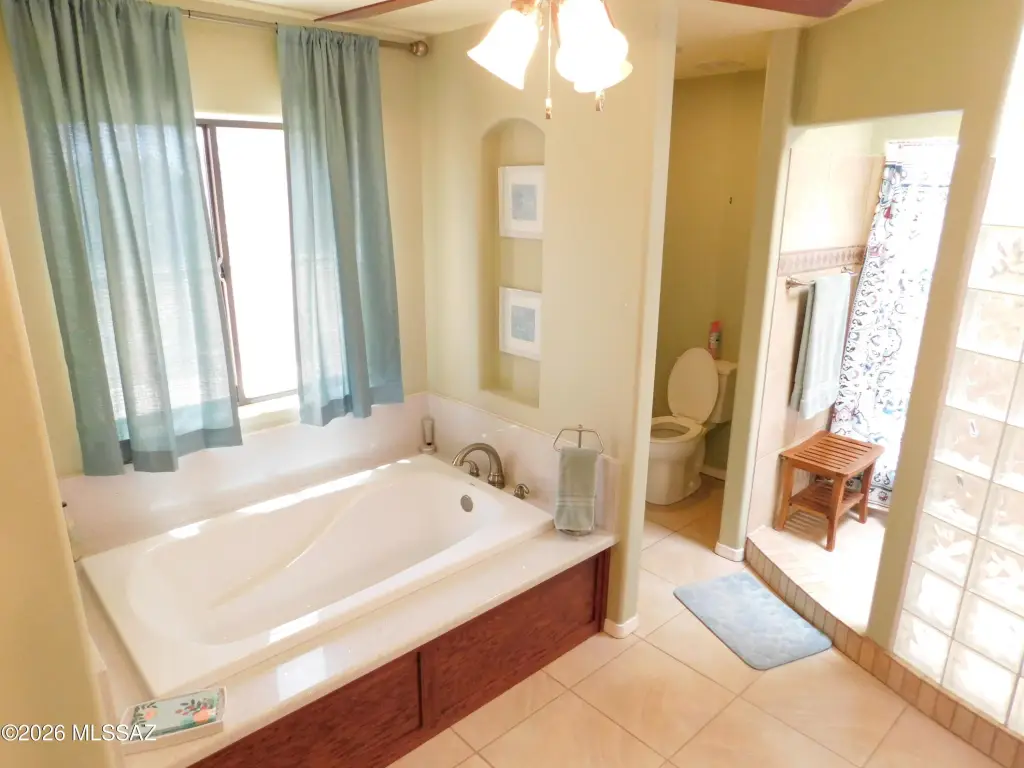
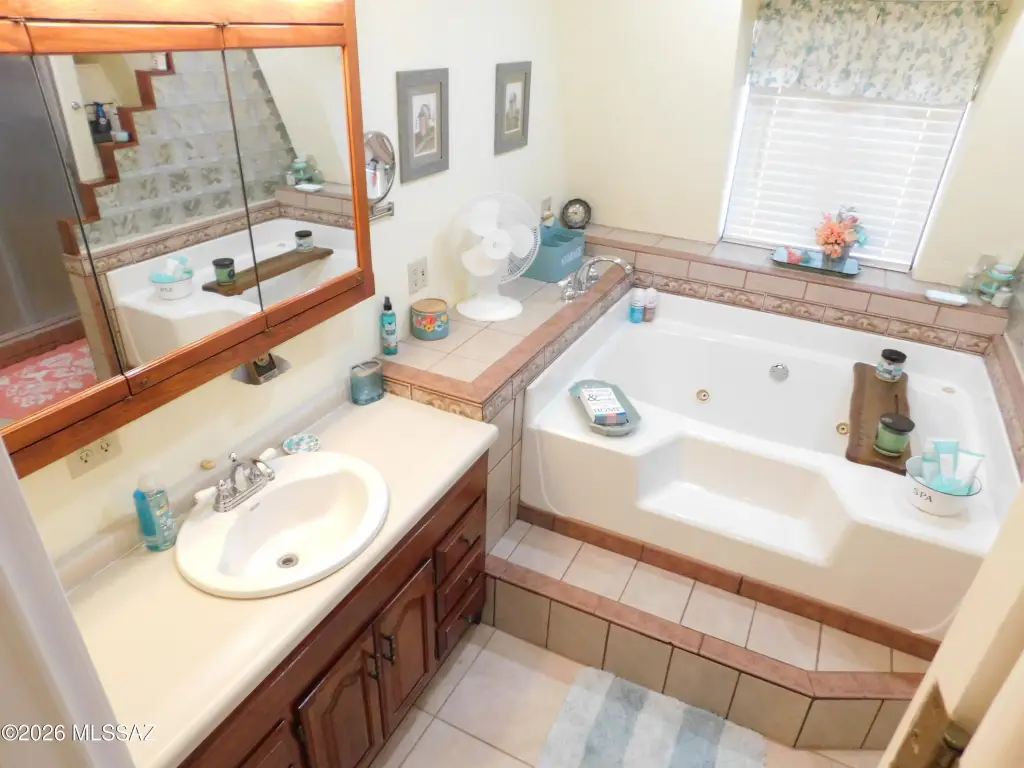
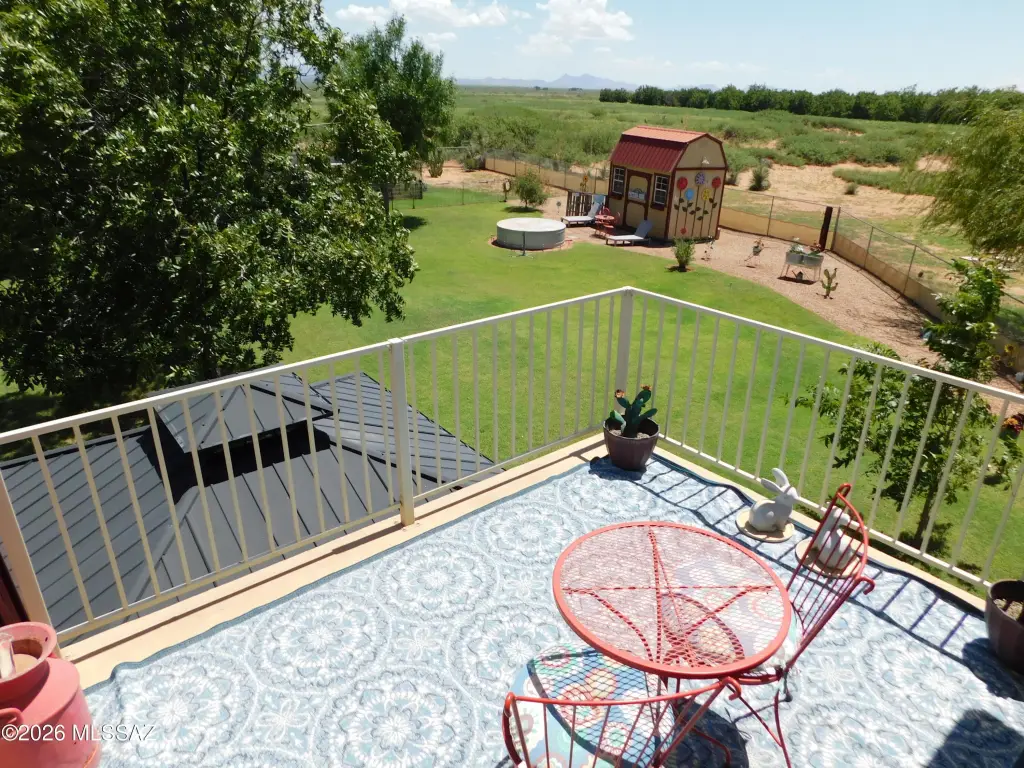
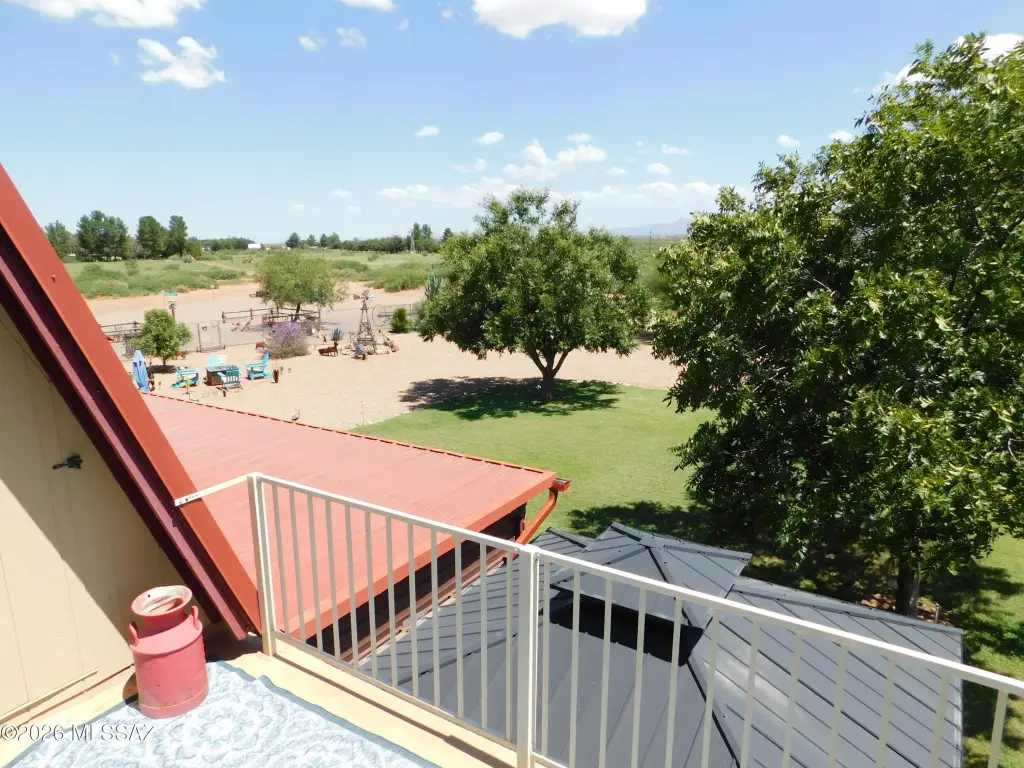
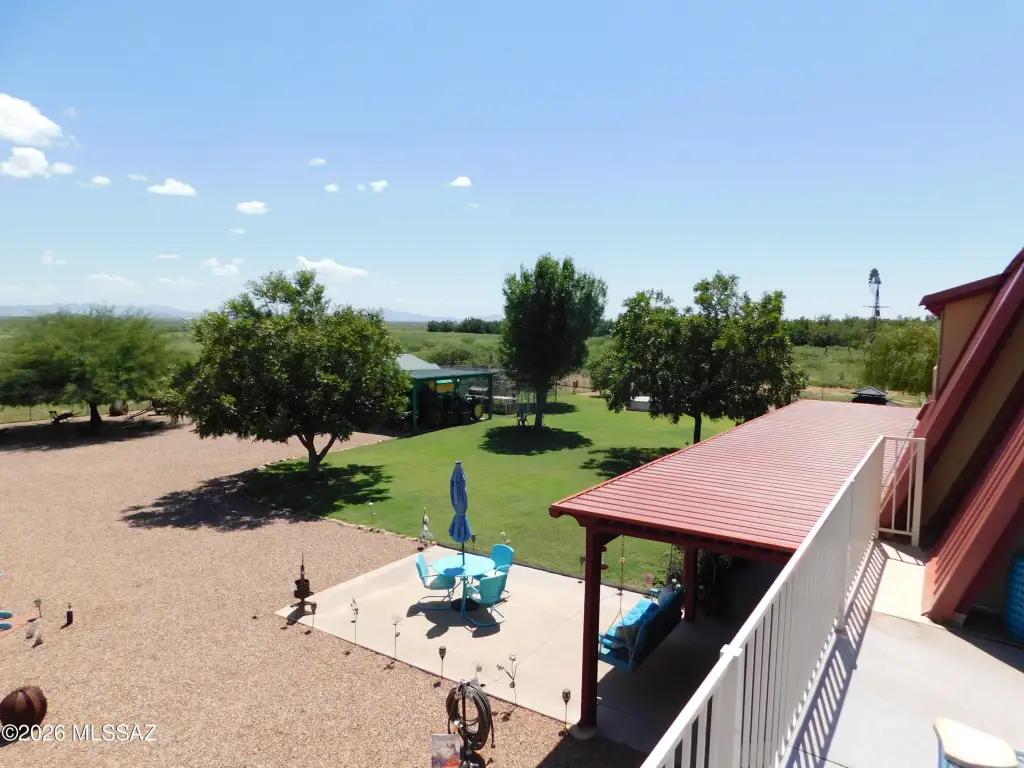
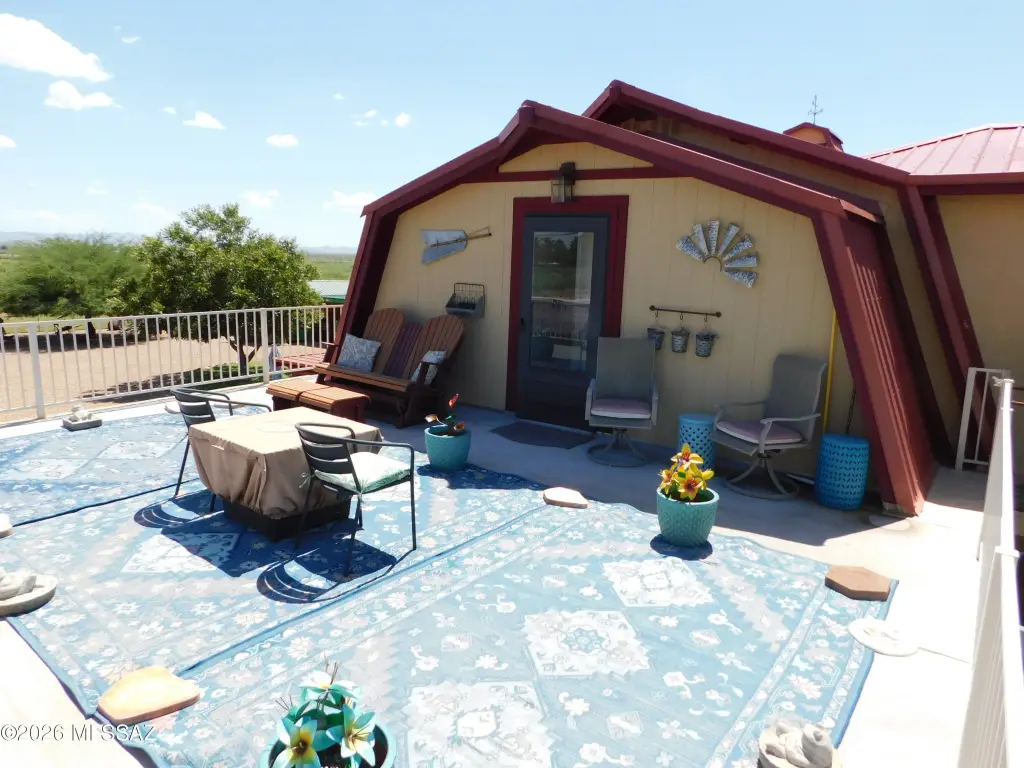
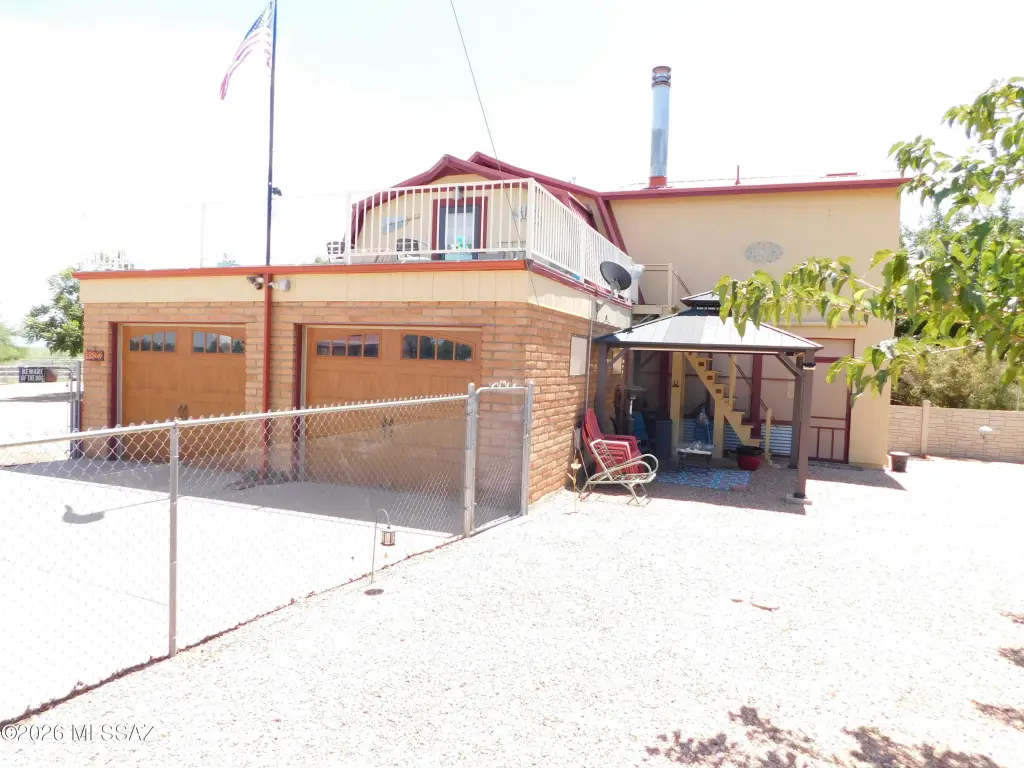
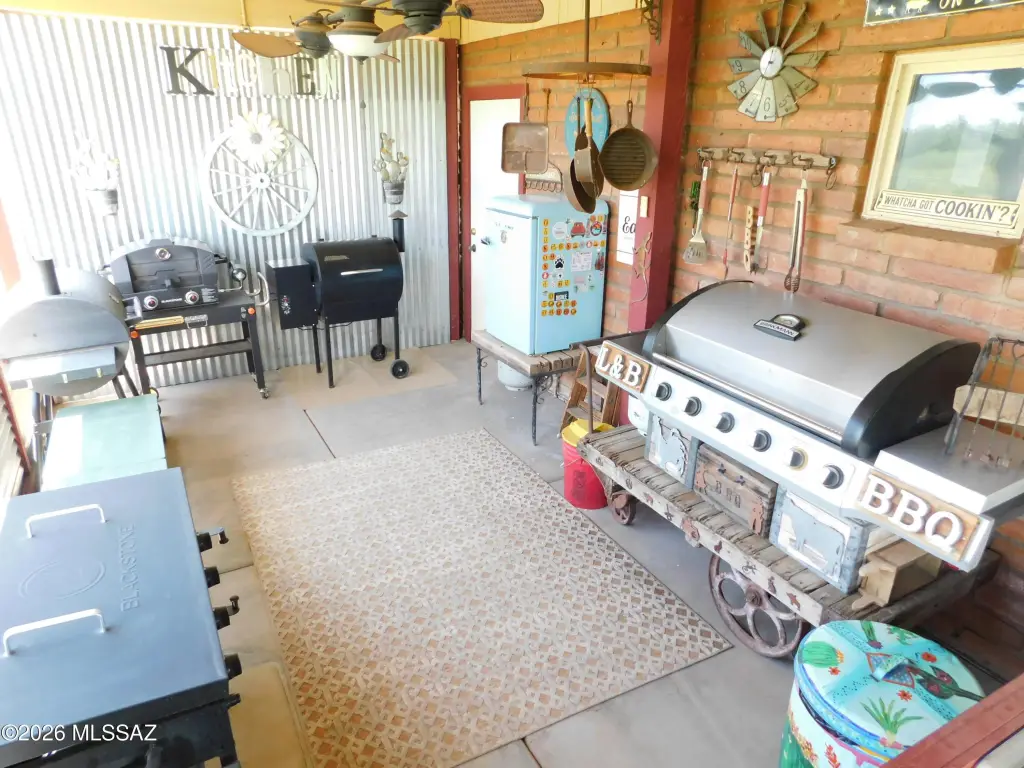
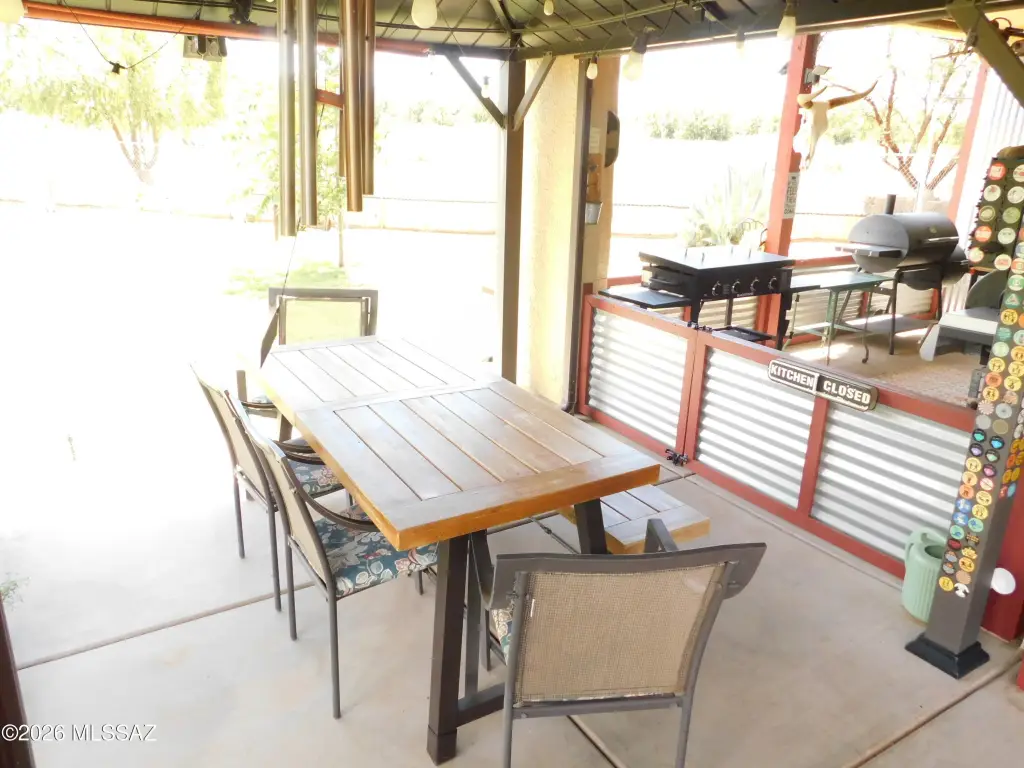
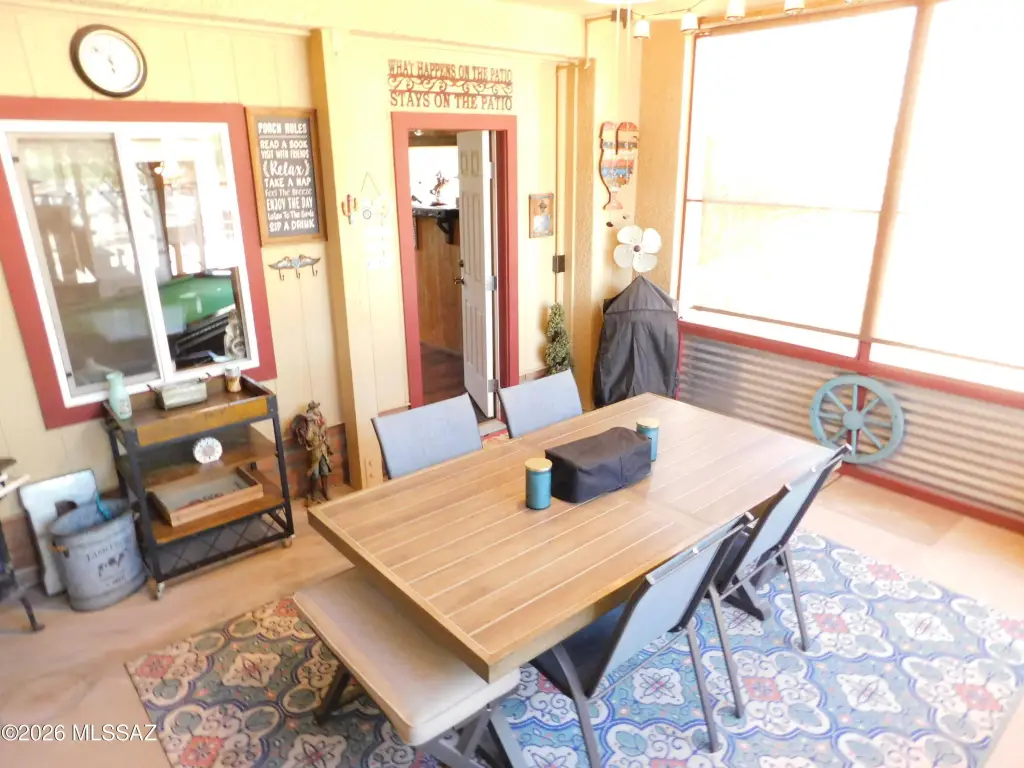
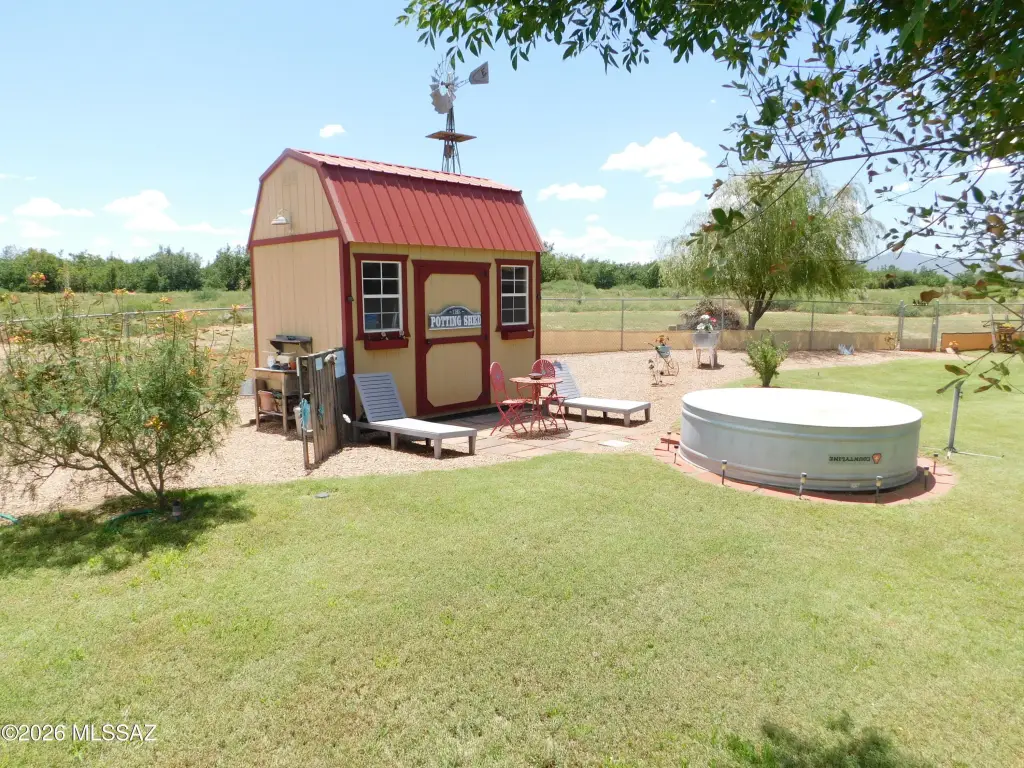
The two-story home includes three bedrooms, two and one-half baths, a gourmet kitchen, dining and family rooms, a media and pool-table room, enclosed patio, balcony, and outdoor kitchen. Property improvements include a 2023 metal roof, four mini-split systems, a private well, septic tank, chain-link fencing, a dog run, fruit trees, lawns with timed drip irrigation, and a courtyard workshop. The property is located at 4823 W Tumbleweed Lane in Mc Neal, Arizona, within Cochise County.
The two-story home includes three bedrooms, two and one-half baths, a gourmet kitchen, dining and family rooms, a media and pool-table room, enclosed patio, balcony, and outdoor kitchen. Property improvements include a 2023 metal roof, four mini-split systems, a private well, septic tank, chain-link fencing, a dog run, fruit trees, lawns with timed drip irrigation, and a courtyard workshop. The property is located at 4823 W Tumbleweed Lane in Mc Neal, Arizona, within Cochise County.
Key Highlights
- 20‑acre ranch property in Mc Neal, AZ
- 2,700‑square‑foot main home paired with a 2,000‑square‑foot heated and cooled building
- Secondary building has water and electricity for guesthouse, apartment, or duplex conversion
Financial Insights
Estimated NOI and Cap Rate
NOI / Yr
$24,559
Cap Rate
3.51%
Suggested Prices Based on Cap Rates
Cap Rate 5%
$491,180
$491.2K
Cap Rate 7%
$350,843
$350.8K
Cap Rate 9%
$272,878
$272.9K
Market Conditions
NOI Build-Up for 4,700 SF
Gross rent
$42.9K $9.12/SF
− Vacancy
−$7.8K −$1.66/SF
EGI
$35.1K $7.46/SF
− OpEx
−$10.5K −$2.24/SF
NOI
$24.6K $5.23/SF
Area
Cochise County, AZ
Vacancy
18.15%
Lease Rate
$9.12 /SF/Yr
Expense Ratio
30.00%
Simulate Cap Rate and NOI
Suggested Prices Based on Cap Rates
Cap Rate 5%
$491,180
Cap Rate 7%
$350,843
Cap Rate 9%
$272,878
Alternative Uses
Best Use
Multifamily LT 5
$350.8K
$307.0K – $409.3K
NOI $24,559 @ 7.0% cap · market cap 3.51%
Second Best
Apartment 5plus
$319.0K
$279.2K – $372.2K
NOI $22,332 @ 7.0% cap · market cap 3.19%
Theoretical Best
Specialty Retail
$696.4K
$609.4K – $812.5K
NOI $48,751 @ 7.0% cap · market cap 6.97%
Zoning and permitted uses should be independently verified with authorities.
How Realmo checks its estimates
Property Analytics
Unlock full access to Insights
Subscribe to Realmo Intelligence
Open Analytics
Current Use
Lease Details
Yes
Fenced yard
Yes
Utilities to site
Location Intelligence
Trade Area within ½ mile
3
Businesses Nearby
Explore this area
Business Placement
Demographics for 85617, AZ
1,086
Population
718
Households
1.5
Avg Household Size
57
Median Age
22%
College-Educated
87%
High-School Grad
224.6 sq mi
ZIP Area
5
Density / Sq Mi
$47,837
Median Household Income
$37,283
Median Earnings
$567
Median Rent
$121,900
Median Home Value
Check the figures for this property
Cap Rate, Value Estimation, Potential NOI and more
View Realmo Analytics
Market
Vacancy Rate% for Multifamily in West region
Frequently Asked Questions
What type of property is this?
Duplex - Ranch-style property with a second conditioned building suited to conversion into guest quarters, an apartment, or a duplex.
Where is this duplex located?
The property is located at 4823 W Tumbleweed Lane McNeal, AZ.
What is the asking price?
The asking price for this property is $699,000.
What are key features of this property?
This property features: 20‑acre ranch property in Mc Neal, AZ; 2,700‑square‑foot main home paired with a 2,000‑square‑foot heated and cooled building; Secondary building has water and electricity for guesthouse, apartment, or duplex conversion