Mixed-Use Portfolio with New
For Sale
Contact for pricing
466 Northeast 5th Avenue, Delray Beach, FL 33483
Six-building commercial portfolio with full occupancy, professional services, and retail tenancy.
Property Size9,637 SF
Lot Size0.68 Acres
Price / SF$586.18
Days on Market99

Ask AI about this property
Review the available facts, identify missing information and prepare questions for the agent.
Property Features for 466 Northeast 5th Avenue
General Information
Standard status
Active
Size
9,637 SF
Class
B
Lot size
0.68 Acres
Property subtype
Retail, Office, Mixed Use
Zoning
Central Business District
Occupancy
100%
Lease Type
NNN
Investment Type
Stabilized
Net Operating Income
$331,914
Site & Location
Highway Access
Yes
Public Transit
Yes
Additional Details
Gross Income
$428,228
Building Details
Year Built
1950
Year Renovated
2022
Buildings
6
Units
12
Tenancy
Multi
Building Size
9,637 SF
Listing Agency:
Compass Florida LLC
Listed By:
Christopher Tapia · License #fl3297816
Source:
Crexi
Added: Jul 9
Changed: Oct 2
Last Checked: Oct 14 at 11:38PM
Displayed information is deemed reliable but is not guaranteed and should be independently verified. All listing content including descriptions, pricing, images are the copyrighted material of Compass Florida LLC
Investment Insights
Based on property information with market context.
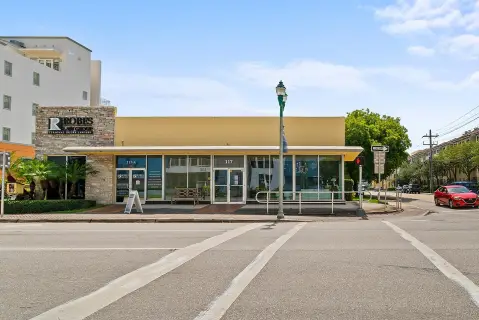
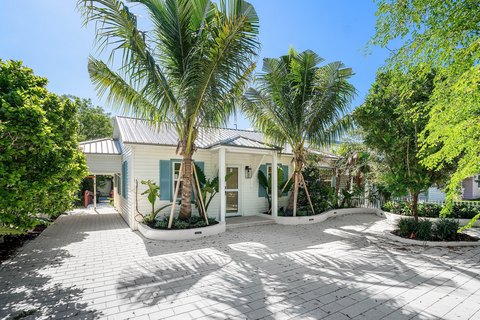
This mixed-use commercial portfolio comprises six buildings totaling 9,637 square feet across four tax parcels. The combined site measures approximately 0.68 acres and carries Central Business District zoning. Five buildings have brand-new roofs, and the improvements date to 1950. Current occupancy is 100% across 12 tenants representing professional services and retail uses.
The property is located at 466 Northeast 5th Avenue in Delray Beach, near Atlantic Avenue and a group of established national retailers including Publix, AT&T, Jersey Mike’s, and The UPS Store. Interstate 95, regional transit hubs, and Palm Beach International Airport are also identified as nearby connectivity points. The existing configuration supports a mix of commercial occupants within a multi-building CBD setting.
The property is located at 466 Northeast 5th Avenue in Delray Beach, near Atlantic Avenue and a group of established national retailers including Publix, AT&T, Jersey Mike’s, and The UPS Store. Interstate 95, regional transit hubs, and Palm Beach International Airport are also identified as nearby connectivity points. The existing configuration supports a mix of commercial occupants within a multi-building CBD setting.
Key Highlights
- 9,637 square feet across four tax parcels
- Approximately ±0.68 acres of Central Business District‑zoned land
- Six buildings with 100% occupancy across 12 tenants
Financial Insights
Estimated NOI and Cap Rate
NOI / Yr
$255,429
Cap Rate
4.52%
Suggested Prices Based on Cap Rates
Cap Rate 5%
$5,108,580
$5.1M
Cap Rate 7%
$3,648,986
$3.6M
Cap Rate 9%
$2,838,100
$2.8M
Market Conditions
NOI Build-Up for 9,637 SF
Gross rent
$439.4K $45.60/SF
− Vacancy
−$98.9K −$10.26/SF
EGI
$340.6K $35.34/SF
− OpEx
−$85.1K −$8.84/SF
NOI
$255.4K $26.51/SF
Area
Palm Beach County, FL
Vacancy
22.50%
Lease Rate
$45.60 /SF/Yr
Expense Ratio
25.00%
Simulate Cap Rate and NOI
Suggested Prices Based on Cap Rates
Cap Rate 5%
$5,108,580
Cap Rate 7%
$3,648,986
Cap Rate 9%
$2,838,100
Alternative Uses
Best Use
Office B
$3.65M
$3.19M – $4.26M
NOI $255,429 @ 7.0% cap · market cap 4.52%
Second Best
Mixed Use
$2.37M
$2.08M – $2.77M
NOI $166,238 @ 7.0% cap · market cap 2.94%
Theoretical Best
Office A
$6.79M
$5.94M – $7.92M
NOI $475,084 @ 7.0% cap · market cap 8.41%
Zoning and permitted uses should be independently verified with authorities.
How Realmo checks its estimates
Property Analytics
Unlock full access to Insights
Subscribe to Realmo Intelligence
Open Analytics
Current Use
Lease Details
Yes
Highway access
Location Intelligence
Trade Area within ½ mile
1,808
Businesses Nearby
Explore this area
Business Placement
Demographics for 33483, FL
13,103
Population
9,493
Households
1.4
Avg Household Size
59
Median Age
57%
College-Educated
93%
High-School Grad
3.8 sq mi
ZIP Area
3,448
Density / Sq Mi
$117,854
Median Household Income
$60,502
Median Earnings
$2,306
Median Rent
$755,700
Median Home Value
Check the figures for this property
Cap Rate, Value Estimation, Potential NOI and more
View Realmo Analytics
Market
Vacancy Rate% for Office in South region






Frequently Asked Questions
What type of property is this?
Mixed-use property - Six-building commercial portfolio with full occupancy, professional services, and retail tenancy.
Where is this mixed-use property located?
The property is located at 466 Northeast 5th Avenue Delray Beach, FL.
What is the asking price?
The asking price for this property is $5,649,000.
What are key features of this property?
This property features: 9,637 square feet across four tax parcels; Approximately ±0.68 acres of Central Business District‑zoned land; Six buildings with 100% occupancy across 12 tenants


