Remodeled Flex Office
For Sale
$1,792,800
451 South Washington Street, Valparaiso, IN 46383
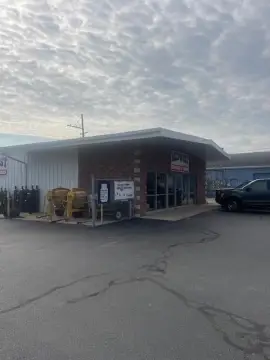
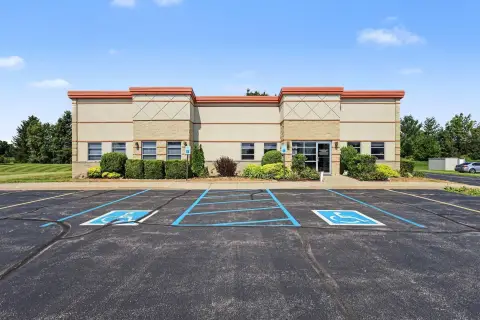
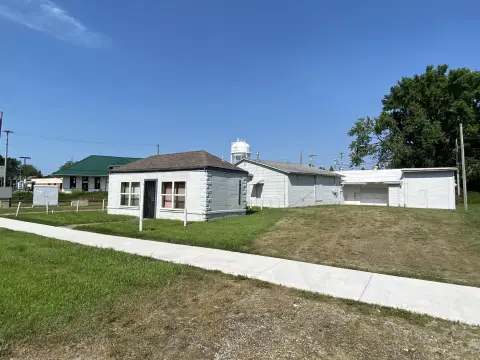
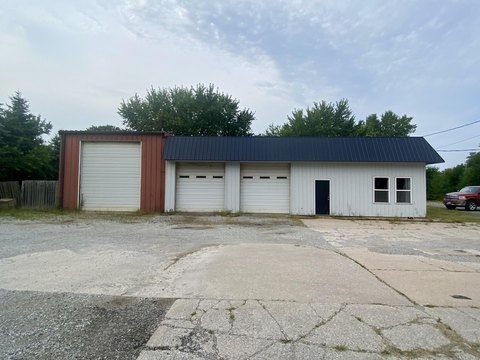
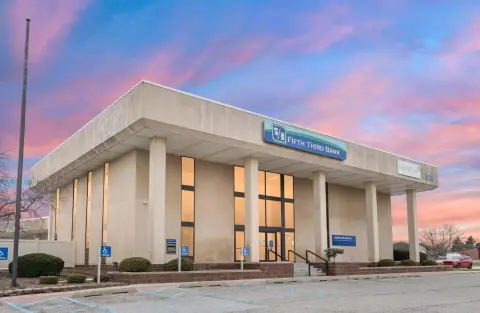
Air-conditioned flex property combining private offices, open workspace, and warehouse functions across two levels.
Property Size11,952 SF
Price / SF$150
Days on Market51

Ask AI about this property
Review the available facts, identify missing information and prepare questions for the agent.
Property Features for 451 South Washington Street
General Information
Standard status
Active
Size
11,952 SF
Class
A
Total Parking Spaces
35
Property subtype
Office - General Office
Site & Location
Highway Access
Yes
Road Access
Yes
Utilities to Site
Yes
Warehouse & Industrial
Clear Height
8.9 ft
Dock-High Doors
1
Power
200 amps
Voltage
240 V
Three-Phase Power
No
Conditioned Warehouse
Yes
Amenities
conference room
kitchen
break area
Building Details
Building Size
11,952 SF
Year Renovated
2022
Buildings
1
Stories
2
Units
1
Listing Agency:
Commercial In-Sites
Listed By:
David A. Lasser
(219) 795-1100
Source:
Commercialcafe
Added: Aug 26
Changed: Oct 13
Last Checked: Oct 14 at 8:22PM
Displayed information is deemed reliable but is not guaranteed and should be independently verified. All listing content including descriptions, pricing, images are the copyrighted material of Commercial In-Sites
Investment Insights
Based on property information with market context.
Remodeled in 2022, this 11,952 SF flex building combines air-conditioned office and warehouse functions. The first floor includes four private offices, open office space configured for up to 30 workstations, a conference room, kitchen, men’s and women’s restrooms, storage, IT and janitorial closets, plus a warehouse office area. The lower level provides warehouse space, a break area, and shipping and receiving functions.
The property has one dock, a 10' x 12' overhead door, and clear heights of 10 feet to the trusses and 8'11" to the grid on each floor. Electrical service is 200 AMP, 240 Volt, single-phase, with 1.2 Gig Comcast speed. Parking includes 12 spaces at the front, 6 at the rear, and 17 on the north side. Building access is available from Washington and Franklin Streets.
Washington Street recorded 11,392 cars per day in 2025 INDOT traffic counts. The building is two blocks north of U.S. Highway 30, 2 miles west of S.R. 49, and 9 miles southwest of I-90.
The property has one dock, a 10' x 12' overhead door, and clear heights of 10 feet to the trusses and 8'11" to the grid on each floor. Electrical service is 200 AMP, 240 Volt, single-phase, with 1.2 Gig Comcast speed. Parking includes 12 spaces at the front, 6 at the rear, and 17 on the north side. Building access is available from Washington and Franklin Streets.
Washington Street recorded 11,392 cars per day in 2025 INDOT traffic counts. The building is two blocks north of U.S. Highway 30, 2 miles west of S.R. 49, and 9 miles southwest of I-90.
Key Highlights
- 11,952 SF flex office and warehouse building remodeled in 2022
- First floor supports up to 30 workstations and includes 4 private offices
- Lower level includes warehouse, break area, and shipping/receiving area
Financial Insights
Estimated NOI and Cap Rate
NOI / Yr
$143,582
Cap Rate
8.01%
Suggested Prices Based on Cap Rates
Cap Rate 5%
$2,871,640
$2.9M
Cap Rate 7%
$2,051,171
$2.1M
Cap Rate 9%
$1,595,356
$1.6M
Market Conditions
NOI Build-Up for 11,952 SF
Gross rent
$203.7K $17.04/SF
− Vacancy
−$12.2K −$1.02/SF
EGI
$191.4K $16.02/SF
− OpEx
−$47.9K −$4.00/SF
NOI
$143.6K $12.01/SF
Area
Porter County, IN
Vacancy
6.00%
Lease Rate
$17.04 /SF/Yr
Expense Ratio
25.00%
Simulate Cap Rate and NOI
Suggested Prices Based on Cap Rates
Cap Rate 5%
$2,871,640
Cap Rate 7%
$2,051,171
Cap Rate 9%
$1,595,356
Alternative Uses
Best Use
Office B
$2.05M
$1.79M – $2.39M
NOI $143,582 @ 7.0% cap · market cap 8.01%
Second Best
Flex RnD
$1.01M
$887.8K – $1.18M
NOI $71,025 @ 7.0% cap · market cap 3.96%
Theoretical Best
Healthcare Medical
$4.53M
$3.96M – $5.28M
NOI $317,093 @ 7.0% cap · market cap 17.69%
Zoning and permitted uses should be independently verified with authorities.
How Realmo checks its estimates
Property Analytics
Unlock full access to Insights
Subscribe to Realmo Intelligence
Open Analytics
Current Use
Lease Details
8 ft
Clear height
1
Dock-high doors
Yes
Highway access
Yes
Paved road access
Yes
Utilities to site
Location Intelligence
Trade Area within ½ mile
1,671
Businesses Nearby
Under-served
Demand for This Use
Explore this area
Business Placement
Demographics for 46383, IN
41,981
Population
18,343
Households
2.3
Avg Household Size
39
Median Age
38%
College-Educated
95%
High-School Grad
87.5 sq mi
ZIP Area
480
Density / Sq Mi
$75,575
Median Household Income
$43,065
Median Earnings
$1,144
Median Rent
$258,400
Median Home Value
Check the figures for this property
Cap Rate, Value Estimation, Potential NOI and more
View Realmo Analytics
Market
Vacancy Rate% for Office in Midwest region






Frequently Asked Questions
What type of property is this?
Flex space - Air-conditioned flex property combining private offices, open workspace, and warehouse functions across two levels.
Where is this flex space located?
The property is located at 451 South Washington Street Valparaiso, IN.
What is the asking price?
The asking price for this property is $1,792,800.
What are key features of this property?
This property features: 11,952 SF flex office and warehouse building remodeled in 2022; First floor supports up to 30 workstations and includes 4 private offices; Lower level includes warehouse, break area, and shipping/receiving area


