Renovated Flex Space with
For Sale
$1,100,000
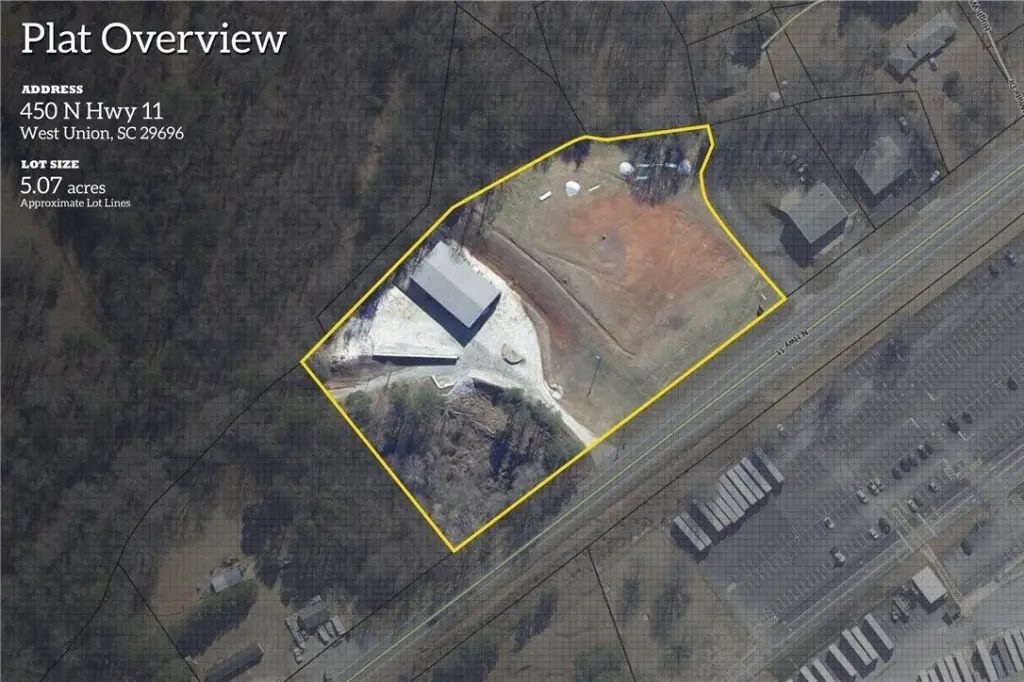
450 N Hwy 11, West Union, SC 29696
CommercialSale, West Union, SC
Property Size5,400 SF
Lot Size5.07 Acres
Price / SF$203.70
Days on Market94
Property Features for 450 N Hwy 11
General Information
Property type
Commercial Sale
Property subtype
Other
Security features
Security
Appliances
WaterHeater
Lot features
City Lot, Cleared, Level
Directions
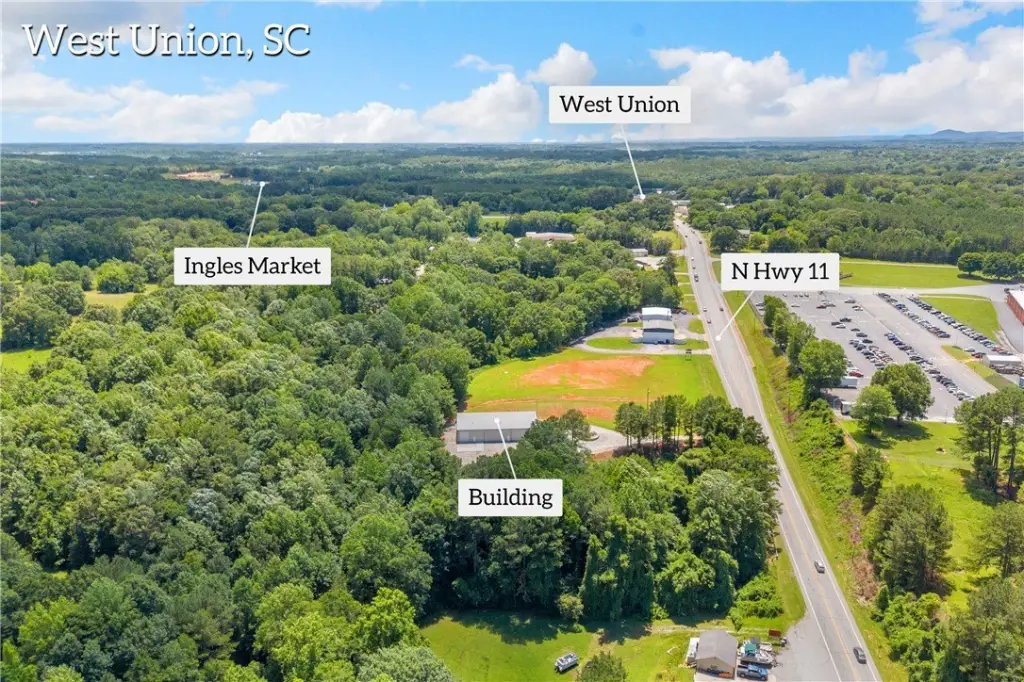
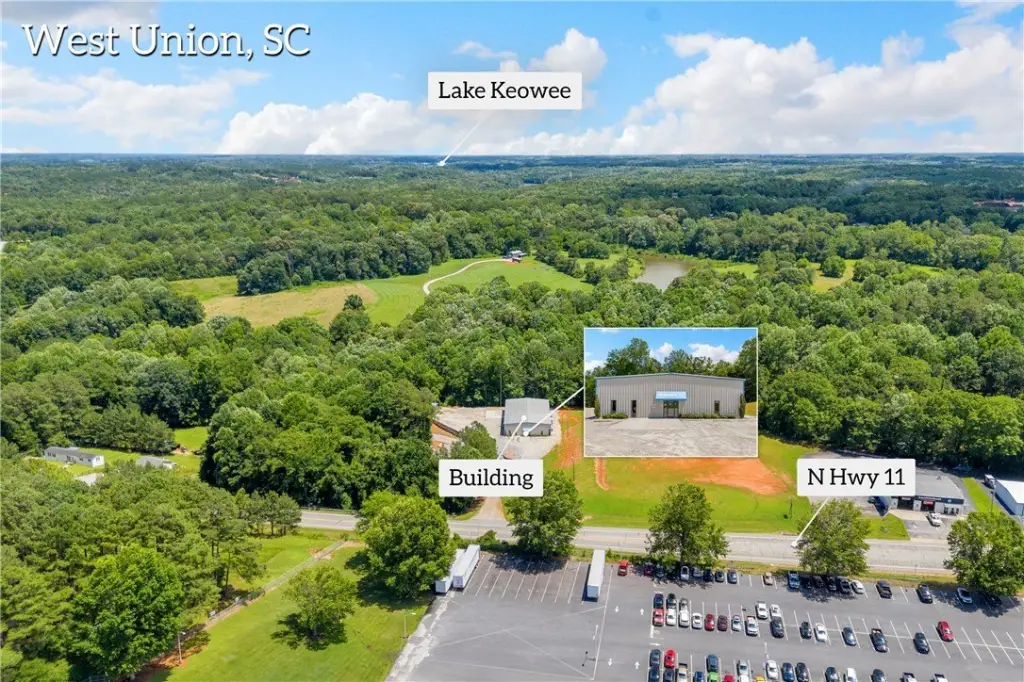
On Hwy 11 just north of West Union; across from Itron
Subdivision
205-Oconee County, SC
Standard status
Active
APN
510-04-01-010
Lot size
5.07 Acres
Taxes and HOA fees
Tax Year
2025
Utilities
Cooling system
Electric, Central Air, Zoned
Amenities
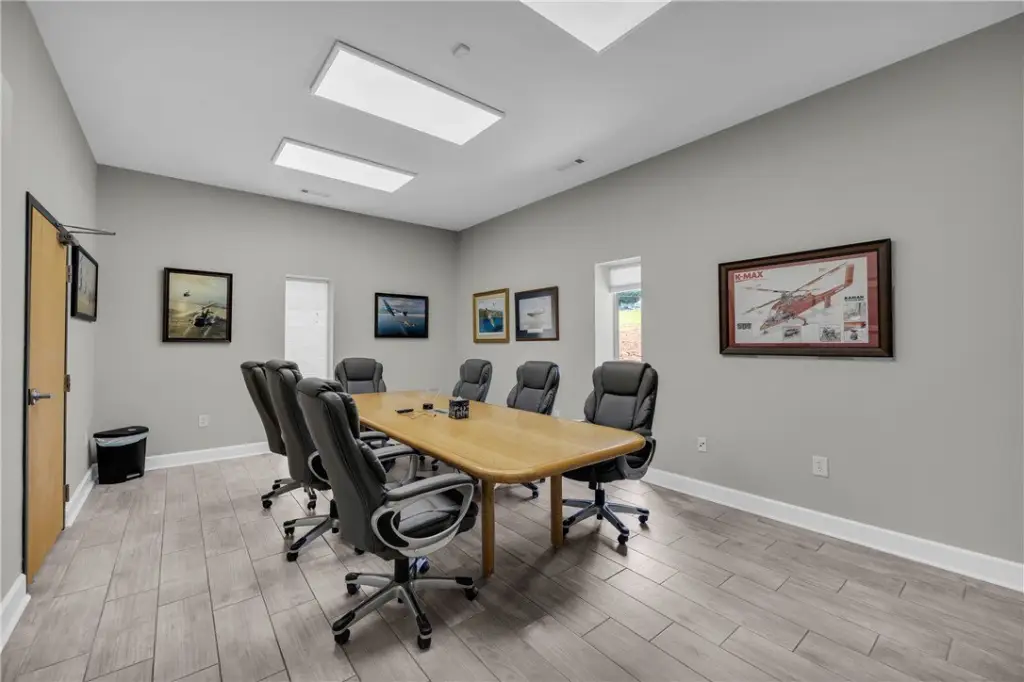
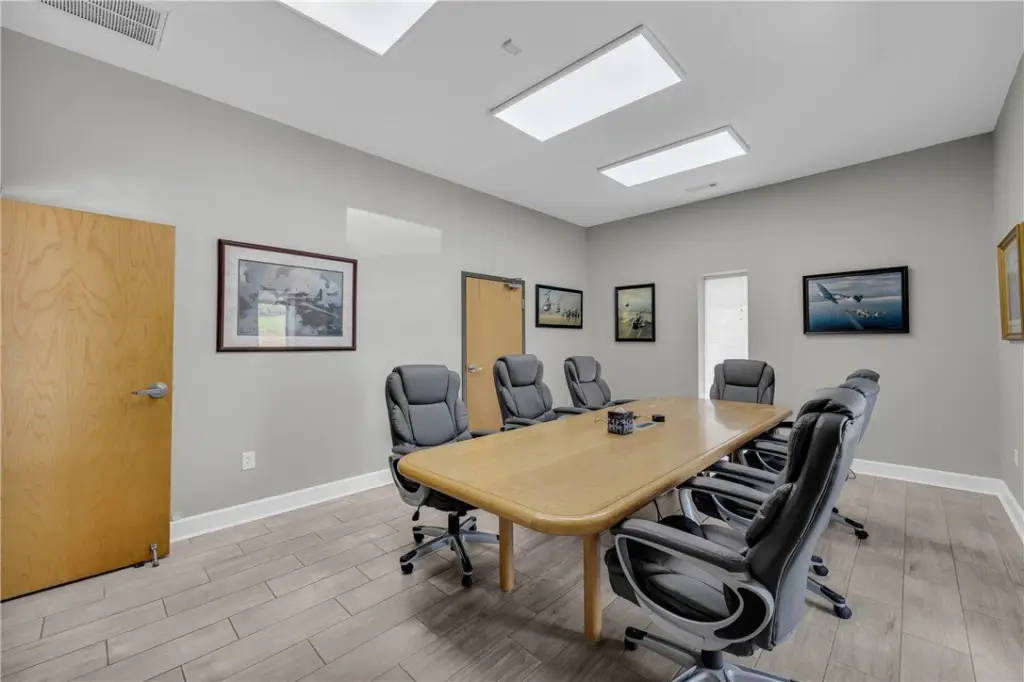
conference room
security office
Building Details
Year built
2009
Flooring type
Concrete
Building materials
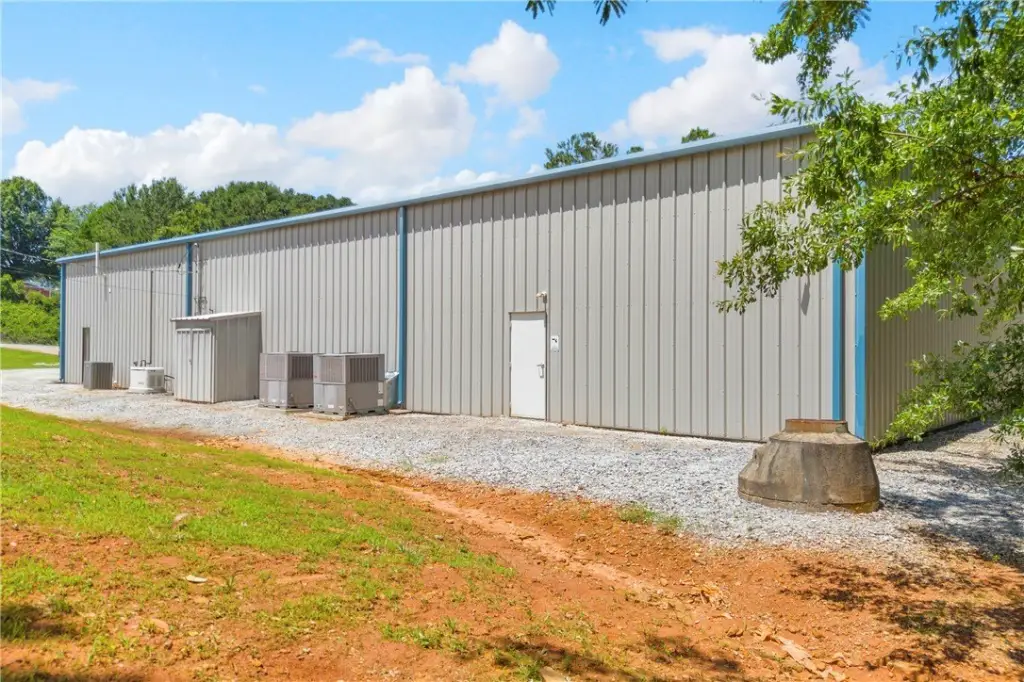
MetalSiding
Listing Agency:
Powell Real Estate
(864) 638-5879
Listed By:
Adriana Powell · License #131210
(864) 723-6424
Added: Jun 25
Changed: Sep 17
Last Checked: Sep 26 at 3:06PM
MLS# 20303080
Copyright © 2026 Western Upstate Association of REALTORS®. All rights reserved. All information provided by the listing agent/broker is deemed reliable but is not guaranteed and should be independently verified.
Investment Insights
Based on property information with market context.
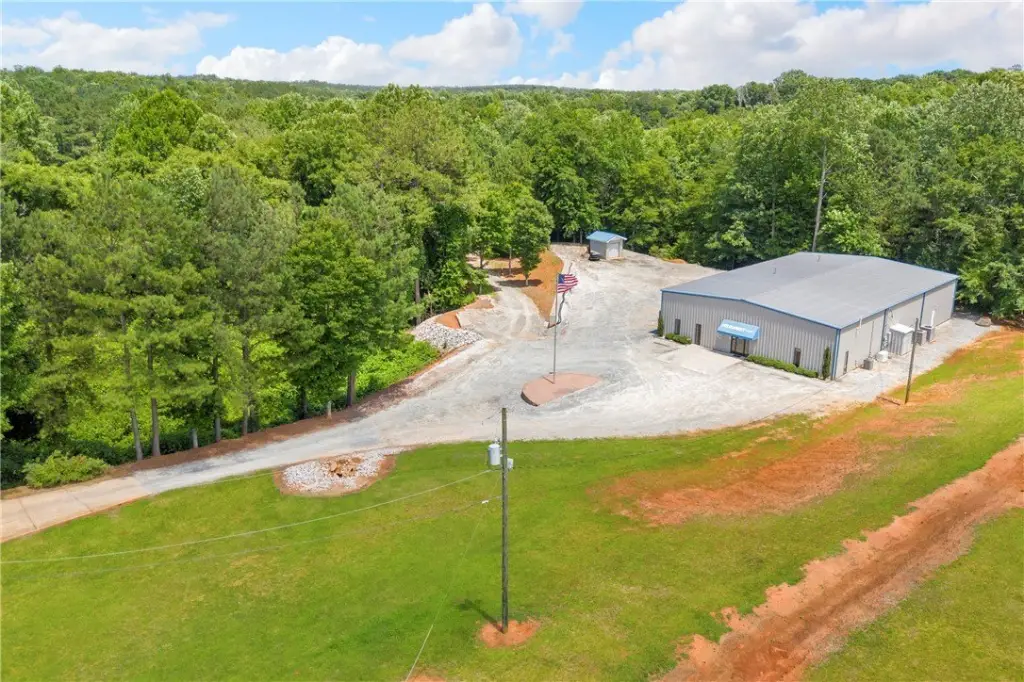
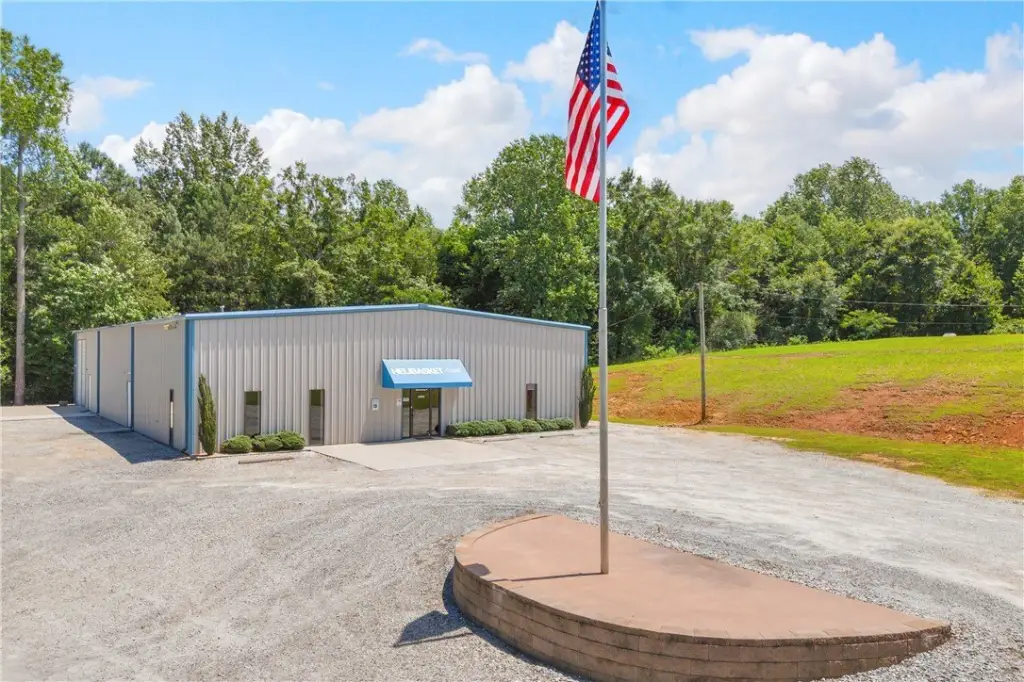
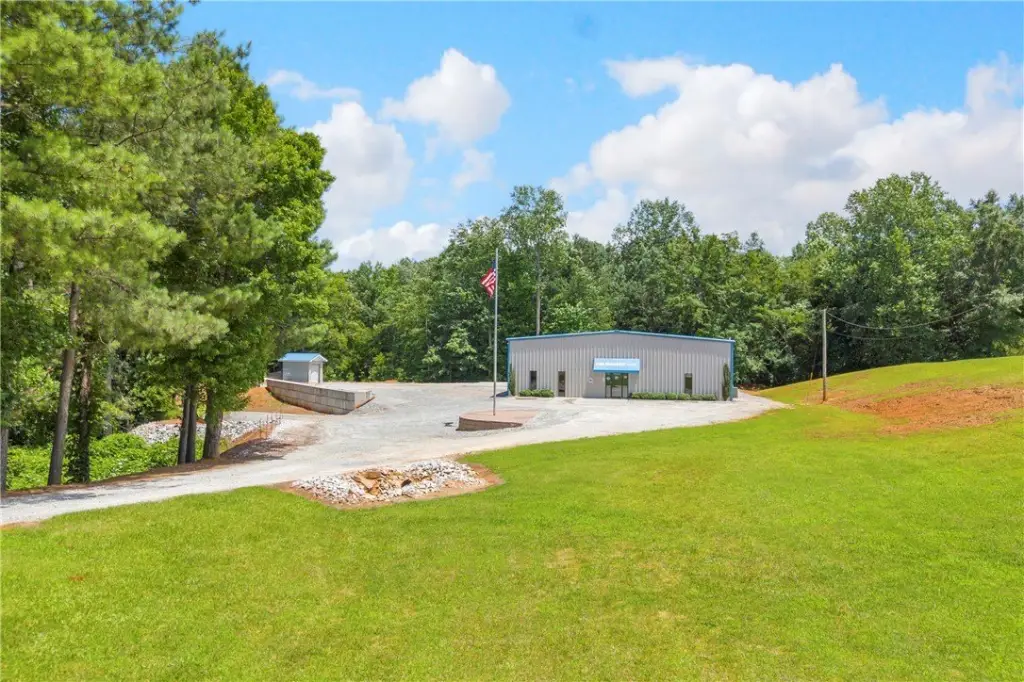
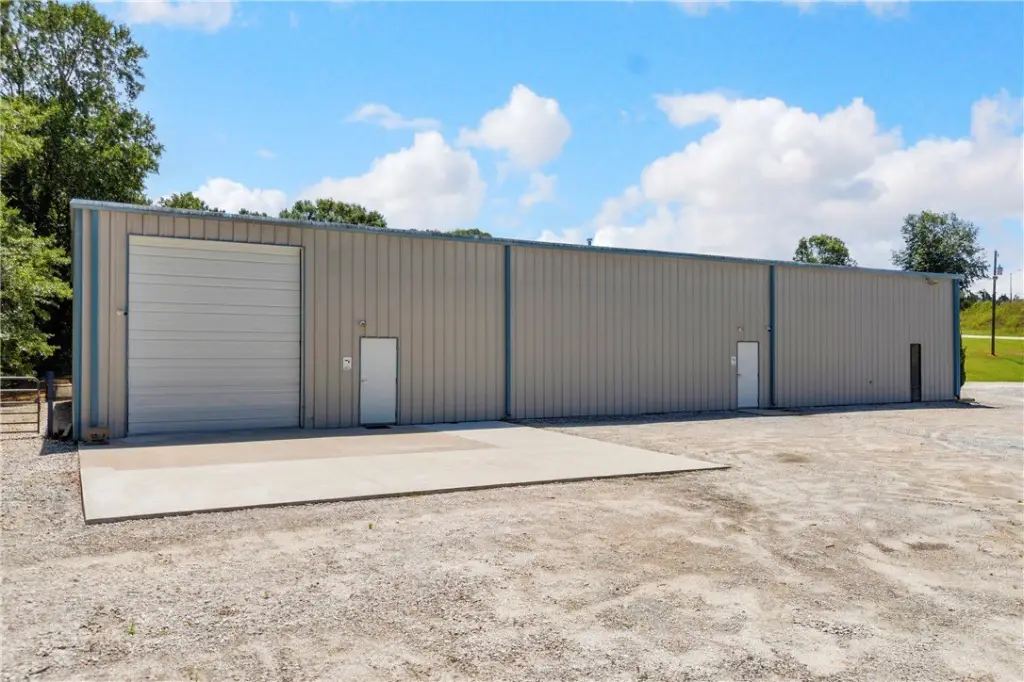
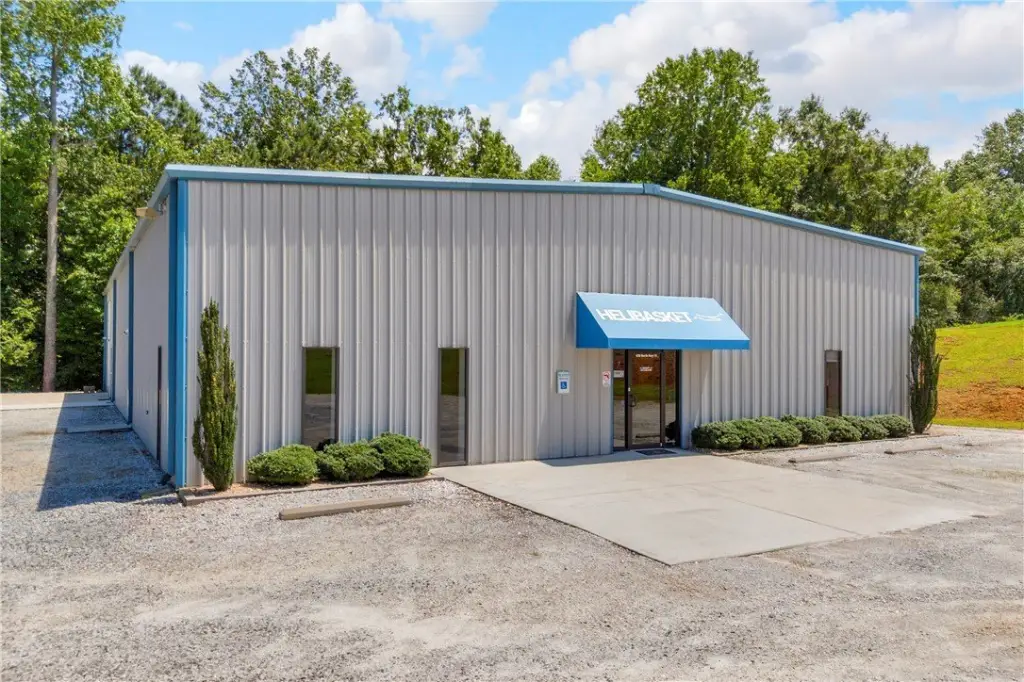
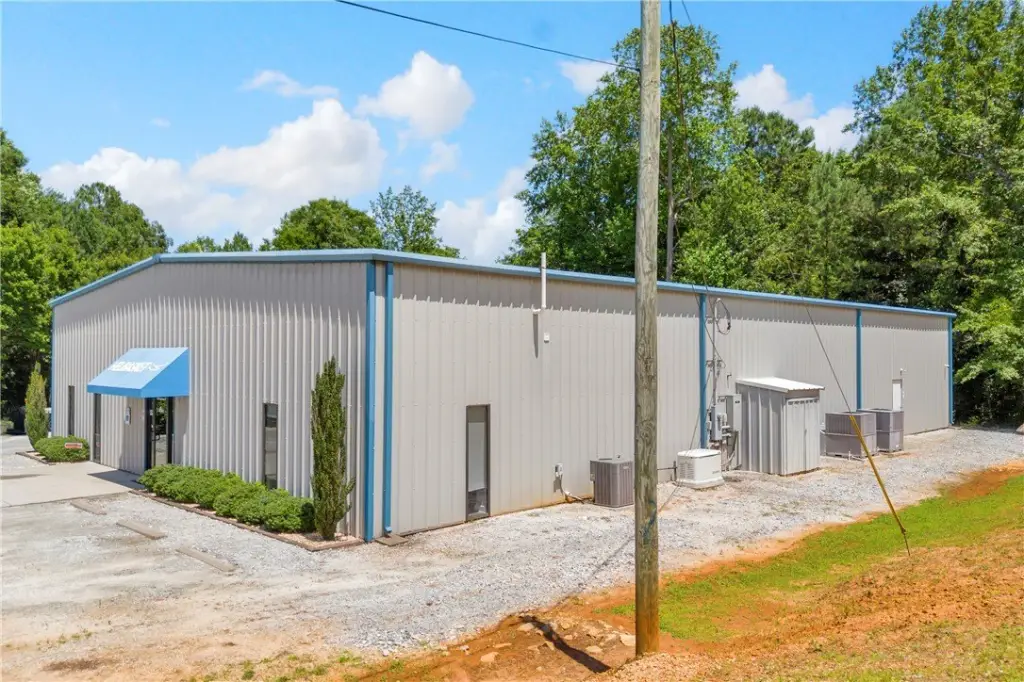
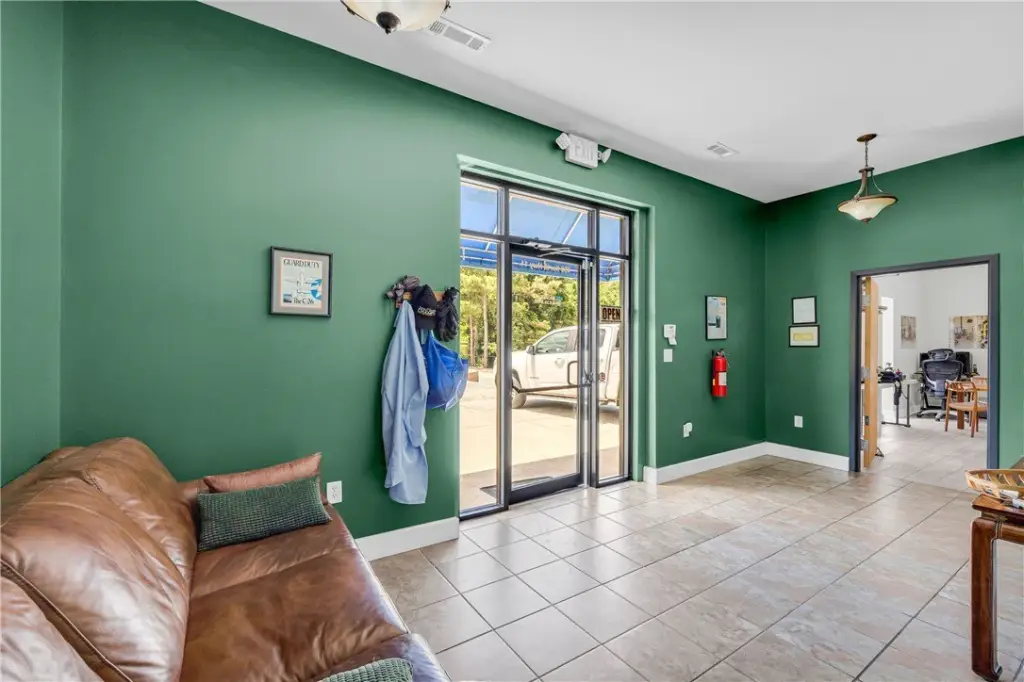
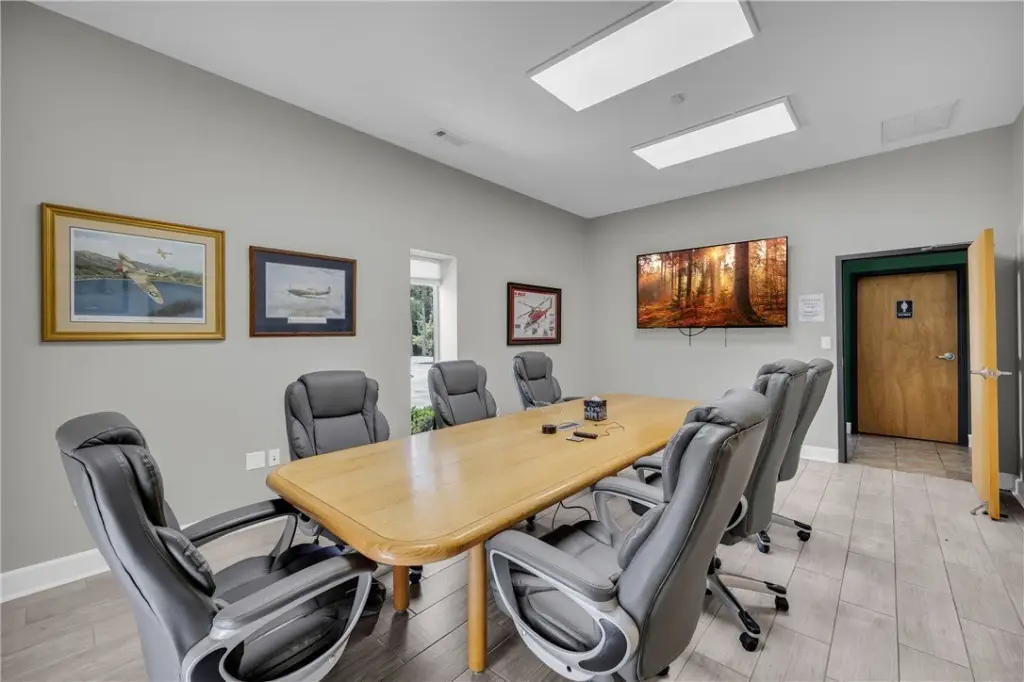
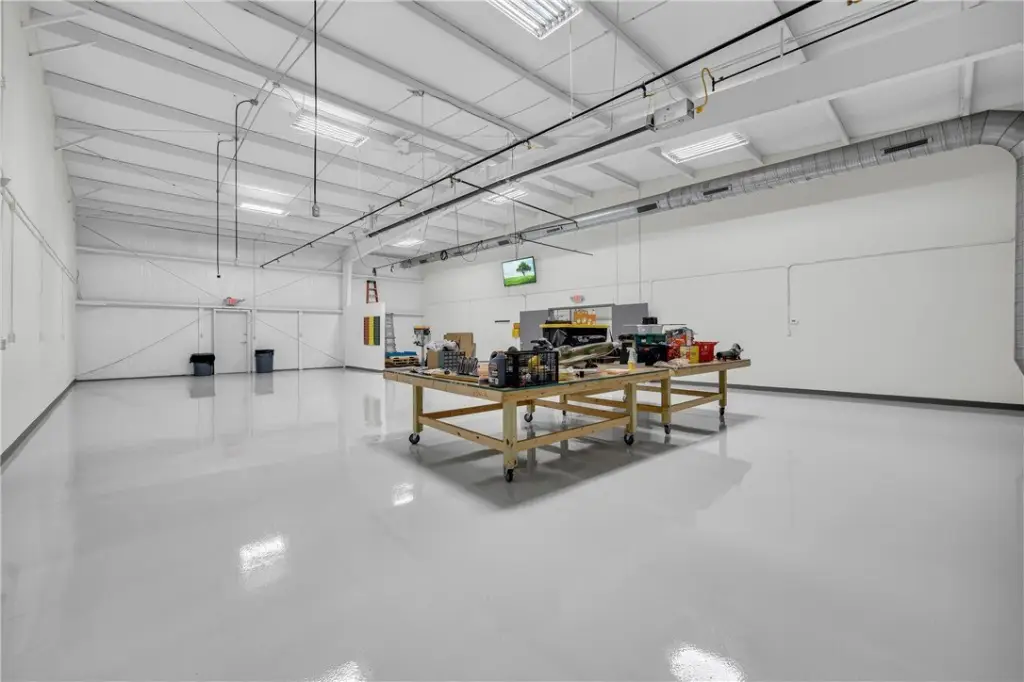
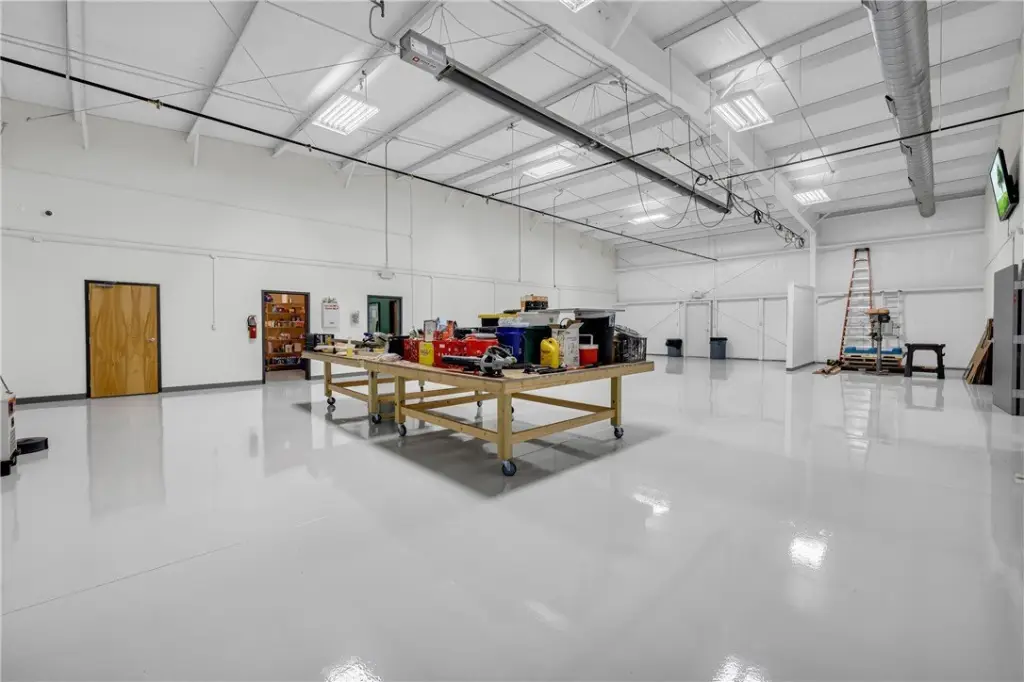
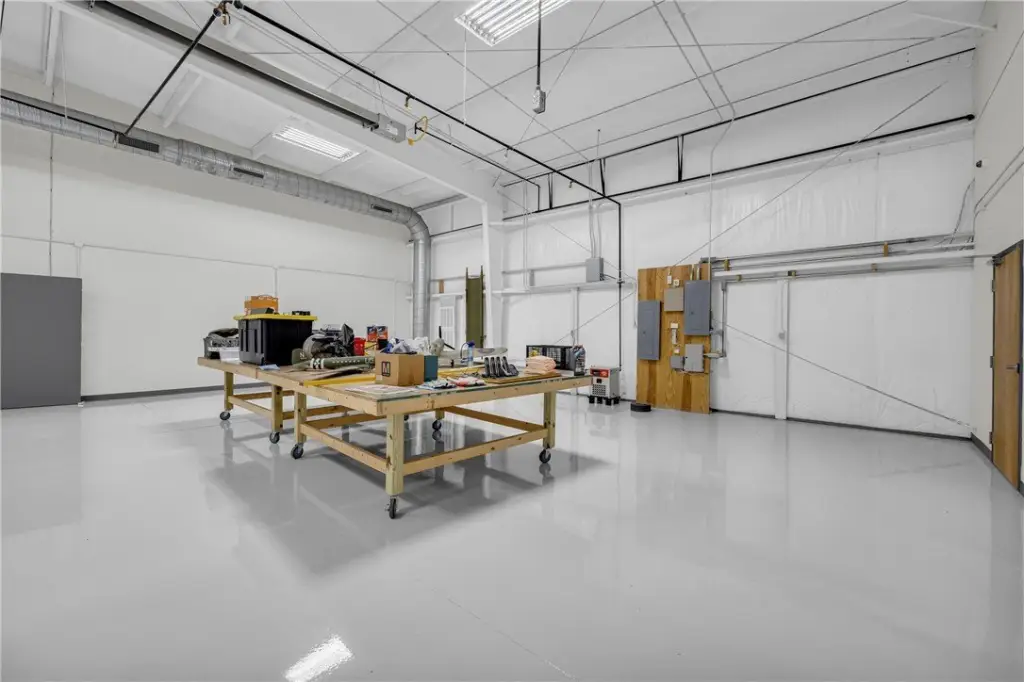
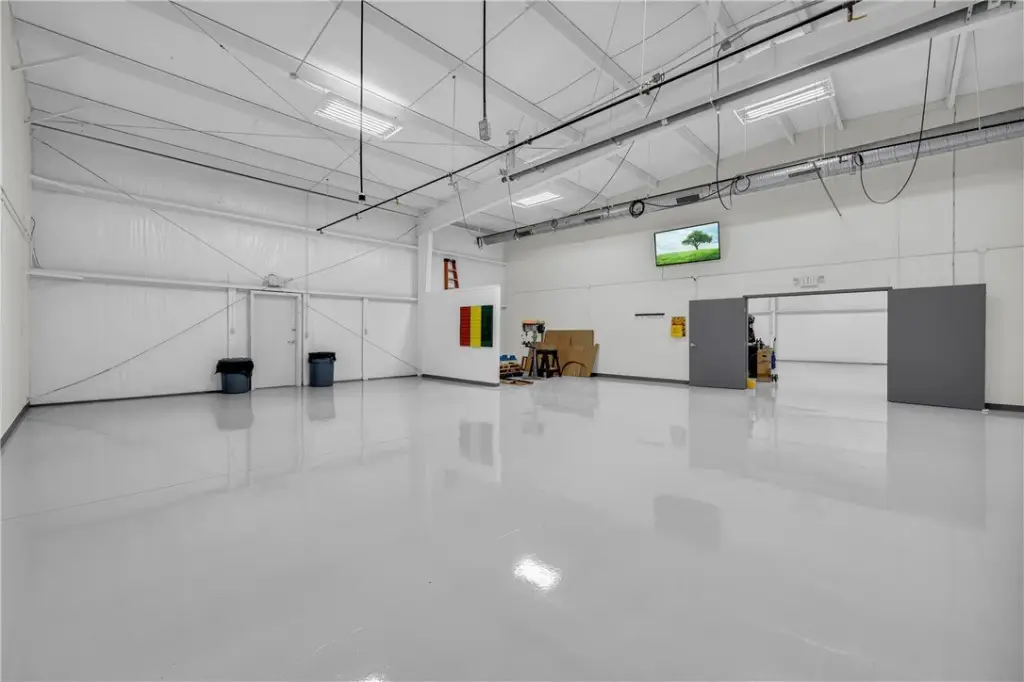
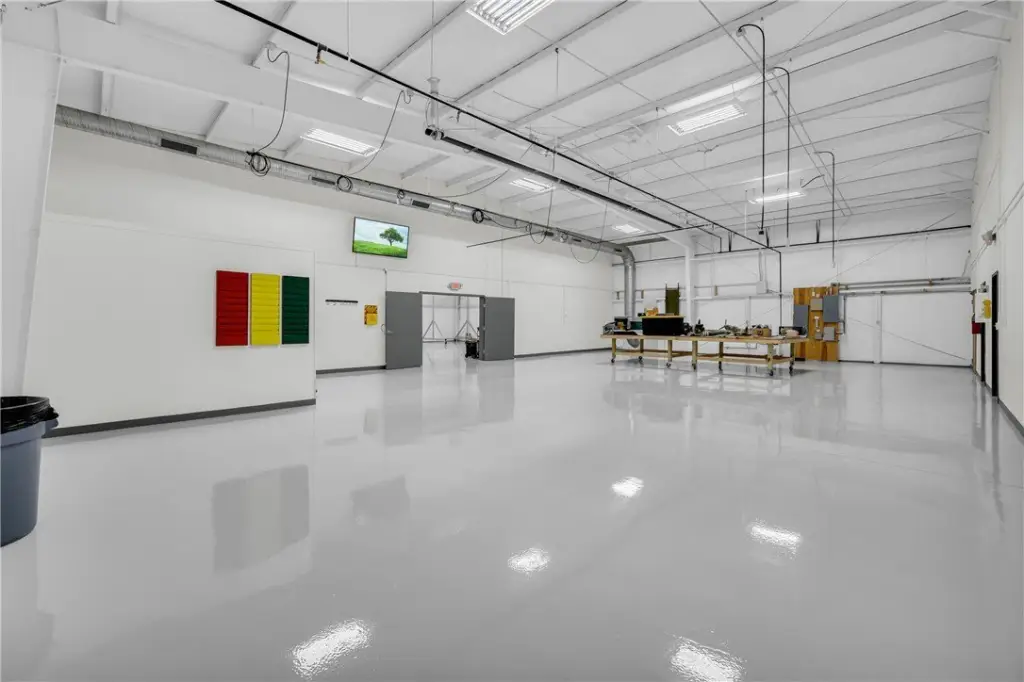
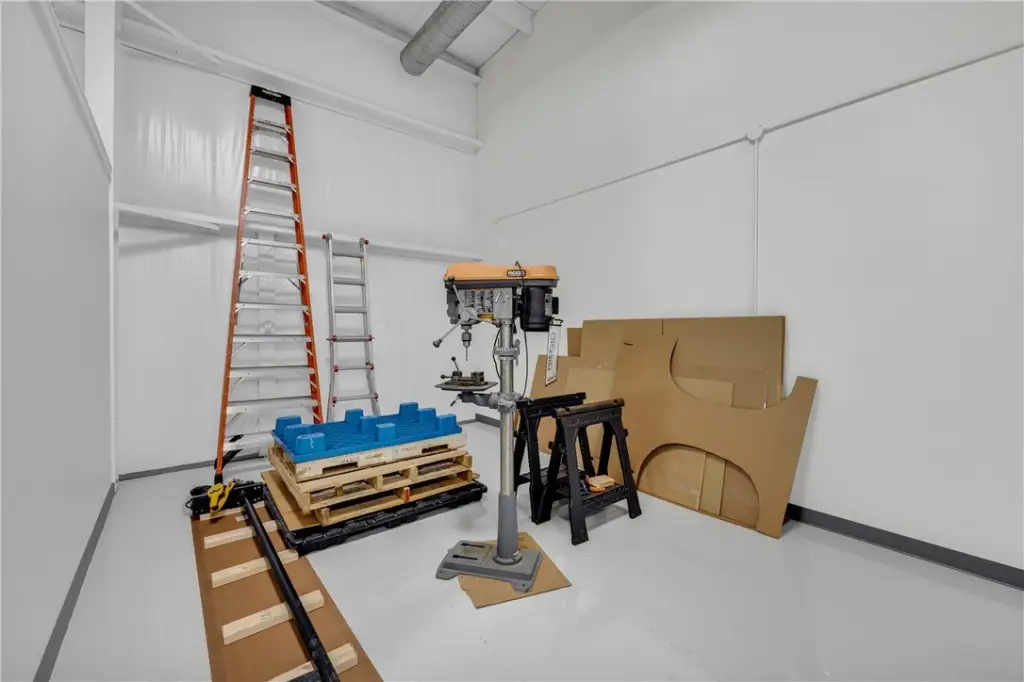
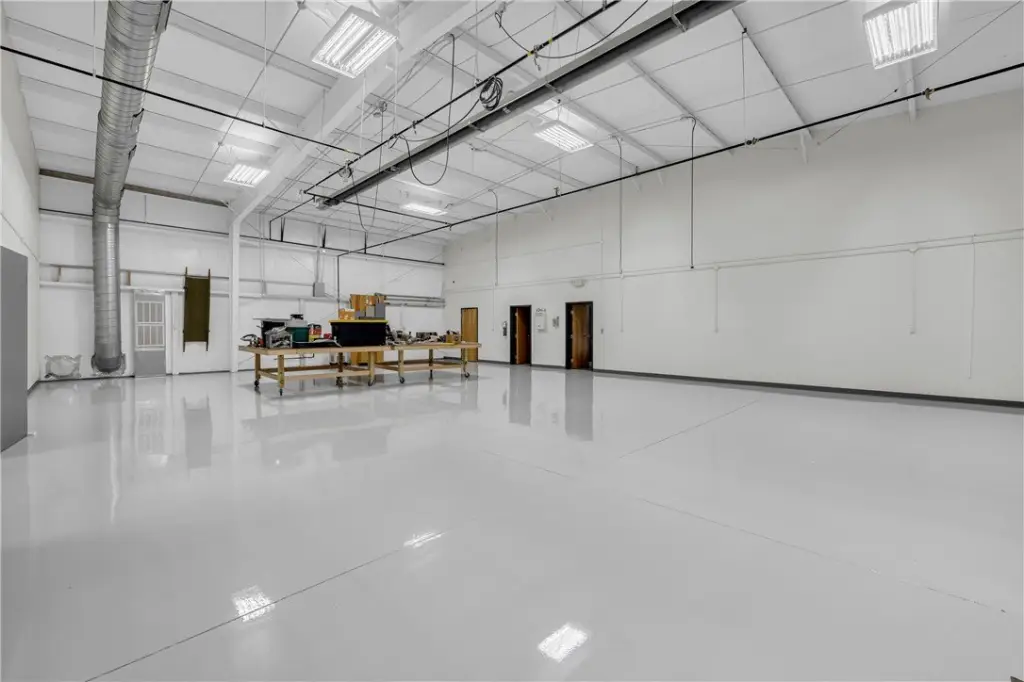
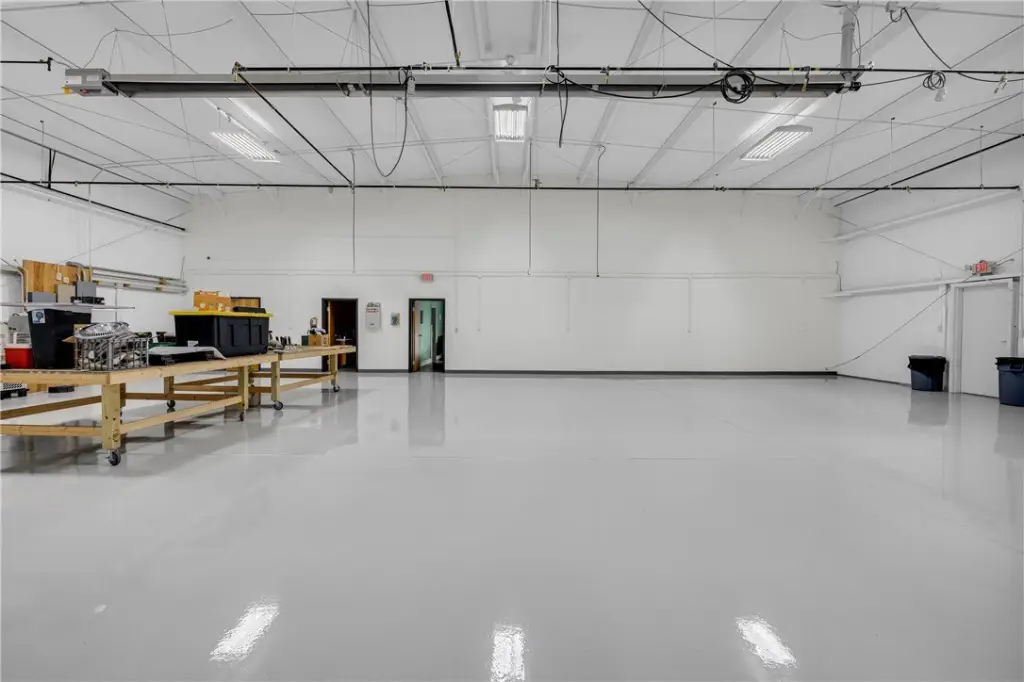
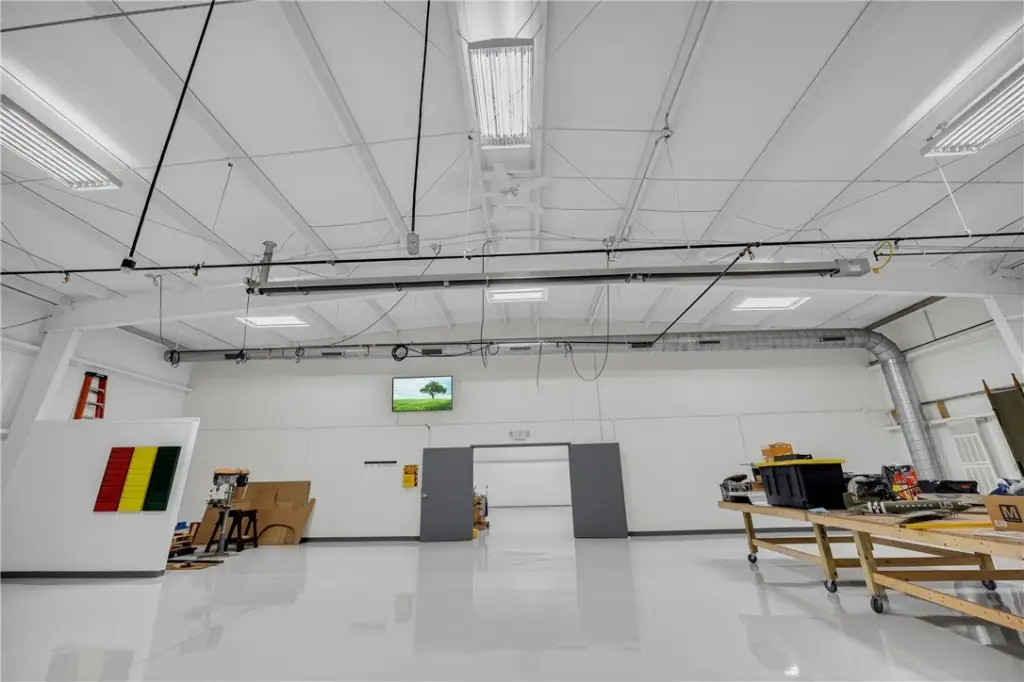
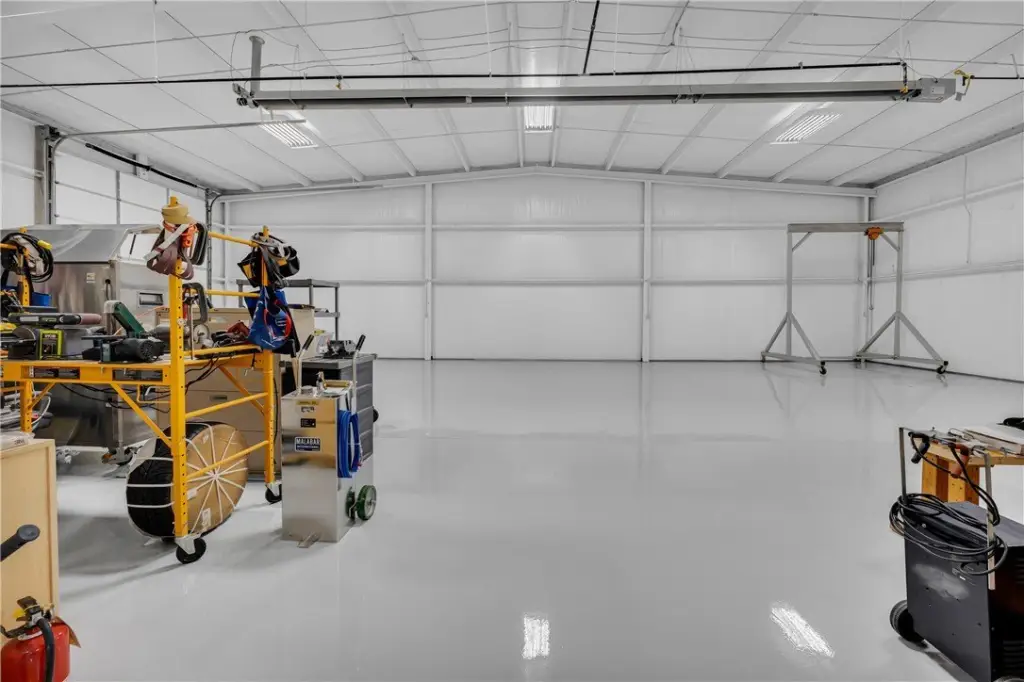
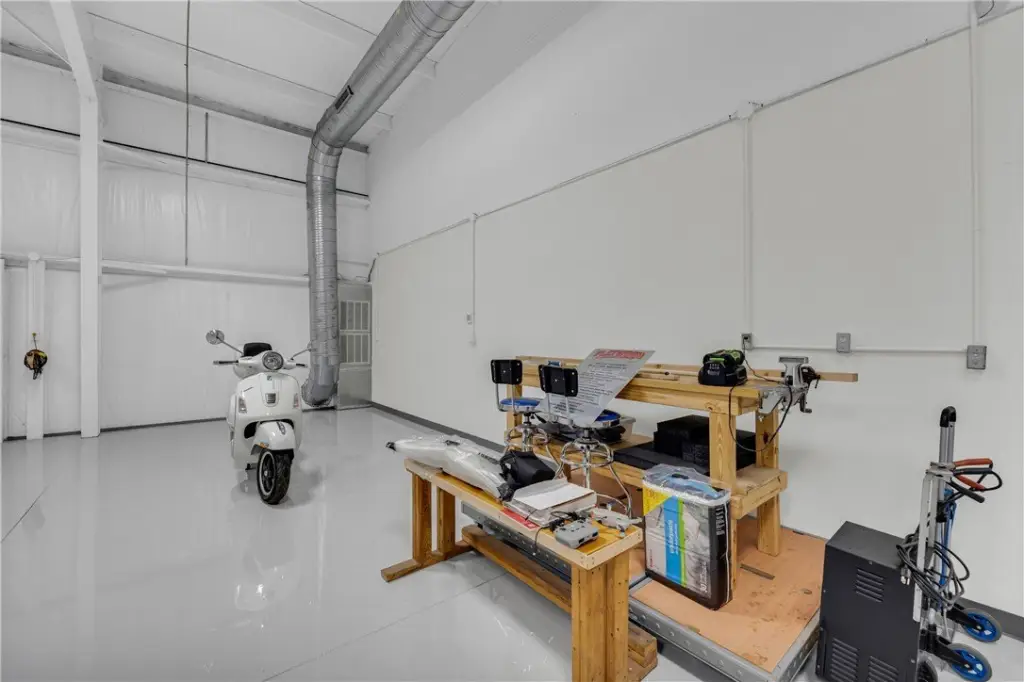
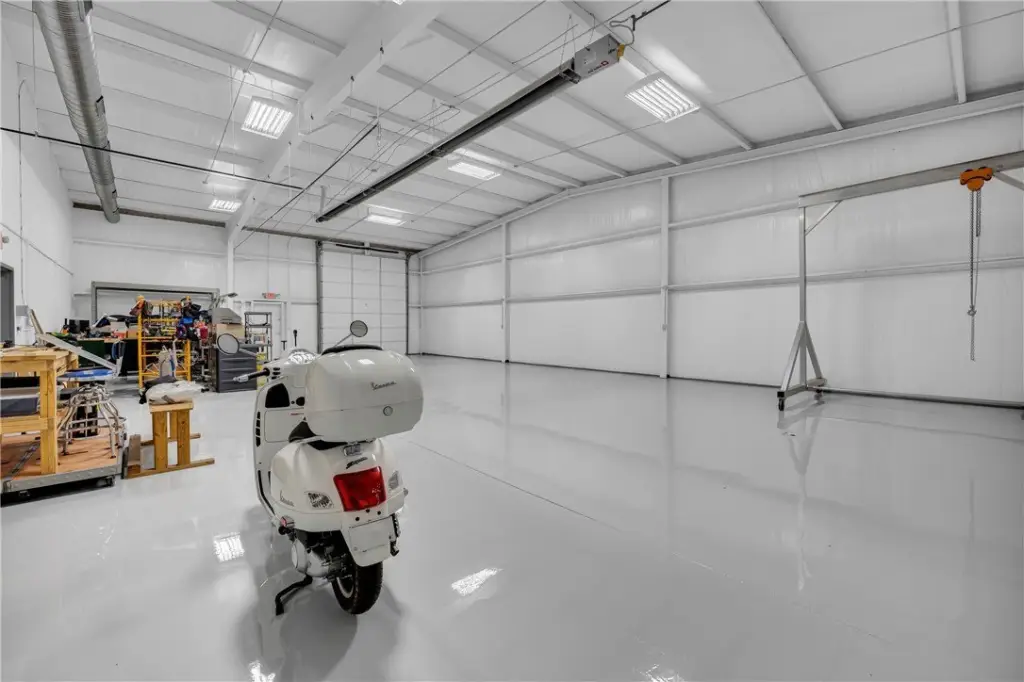
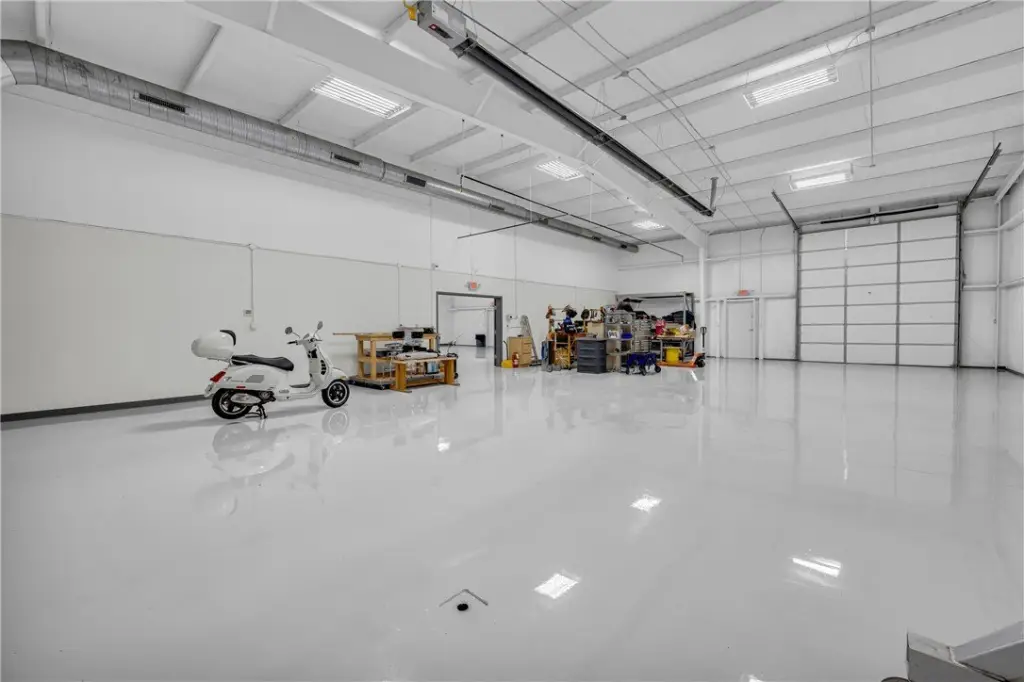
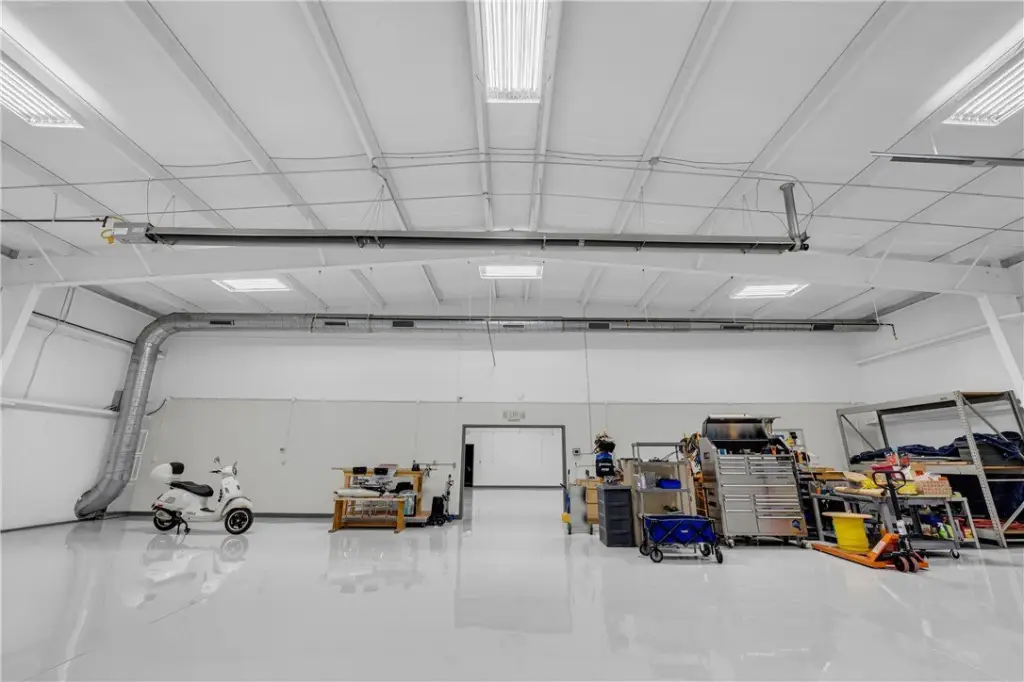
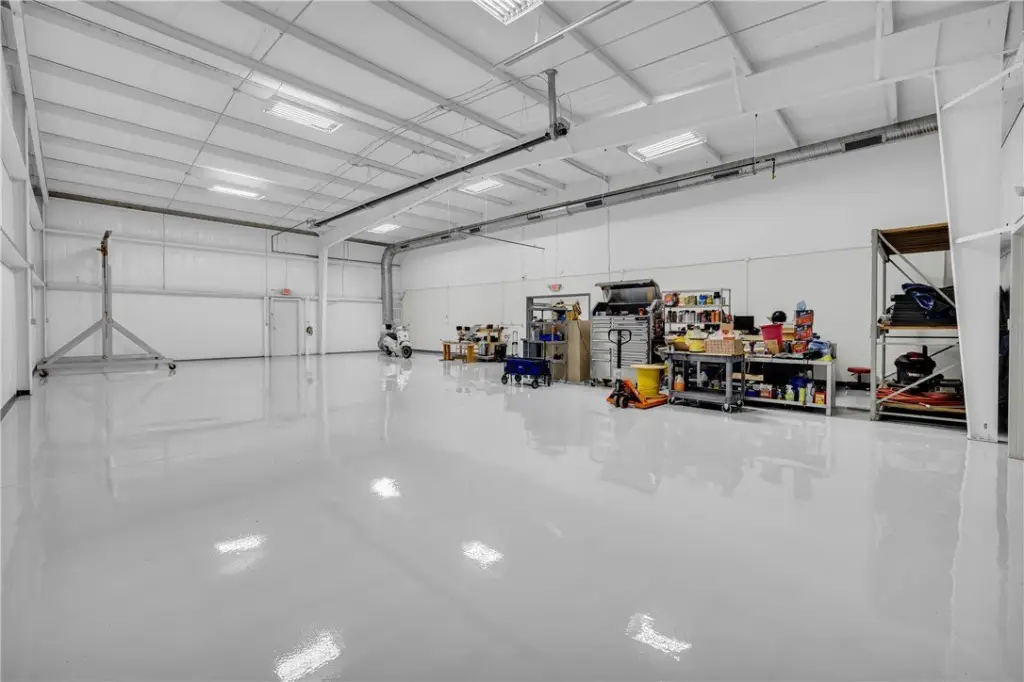
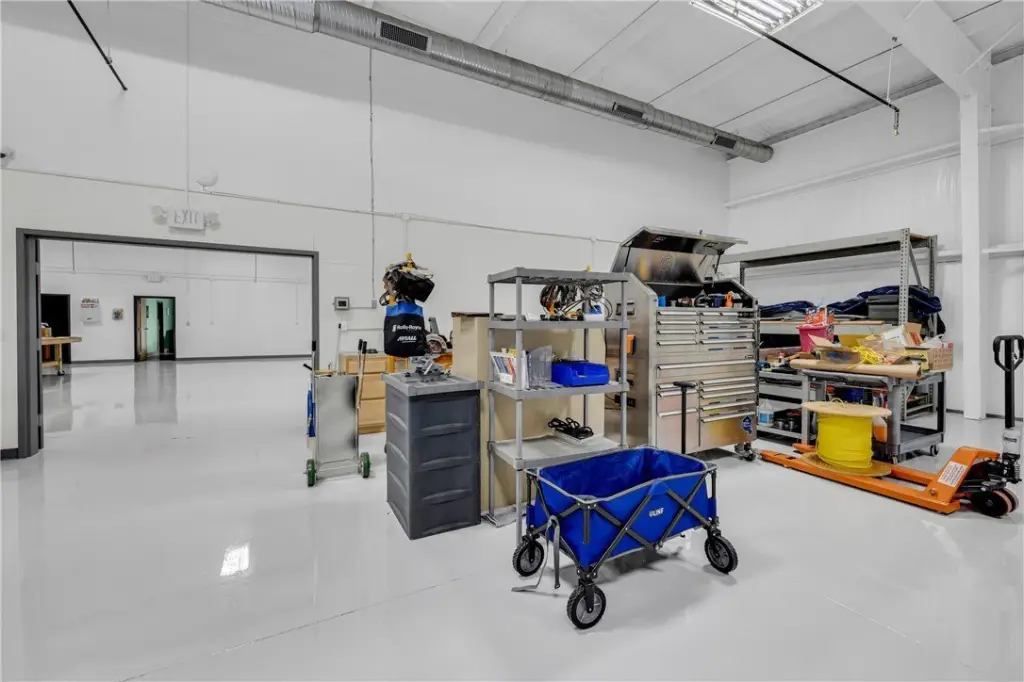
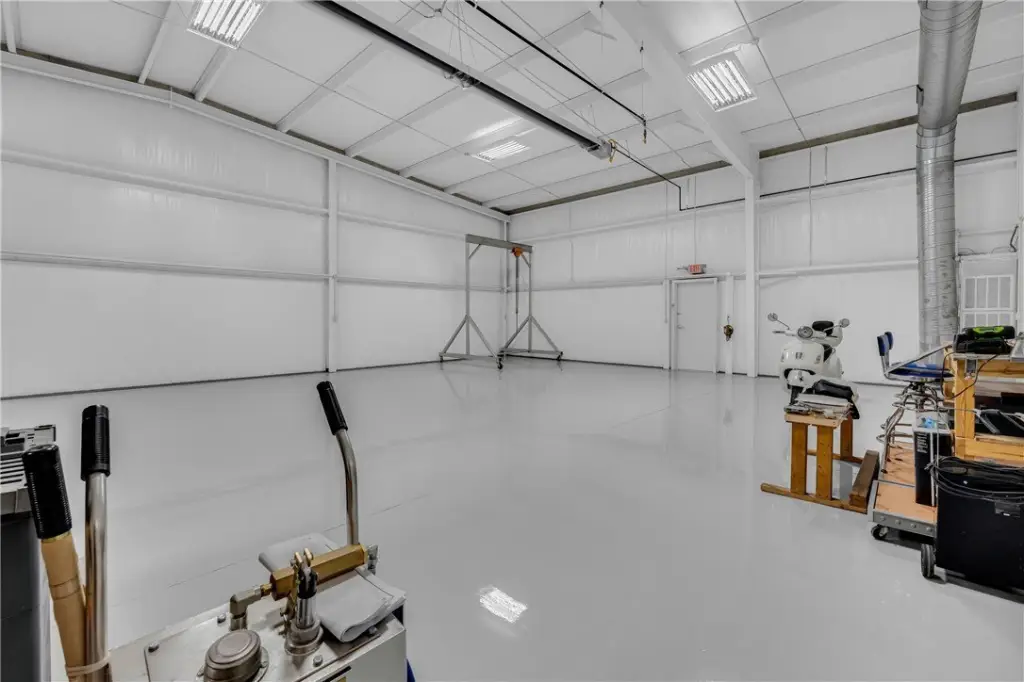
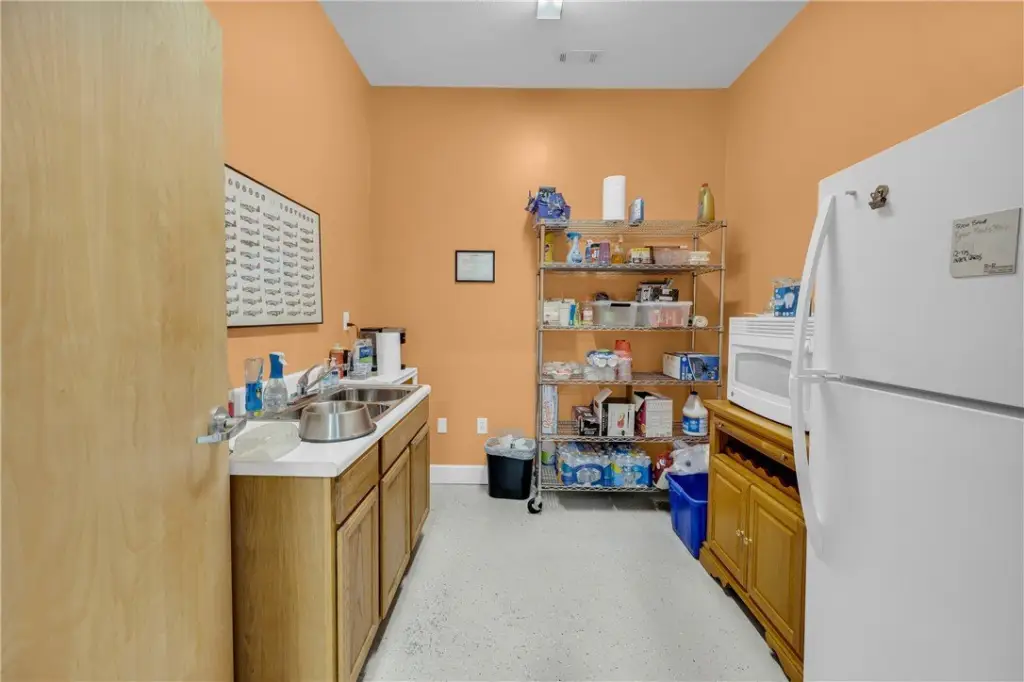
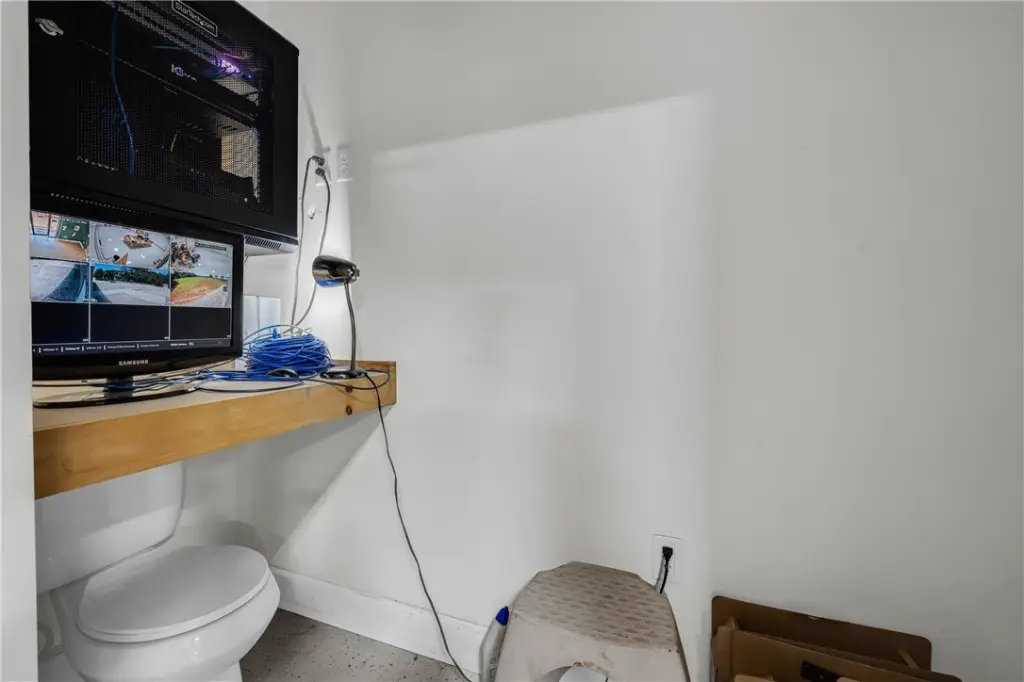
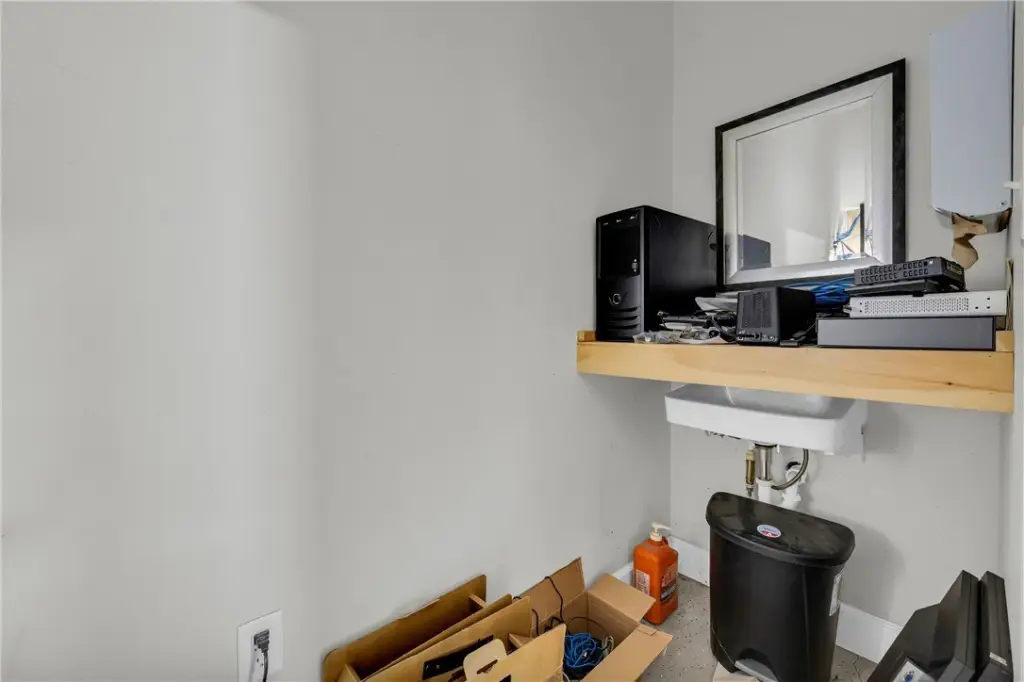
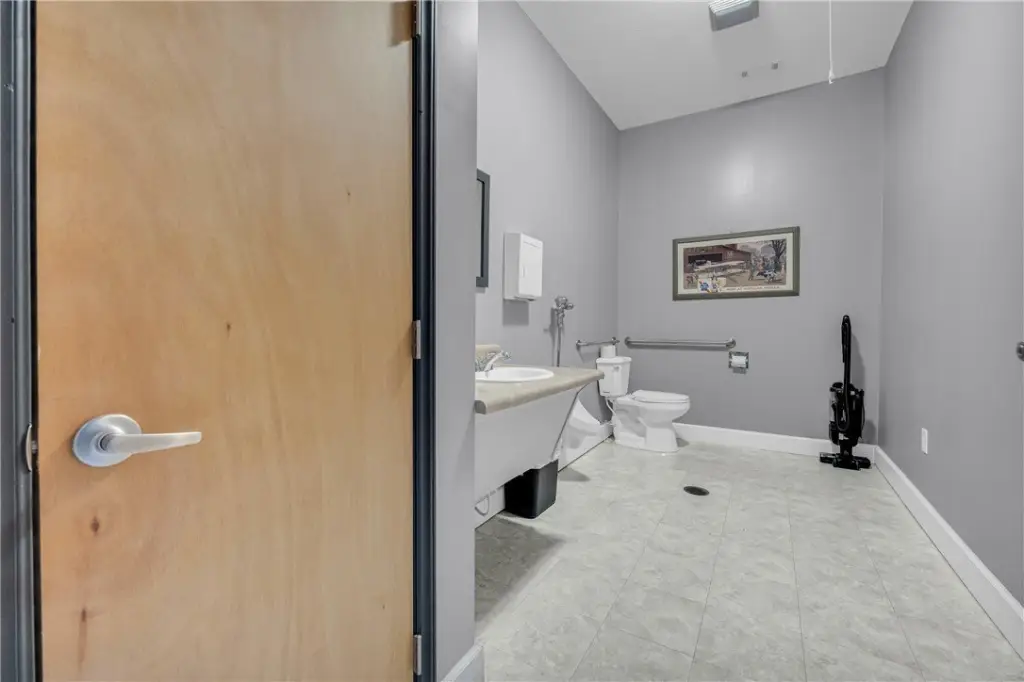
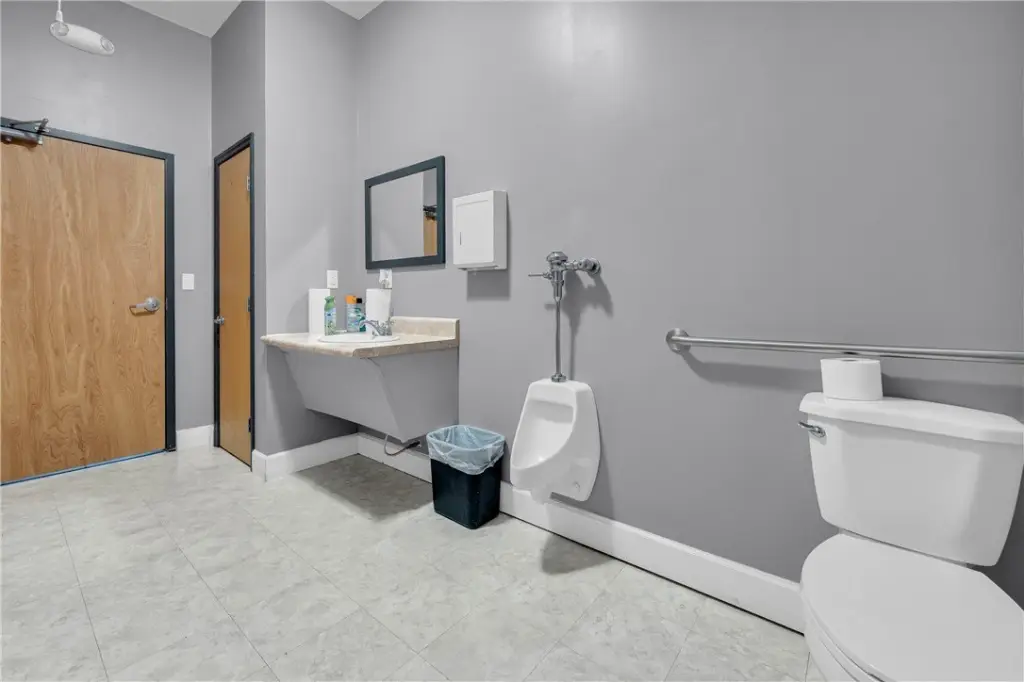
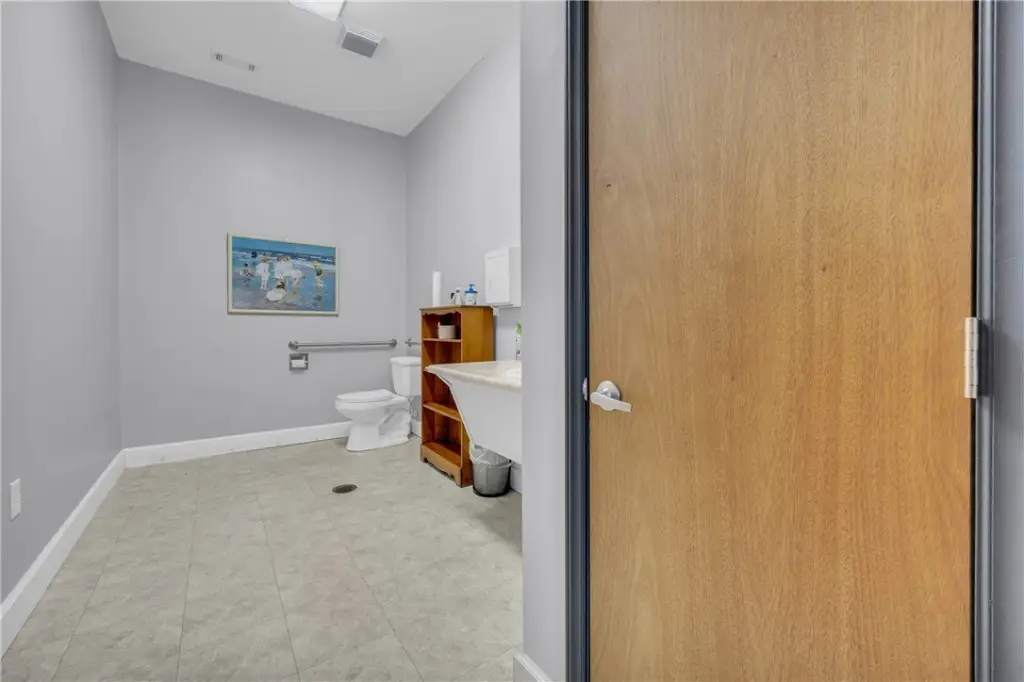
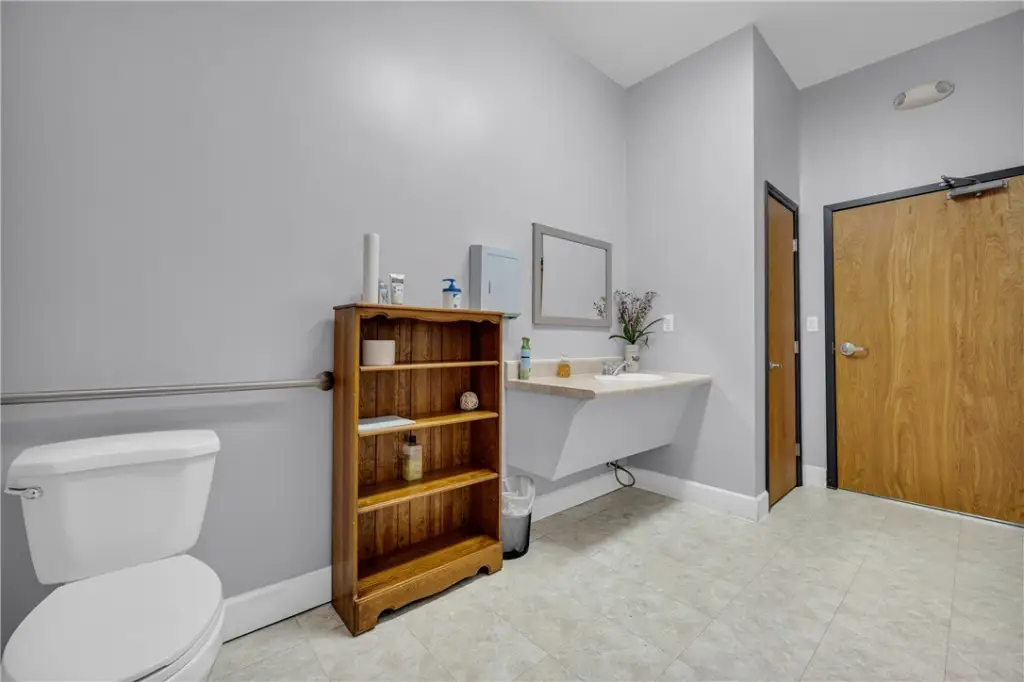
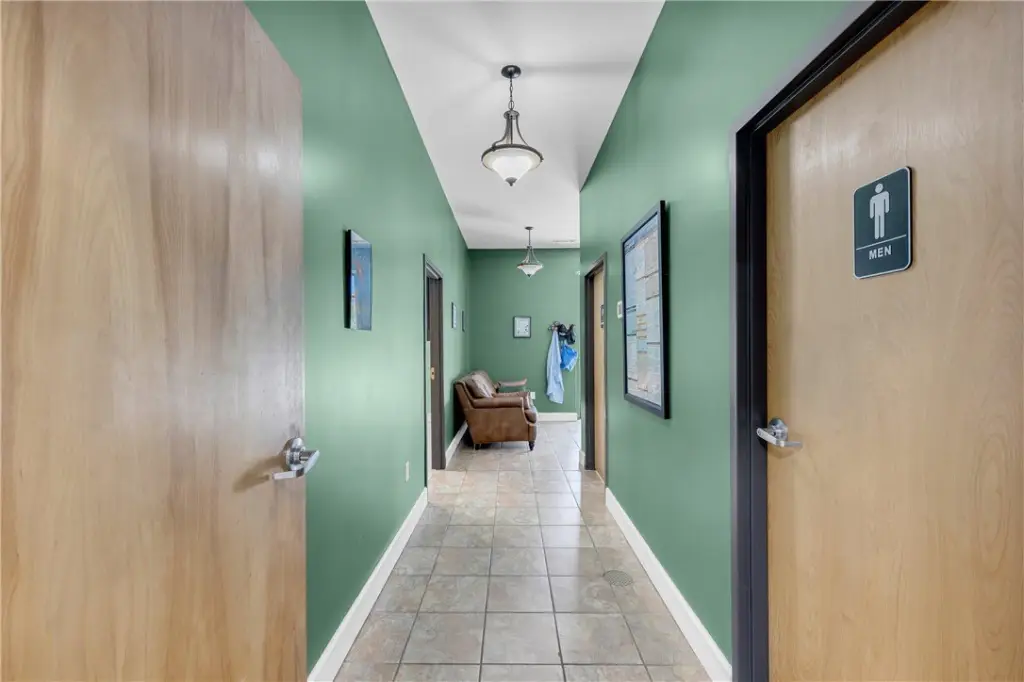
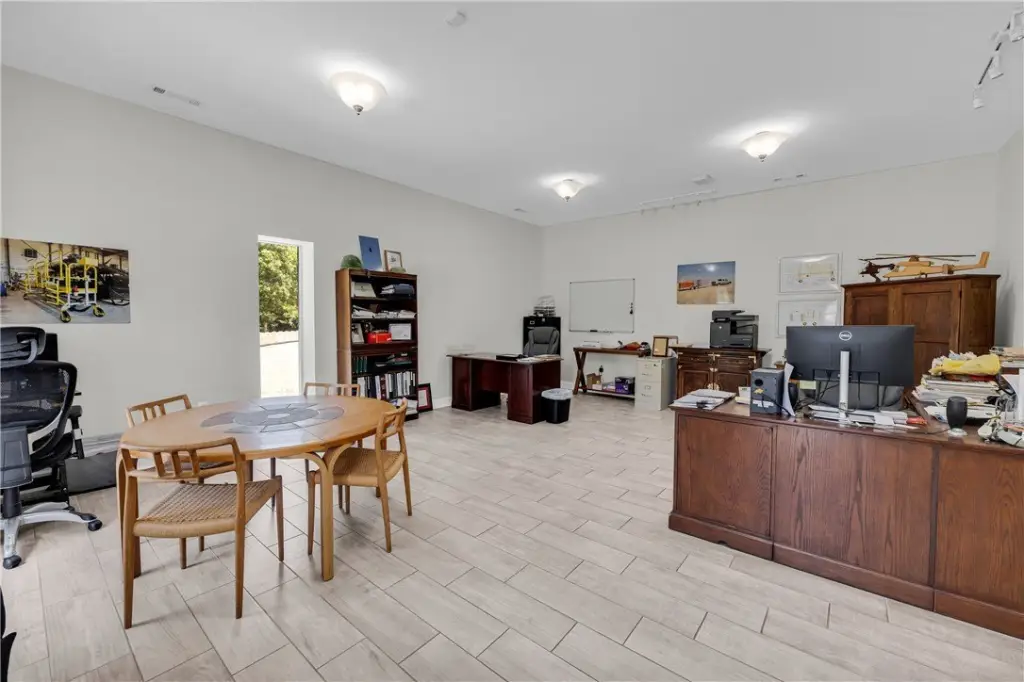
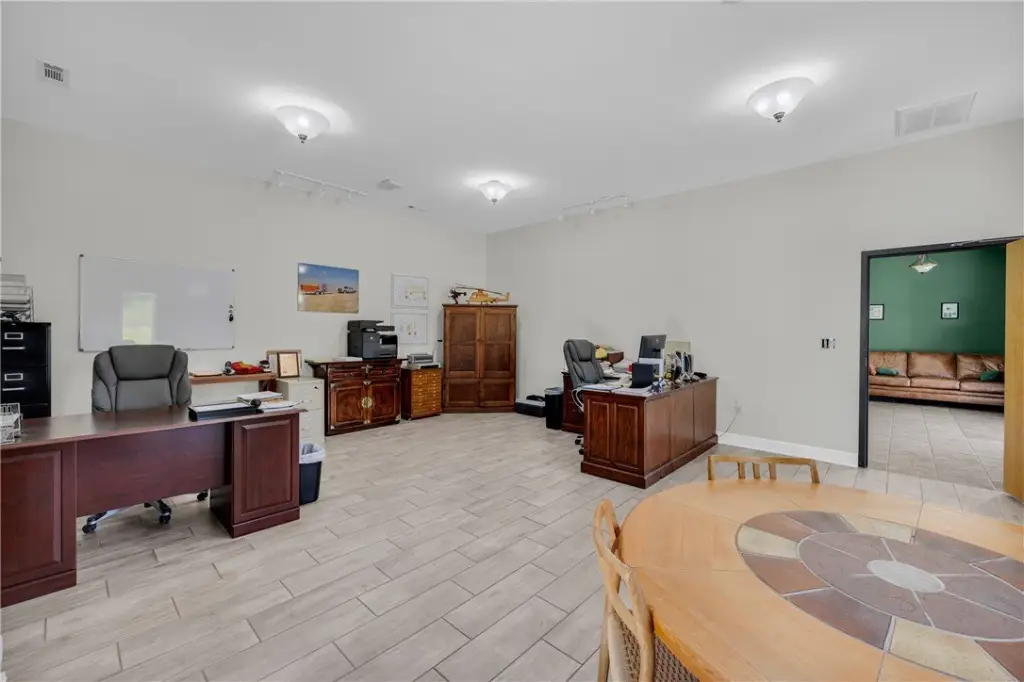
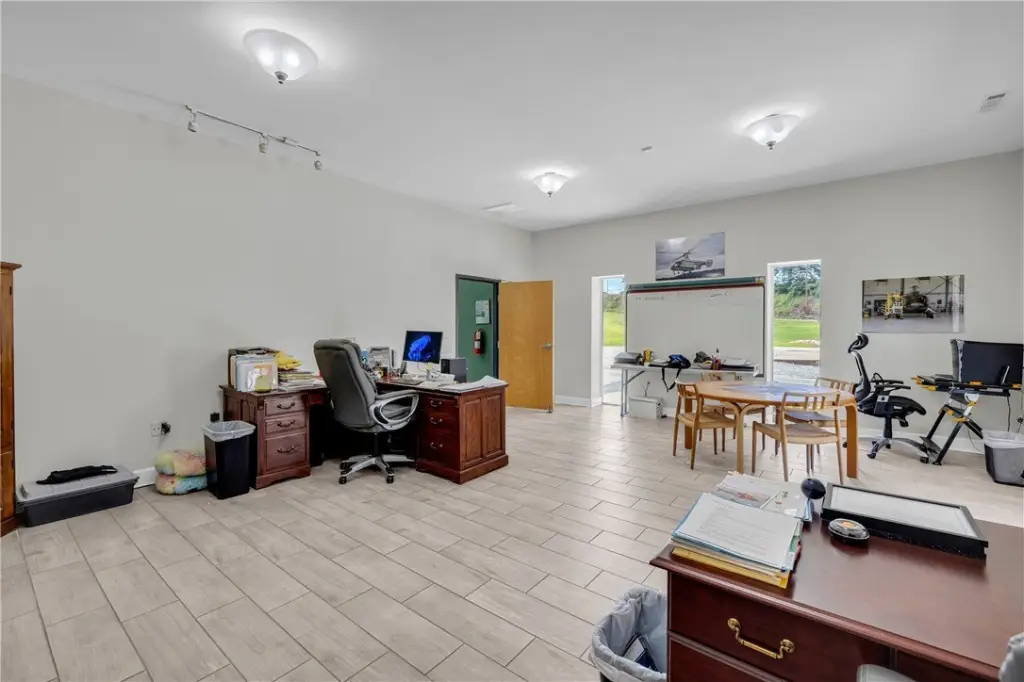
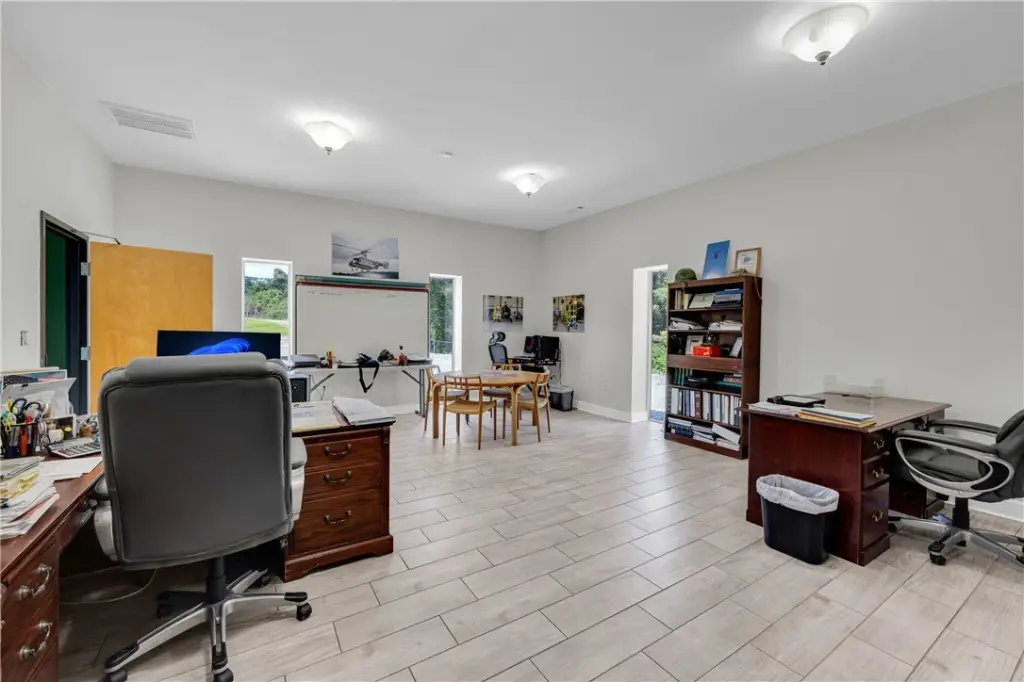
This renovated flex facility contains approximately 5,400 square feet arranged for both office and operational functions. The interior includes private offices, a boardroom, two open work areas, a security office, multiple restrooms, and a warehouse with 16-foot-plus ceilings. A 16-foot drive-in door provides access to the warehouse, which is heated and cooled with air service throughout.
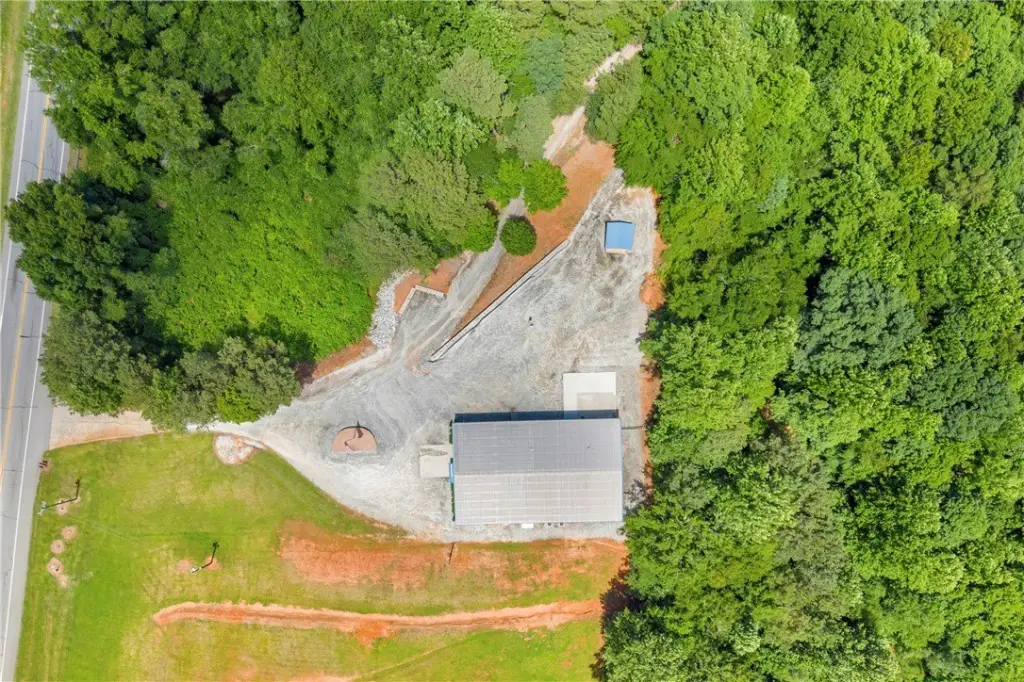
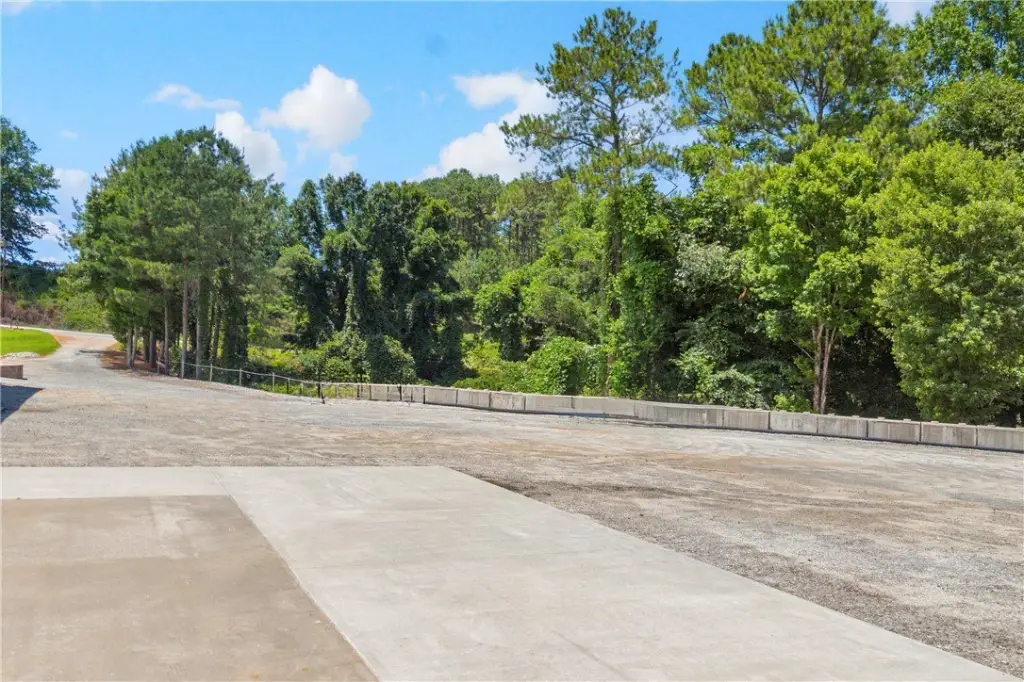
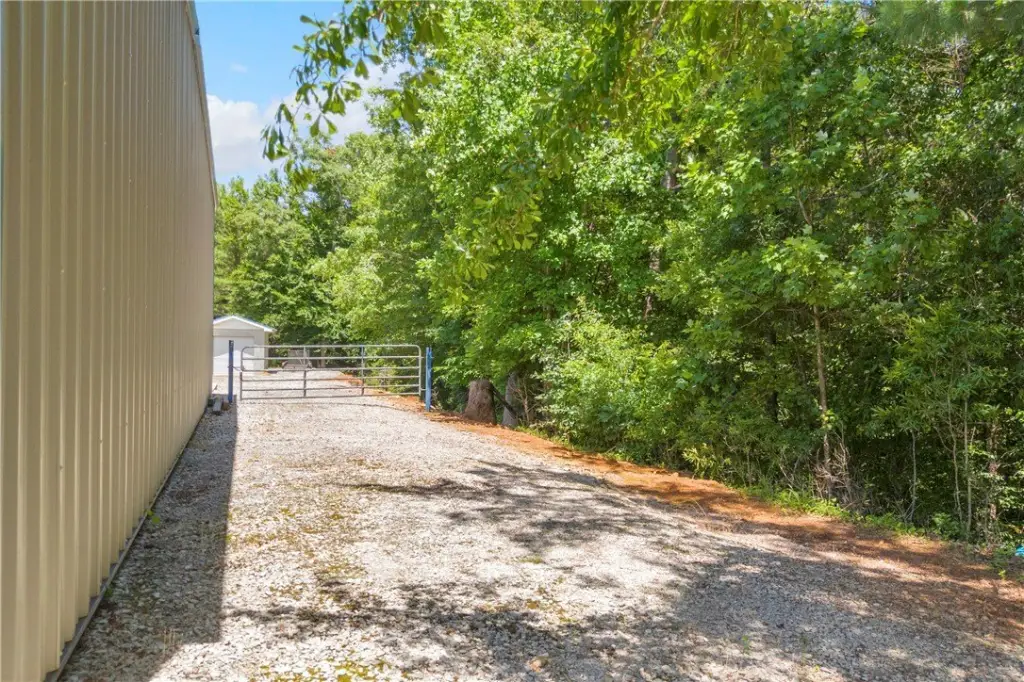
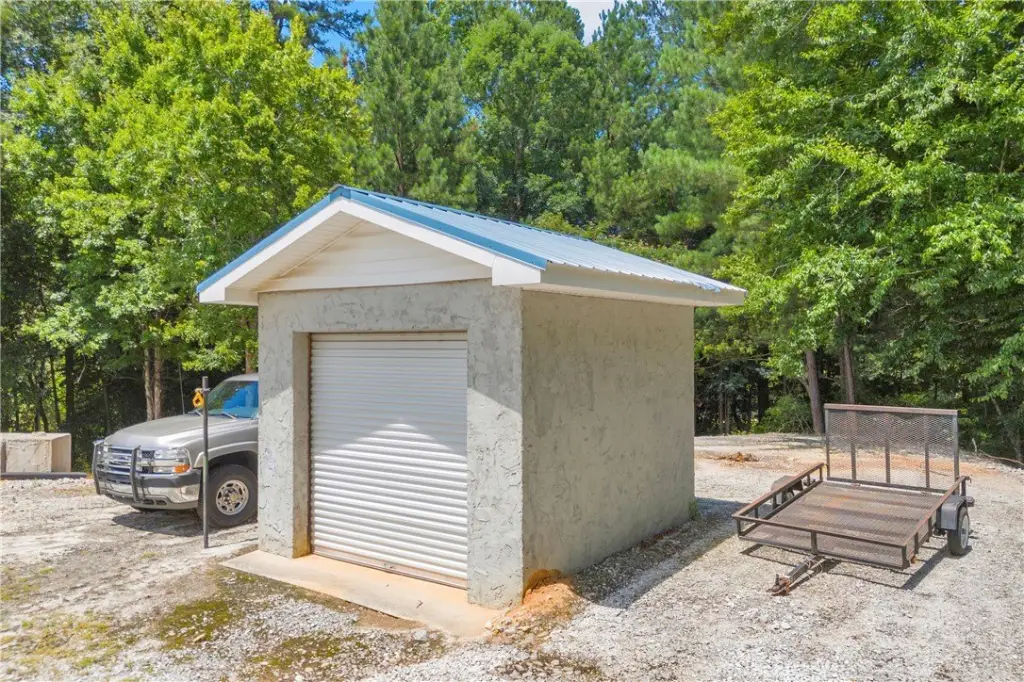
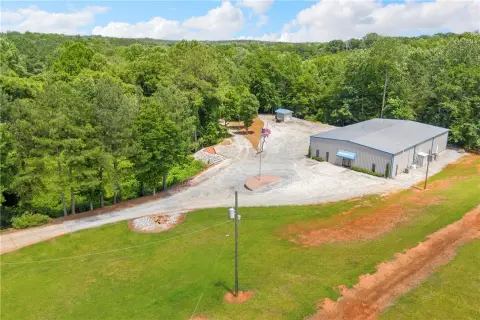
The property occupies 5.07 acres along SC Highway 11 in West Union, with frontage, water access, and a newly installed sewer system serving the rear portion of the site. Additional graded area supports expansion, equipment storage, or separate future development. A large gravel parking area accommodates employee vehicles, fleet vehicles, trailers, and equipment. The corridor records approximately 11,000-plus vehicles per day and connects the property with West Union, Walhalla, Seneca, and surrounding Upstate markets.
The property occupies 5.07 acres along SC Highway 11 in West Union, with frontage, water access, and a newly installed sewer system serving the rear portion of the site. Additional graded area supports expansion, equipment storage, or separate future development. A large gravel parking area accommodates employee vehicles, fleet vehicles, trailers, and equipment. The corridor records approximately 11,000-plus vehicles per day and connects the property with West Union, Walhalla, Seneca, and surrounding Upstate markets.
Key Highlights
- Approximately +/-5,400 SF renovated flex building
- 16'+ ceiling height and 16 ft. drive‑in warehouse door
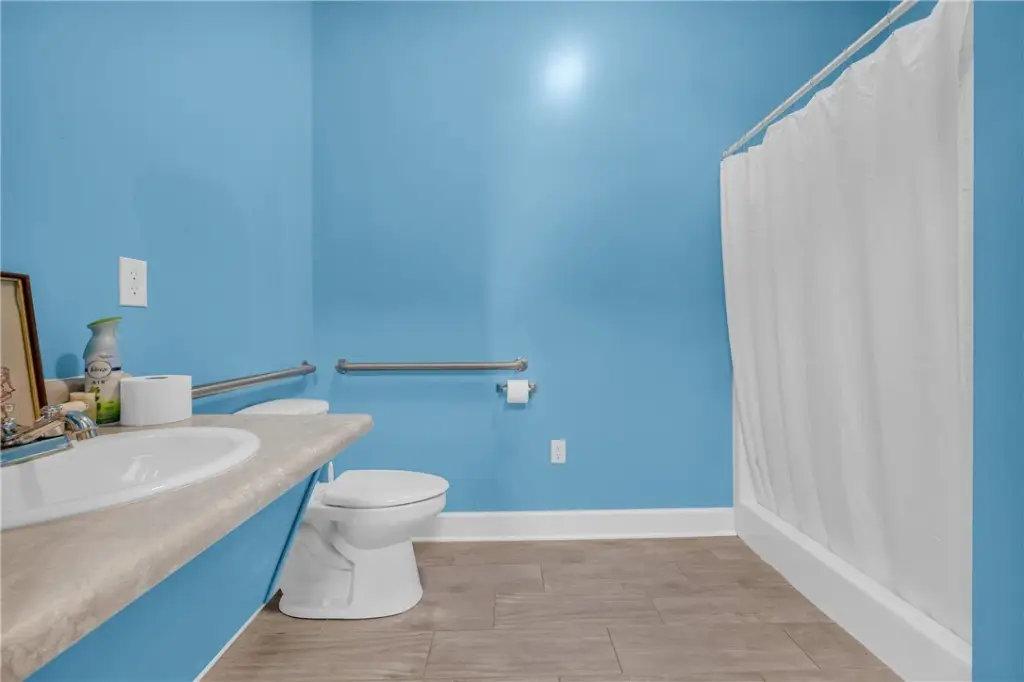
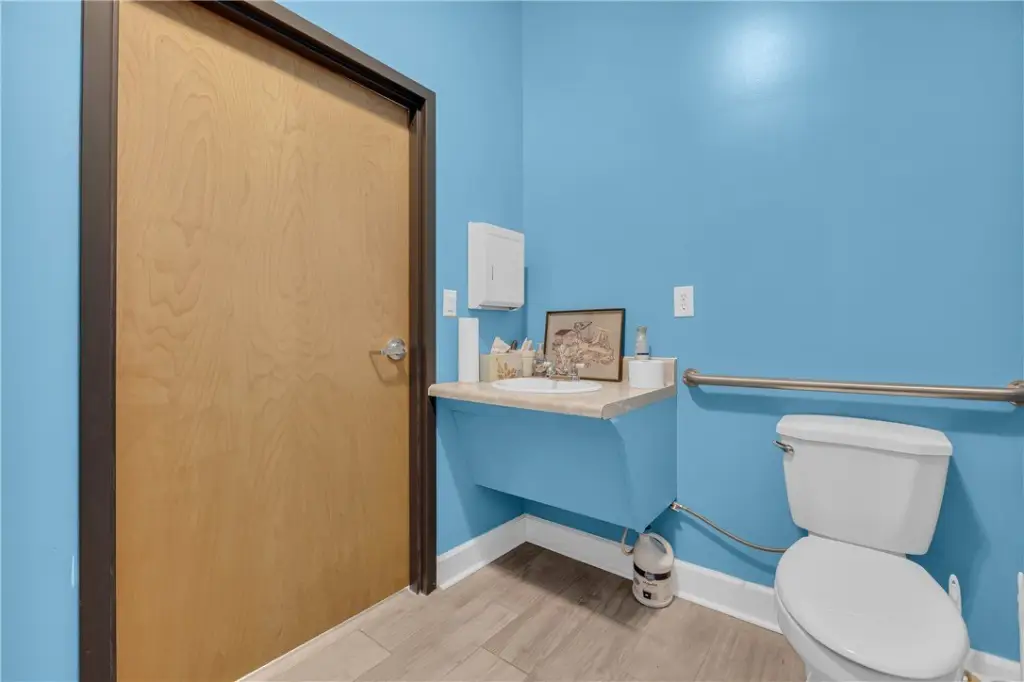
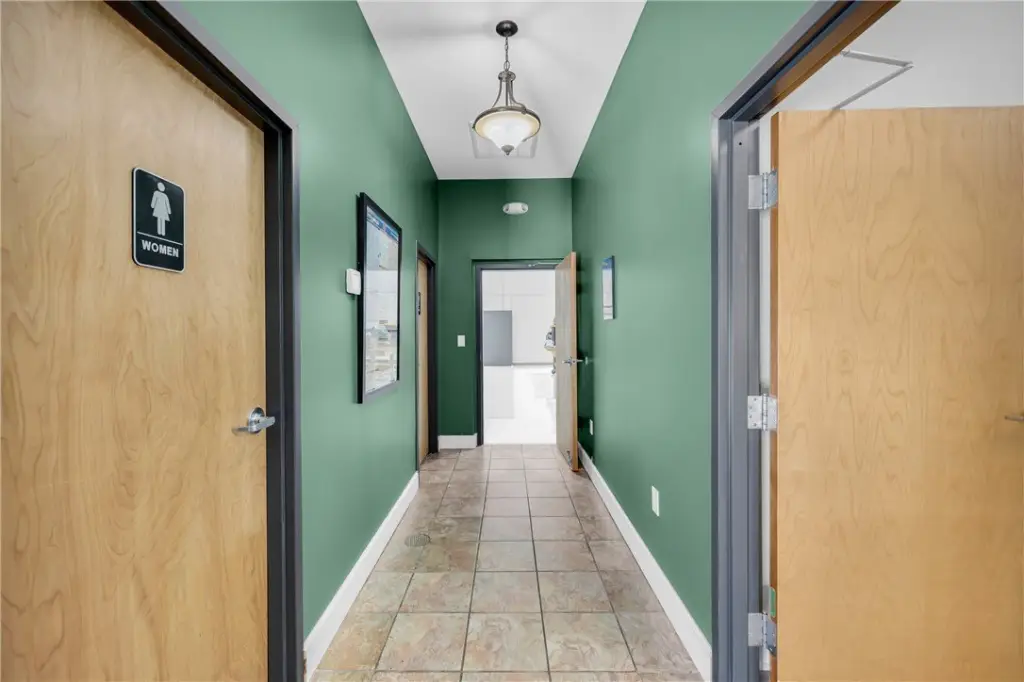
- Private offices, boardroom, two open work areas, security office, and multiple restrooms
Property Analytics
Unlock full access to Insights
Subscribe to Realmo Intelligence
Open Analytics
Current Use
Lease Details
16 ft
Clear height
1
Drive-in doors
Yes
Highway access
Yes
Paved road access
Yes
Utilities to site
Location Intelligence
Trade Area within ½ mile
100
Businesses Nearby
Well-served
Demand for This Use
Explore this area
Business Placement
Demographics for 29696, SC
4,759
Population
2,327
Households
2
Avg Household Size
47
Median Age
29%
College-Educated
91%
High-School Grad
21.9 sq mi
ZIP Area
217
Density / Sq Mi
$77,172
Median Household Income
$40,653
Median Earnings
$681
Median Rent
$184,600
Median Home Value
Check the figures for this property
Cap Rate, Value Estimation, Potential NOI and more
View Realmo Analytics
Market
Vacancy Rate% for Industrial in South region

Questions? Ask Rey
Realmo’s AI knows this listing — price, zoning, demand, history. Ask anything.



Frequently Asked Questions
What type of property is this?
Flex space - Commercial facility combines administrative rooms, operational areas, warehouse capacity, and site infrastructure for multiple business functions.
Where is this flex space located?
The property is located at 450 N Hwy 11 West Union, SC.
What is the asking price?
The asking price for this property is $1,100,000.
What are key features of this property?
This property features: Approximately +/-5,400 SF renovated flex building; 16'+ ceiling height and 16 ft. drive‑in warehouse door; Private offices, boardroom, two open work areas, security office, and multiple restrooms


