Four-Unit Quadplex with Updated
For Sale
$400,000
Pending
441-447 Barnett Road, Columbus, OH 43213
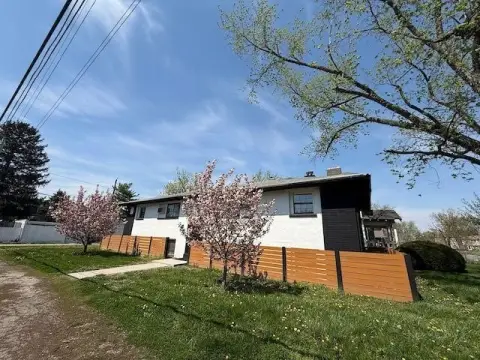
Four residential units offer two bedrooms, one bathroom, basement storage, laundry areas, and rear parking access.
Property Size3,240 SF
Days on Market182
Property Features for 441-447 Barnett Road
General Information
Standard status
Pending
Size
3,240 SF
Property subtype
Multi-Family / Apartment
Net Operating Income
$35,088
Taxes and HOA fees
Annual Taxes
$1,635
Amenities
Forced Air
Gas
No
Building Details
Year Built
1964
Listing Agency:
Vision Realty, Inc.
Listed By:
Donald A Payne · License #2017001048
(614) 414-2062
Source:
Compass
Added: Apr 17
Changed: Oct 12
Last Checked: Oct 15 at 2:01AM
Displayed information is deemed reliable but is not guaranteed and should be independently verified. All listing content including descriptions, pricing, images are the copyrighted material of Vision Realty, Inc.
Investment Insights
Based on property information with market context.
This quadplex contains four two-bedroom, one-bathroom units, with one unit currently vacant for an owner occupant or incoming resident. Interior features include spacious living areas, kitchens with new cabinets, updated bathrooms, forced-air heating, and gas service. Basement areas provide laundry facilities and additional storage. New mechanical systems were installed in 2023.
The property includes rear parking space and a large yard suitable for outdoor use. Located at 441-447 Barnett Road in Columbus, the asset is minutes from Bexley, Whitehall, the airport, and the DSCC Military Base, with shopping, restaurants, coffee shops, and highway access nearby.
The property includes rear parking space and a large yard suitable for outdoor use. Located at 441-447 Barnett Road in Columbus, the asset is minutes from Bexley, Whitehall, the airport, and the DSCC Military Base, with shopping, restaurants, coffee shops, and highway access nearby.
Key Highlights
- Four‑unit quadplex with one vacant unit
- Each unit includes 2 bedrooms and 1 bathroom
- New mechanicals installed in 2023
Financial Insights
Estimated NOI and Cap Rate
NOI / Yr
$27,589
Cap Rate
6.90%
Suggested Prices Based on Cap Rates
Cap Rate 5%
$551,780
$551.8K
Cap Rate 7%
$394,129
$394.1K
Cap Rate 9%
$306,544
$306.5K
Market Conditions
NOI Build-Up for 3,240 SF
Gross rent
$42.4K $13.08/SF
− Vacancy
−$3.0K −$0.92/SF
EGI
$39.4K $12.16/SF
− OpEx
−$11.8K −$3.65/SF
NOI
$27.6K $8.52/SF
Area
Columbus, OH
Vacancy
7.00%
Lease Rate
$13.08 /SF/Yr
Expense Ratio
30.00%
Simulate Cap Rate and NOI
Suggested Prices Based on Cap Rates
Cap Rate 5%
$551,780
Cap Rate 7%
$394,129
Cap Rate 9%
$306,544
Alternative Uses
Best Use
Multifamily LT 5
$394.1K
$344.9K – $459.8K
NOI $27,589 @ 7.0% cap · market cap 6.90%
Second Best
Apartment 5plus
$317.0K
$277.4K – $369.9K
NOI $22,193 @ 7.0% cap · market cap 5.55%
Theoretical Best
Office A
$675.2K
$590.8K – $787.8K
NOI $47,266 @ 7.0% cap · market cap 11.82%
Zoning and permitted uses should be independently verified with authorities.
How Realmo checks its estimates
Property Analytics
Current Use
Location Intelligence
Trade Area within ½ mile
423
Businesses Nearby
Explore this area
Business Placement
Demographics for 43213, OH
35,105
Population
17,069
Households
2.1
Avg Household Size
37
Median Age
23%
College-Educated
90%
High-School Grad
10.3 sq mi
ZIP Area
3,408
Density / Sq Mi
$53,908
Median Household Income
$37,753
Median Earnings
$1,107
Median Rent
$197,700
Median Home Value
Market
Vacancy Rate% for Multifamily in Midwest region

Questions? Ask Rey
Realmo’s AI knows this listing — price, zoning, demand, history. Ask anything.


Frequently Asked Questions
What type of property is this?
Quadplex - Four residential units offer two bedrooms, one bathroom, basement storage, laundry areas, and rear parking access.
Where is this quadplex located?
The property is located at 441-447 Barnett Road Columbus, OH.
What is the asking price?
The asking price for this property is $400,000.
What are key features of this property?
This property features: Four‑unit quadplex with one vacant unit; Each unit includes 2 bedrooms and 1 bathroom; New mechanicals installed in 2023


