Mixed-Use Property with Climate-Controlled
For Sale
$10,200,000
4400 SW 25th Street, Oklahoma City, OK 73108
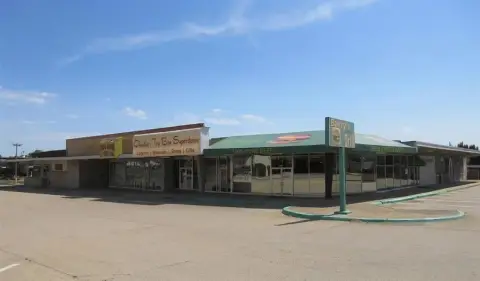
Combined retail and industrial improvements provide separate customer-facing and warehouse components.
Property Size68,000 SF
Price / SF$150
Days on Market231
Property Features for 4400 SW 25th Street
General Information
Standard status
Active
Size
68,000 SF
Property subtype
Warehouse
Site & Location
Corner Location
Yes
Pylon Signage
Yes
Road Access
Yes
Fenced Yard
Yes
Warehouse & Industrial
Clear Height
22 ft
Warehouse Space
54,000 SF
Dock-High Doors
13
Drive-In Doors
2
Heavy Power
Yes
Sprinkler System
Yes
Conditioned Warehouse
Yes
Taxes and HOA fees
Annual Taxes
$35,757
Amenities
fenced
dedicated parking
semi truck turn around access
offices
ample overhead doors
60 tons of hvac
fully racked
Building Details
Building Size
68,000 SF
Year Built
1974
Listing Agency:
InterWest Realty
Listed By:
George Huffman · License #049514
(405) 752-2525
Source:
Stetsonbentley
Added: Feb 24
Changed: Oct 1
Last Checked: Oct 11 at 12:06PM
Displayed information is deemed reliable but is not guaranteed and should be independently verified. All listing content including descriptions, pricing, images are the copyrighted material of InterWest Realty
Investment Insights
Based on property information with market context.
This 68,000 SF mixed-use property combines 14,000 SF of retail space with 54,000 SF of climate-controlled warehouse area. The warehouse component is fully sprinklered, divided into two contiguous 27,000 SF sections, and configured with 22-foot ceiling height, offices, overhead doors, fencing, and dedicated parking. One section includes 60 tons of HVAC and full racking, while the other has more than 1,000 amps and 13,500 SF of open warehouse area.
The property occupies the southeast hard corner of SW 25th Street and Meridian Avenue in Oklahoma City. Warehouse access includes 13 dock-high doors and 2 ramped drive-through doors, along with semi-truck turnaround space. The retail portion includes 57 parking spaces and prominent pylon signage. Built in 1974, the improvements offer infrastructure for manufacturing, distribution, and specialized industrial operations.
The property occupies the southeast hard corner of SW 25th Street and Meridian Avenue in Oklahoma City. Warehouse access includes 13 dock-high doors and 2 ramped drive-through doors, along with semi-truck turnaround space. The retail portion includes 57 parking spaces and prominent pylon signage. Built in 1974, the improvements offer infrastructure for manufacturing, distribution, and specialized industrial operations.
Key Highlights
- 68,000 SF mixed‑use property with 14,000 SF of retail and 54,000 SF of warehouse space
- 54,000 SF warehouse area divided into two contiguous 27,000 SF sections
- Fully climate‑controlled and sprinklered warehouse with 22‑foot ceiling height
Financial Insights
Estimated NOI and Cap Rate
NOI / Yr
$938,400
Cap Rate
9.20%
Suggested Prices Based on Cap Rates
Cap Rate 5%
$18,768,000
$18.8M
Cap Rate 7%
$13,405,714
$13.4M
Cap Rate 9%
$10,426,667
$10.4M
Market Conditions
NOI Build-Up for 68,000 SF
Gross rent
$1.63M $24.00/SF
− Vacancy
−$130.6K −$1.92/SF
EGI
$1.50M $22.08/SF
− OpEx
−$563.0K −$8.28/SF
NOI
$938.4K $13.80/SF
Area
Oklahoma City, OK
Vacancy
8.00%
Lease Rate
$24.00 /SF/Yr
Expense Ratio
37.50%
Simulate Cap Rate and NOI
Suggested Prices Based on Cap Rates
Cap Rate 5%
$18,768,000
Cap Rate 7%
$13,405,714
Cap Rate 9%
$10,426,667
Alternative Uses
Best Use
Retail
$19.18M
$16.78M – $22.37M
NOI $1,342,320 @ 7.0% cap · market cap 13.16%
Second Best
Mixed Use
$13.41M
$11.73M – $15.64M
NOI $938,400 @ 7.0% cap · market cap 9.20%
Theoretical Best
Specialty Retail
$23.26M
$20.35M – $27.13M
NOI $1,627,920 @ 7.0% cap · market cap 15.96%
Zoning and permitted uses should be independently verified with authorities.
How Realmo checks its estimates
Property Analytics
Unlock full access to Insights
Subscribe to Realmo Intelligence
Open Analytics
Current Use
Lease Details
22 ft
Clear height
13
Dock-high doors
2
Drive-in doors
Yes
Heavy power
Yes
Sprinkler system
Yes
Fenced yard
Yes
Paved road access
Location Intelligence
Trade Area within ½ mile
448
Businesses Nearby
Explore this area
Business Placement
Demographics for 73108, OK
14,451
Population
6,221
Households
2.3
Avg Household Size
30
Median Age
4%
College-Educated
56%
High-School Grad
7.6 sq mi
ZIP Area
1,901
Density / Sq Mi
$35,278
Median Household Income
$31,017
Median Earnings
$799
Median Rent
$75,000
Median Home Value
Check the figures for this property
Cap Rate, Value Estimation, Potential NOI and more
View Realmo Analytics
Market
Vacancy Rate% for Industrial in South region

Questions? Ask Rey
Realmo’s AI knows this listing — price, zoning, demand, history. Ask anything.




Frequently Asked Questions
What type of property is this?
Mixed-use property - Combined retail and industrial improvements provide separate customer-facing and warehouse components.
Where is this mixed-use property located?
The property is located at 4400 SW 25th Street Oklahoma City, OK.
What is the asking price?
The asking price for this property is $10,200,000.
What are key features of this property?
This property features: 68,000 SF mixed‑use property with 14,000 SF of retail and 54,000 SF of warehouse space; 54,000 SF warehouse area divided into two contiguous 27,000 SF sections; Fully climate‑controlled and sprinklered warehouse with 22‑foot ceiling height


