Renovated Duplex with Private
For Sale
$729,000
436 W Fountain St, Providence, RI 02903
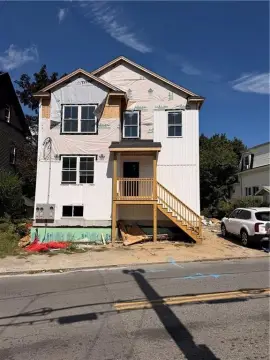
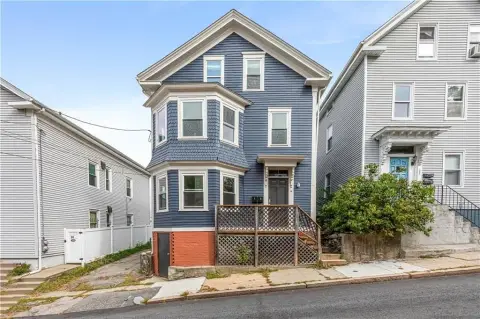
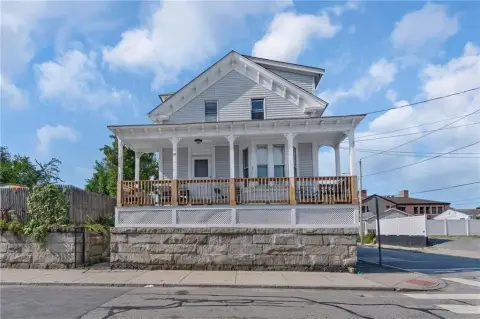
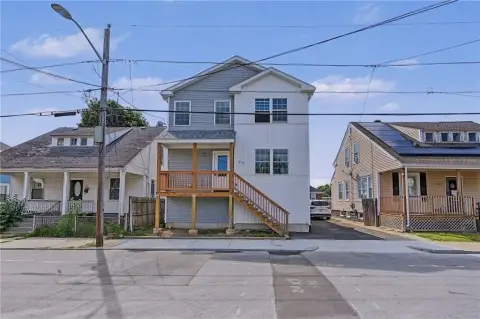
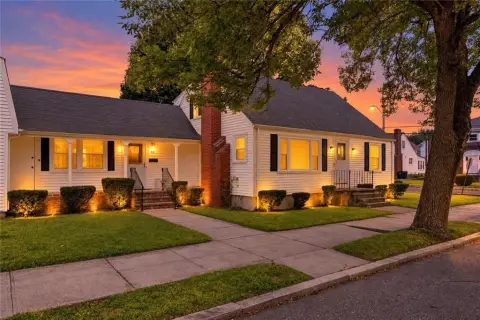
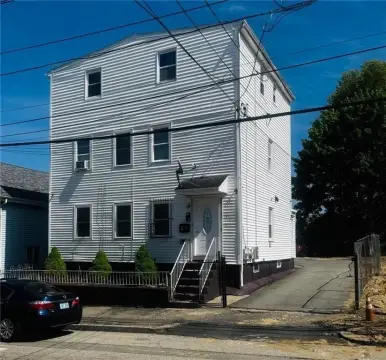
Two-family property with updated systems, separate utilities, basement storage, and tandem driveway parking.
Property Size2,250 SF
Price / SF$324
Days on Market769
Property Features for 436 W Fountain St
General Information
Standard status
Active
Size
2,250 SF
Total Parking Spaces
2
Property subtype
Residential Income
Site & Location
Highway Access
Yes
Road Access
Yes
Public Transit
Yes
Utilities to Site
Yes
Additional Details
Multifamily Units
2
Taxes and HOA fees
Annual Taxes
$7,338
Amenities
private backyard
Building Details
Year Renovated
2020
Buildings
1
Construction
Greek Revival
Listing Agency:
Armory Management Company
(401) 272-2720
Listed By:
Seth Zeren
(401) 286-4783
Source:
Exprealty
Added: Sep 10, 2024
Changed: Oct 15
Last Checked: Oct 16 at 1:43PM
Displayed information is deemed reliable but is not guaranteed and should be independently verified. All listing content including descriptions, pricing, images are the copyrighted material of Armory Management Company

Ask AI about this property
Review the available facts, identify missing information and prepare questions for the agent.
Investment Insights
Based on property information with market context.
Renovated between 2019 and 2020, this 2,250-square-foot Greek Revival duplex contains five bedrooms and three bathrooms across two residential units. Improvements include new building systems, hardwood floors, tiled kitchens with stone countertops, updated stainless steel appliances, modernized bathrooms, fresh paint, new light fixtures, and exposed brick fireplaces in the dining and living rooms.
The basement adds storage and houses on-demand hot water tanks, water submeters for both units, separate gas meters, and individual electric panels. The property also includes a private backyard with established native plantings and a cedar fence. Tandem parking for two cars is available in the driveway, with overnight permit parking on the street through the City of Providence. The home is near West Fountain Street businesses, Urban Greens Co-op Market, Federal Hill, Downtown Providence, I-95, I-195, Route 6, Route 10, Providence Train Station, local bus stops, and Rhode Island T.F. Green International Airport.
The basement adds storage and houses on-demand hot water tanks, water submeters for both units, separate gas meters, and individual electric panels. The property also includes a private backyard with established native plantings and a cedar fence. Tandem parking for two cars is available in the driveway, with overnight permit parking on the street through the City of Providence. The home is near West Fountain Street businesses, Urban Greens Co-op Market, Federal Hill, Downtown Providence, I-95, I-195, Route 6, Route 10, Providence Train Station, local bus stops, and Rhode Island T.F. Green International Airport.
Key Highlights
- Two‑family duplex with 5 bedrooms and 3 bathrooms
- 2,250 SF building renovated between 2019 and 2020
- Separate gas meters and electric panels for both units
Financial Insights
Estimated NOI and Cap Rate
NOI / Yr
$37,994
Cap Rate
5.21%
Suggested Prices Based on Cap Rates
Cap Rate 5%
$759,880
$759.9K
Cap Rate 7%
$542,771
$542.8K
Cap Rate 9%
$422,156
$422.2K
Market Conditions
NOI Build-Up for 2,250 SF
Gross rent
$58.1K $25.80/SF
− Vacancy
−$3.8K −$1.68/SF
EGI
$54.3K $24.12/SF
− OpEx
−$16.3K −$7.24/SF
NOI
$38.0K $16.89/SF
Area
Providence, RI
Vacancy
6.50%
Lease Rate
$25.80 /SF/Yr
Expense Ratio
30.00%
Simulate Cap Rate and NOI
Suggested Prices Based on Cap Rates
Cap Rate 5%
$759,880
Cap Rate 7%
$542,771
Cap Rate 9%
$422,156
Alternative Uses
Best Use
Multifamily LT 5
$542.8K
$474.9K – $633.2K
NOI $37,994 @ 7.0% cap · market cap 5.21%
Second Best
Apartment 5plus
$487.5K
$426.6K – $568.8K
NOI $34,127 @ 7.0% cap · market cap 4.68%
Theoretical Best
Office A
$752.7K
$658.7K – $878.2K
NOI $52,692 @ 7.0% cap · market cap 7.23%
Zoning and permitted uses should be independently verified with authorities.
How Realmo checks its estimates
Property Analytics
Unlock full access to Insights
Subscribe to Realmo Intelligence
Open Analytics
Current Use
Lease Details
2
Residential units
Yes
Highway access
Yes
Paved road access
Yes
Utilities to site
Location Intelligence
Trade Area within ½ mile
2,736
Businesses Nearby
Explore this area
Business Placement
Demographics for 02903, RI
13,264
Population
6,588
Households
2
Avg Household Size
33
Median Age
53%
College-Educated
89%
High-School Grad
1.7 sq mi
ZIP Area
7,802
Density / Sq Mi
$62,987
Median Household Income
$40,294
Median Earnings
$1,640
Median Rent
$365,600
Median Home Value
Check the figures for this property
Cap Rate, Value Estimation, Potential NOI and more
View Realmo Analytics
Market
Vacancy Rate% for Multifamily in Northeast region






Frequently Asked Questions
What type of property is this?
Duplex - Two-family property with updated systems, separate utilities, basement storage, and tandem driveway parking.
Where is this duplex located?
The property is located at 436 W Fountain St Providence, RI.
What is the asking price?
The asking price for this property is $729,000.
What are key features of this property?
This property features: Two‑family duplex with 5 bedrooms and 3 bathrooms; 2,250 SF building renovated between 2019 and 2020; Separate gas meters and electric panels for both units


