Rooftop Restaurant Development
For Sale
$1,100,000
436 Harrison Ave Unit 400, Panama City, FL 32401
Elevated commercial space with utility connections and access via two staircases and an elevator.
Property Size26,400 SF
Price / SF$41.67
Days on Market96
Property Features for 436 Harrison Ave Unit 400
General Information
Standard status
Active
Size
26,400 SF
Property subtype
Commercial
Additional Details
Utilities to Site
Yes
Building Details
Year Built
1939
Construction
poured concrete
Listing Agency:
Counts Real Estate Group Inc
Listed By:
Chris S McCall · License #0666647
(850) 814-9889
Source:
Panhandlehomelistings
Added: Jul 6
Changed: Oct 1
Last Checked: Oct 7 at 12:57PM
Displayed information is deemed reliable but is not guaranteed and should be independently verified. All listing content including descriptions, pricing, images are the copyrighted material of Counts Real Estate Group Inc
Investment Insights
Based on property information with market context.
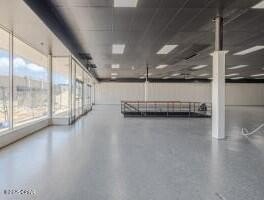
The rooftop of the Mashburn Building offers approximately 6,000 square feet for restaurant or bar development. Access is provided by two staircases and one elevator. The underlying structure uses poured concrete from the foundation through the roof, with additional steel reinforcement installed in recent years. Its design can support multiple stories, including potential residential construction above a commercial concept.
Major utilities needed for a restaurant, bar, or additional residential units are stubbed to the rooftop for connection. Preliminary plans for a rooftop restaurant and bar are available for reference, subject to completion by a licensed architect and structural engineer. The elevated position provides views extending across downtown Panama City and toward the Hathaway Bridge, Saint Andrews, Thomas Drive, Front Beach Road, Tyndall Air Force Base, and Callaway. Shared downtown parking is available for the project and its customers.
Major utilities needed for a restaurant, bar, or additional residential units are stubbed to the rooftop for connection. Preliminary plans for a rooftop restaurant and bar are available for reference, subject to completion by a licensed architect and structural engineer. The elevated position provides views extending across downtown Panama City and toward the Hathaway Bridge, Saint Andrews, Thomas Drive, Front Beach Road, Tyndall Air Force Base, and Callaway. Shared downtown parking is available for the project and its customers.
Key Highlights
- Approximately 6,000‑square‑foot rooftop available for restaurant or bar development
- Poured‑concrete construction with additional steel reinforcement installed in recent years
- Access includes two staircases and one elevator
Property Analytics
Unlock full access to Insights
Subscribe to Realmo Intelligence
Open Analytics
Current Use
Lease Details
Yes
Utilities to site
Location Intelligence
Trade Area within ½ mile
1,511
Businesses Nearby
15k
Monthly Visits Nearby
Under-served
Demand for This Use
Explore this area
Business Placement
Foot Traffic Nearby
Shops & Services 57%
Hotels & Casinos 39%
Home Improvements & Furnishings 4%
Hotel Indigo
Hotels & Casinos
6,030 visits/mo
0.3 miles
Dollar General
Shops & Services
3,443 visits/mo
0.1 miles
Family Dollar
Shops & Services
2,704 visits/mo
0.2 miles
Regions Bank
Shops & Services
2,560 visits/mo
0.4 miles
City Electric Supply
Home Improvements & Furnishings
544 visits/mo
0.3 miles
Demographics for 32401, FL
20,487
Population
10,239
Households
2
Avg Household Size
42
Median Age
20%
College-Educated
86%
High-School Grad
12.5 sq mi
ZIP Area
1,639
Density / Sq Mi
$49,901
Median Household Income
$35,885
Median Earnings
$1,194
Median Rent
$207,000
Median Home Value
Check the figures for this property
Cap Rate, Value Estimation, Potential NOI and more
View Realmo Analytics
Market
Vacancy Rate% for Retail in South region

Questions? Ask Rey
Realmo’s AI knows this listing — price, zoning, demand, history. Ask anything.







Frequently Asked Questions
What type of property is this?
Conventional restaurant - Elevated commercial space with utility connections and access via two staircases and an elevator.
Where is this conventional restaurant located?
The property is located at 436 Harrison Ave Unit 400 Panama City, FL.
What is the asking price?
The asking price for this property is $1,100,000.
What are key features of this property?
This property features: Approximately 6,000‑square‑foot rooftop available for restaurant or bar development; Poured‑concrete construction with additional steel reinforcement installed in recent years; Access includes two staircases and one elevator