Updated Duplex with Two-Bay
For Sale
$209,900
Pending
433 Vann Street, Syracuse, NY 13206
Two matching two-bedroom units offer individual laundry, enclosed sun porches, and substantial system upgrades.
Property Size1,920 SF
Days on Market61
Property Features for 433 Vann Street
General Information
Standard status
Pending
Size
1,920 SF
Property subtype
Duplex
Site & Location
Highway Access
Yes
Road Access
Yes
Units
Unit Mix
2 x 2BR
Multifamily Units
2
Taxes and HOA fees
Annual Taxes
$3,275
Amenities
enclosed sun porches
laundry units
extended driveway
large 2-bay garage
large grassy double lot
paver patio
Building Details
Building Size
1,920 SF
Year Built
1923
Buildings
1
Listing Agency:
Candy Costa Real Estate LLC
Listed By:
Christina Dischiave · License #10401345577
(315) 505-6609
Source:
Griffith-realty
Added: Aug 20
Changed: Oct 14
Last Checked: Oct 16 at 4:01PM
Displayed information is deemed reliable but is not guaranteed and should be independently verified. All listing content including descriptions, pricing, images are the copyrighted material of Candy Costa Real Estate LLC

Ask AI about this property
Review the available facts, identify missing information and prepare questions for the agent.
Investment Insights
Based on property information with market context.
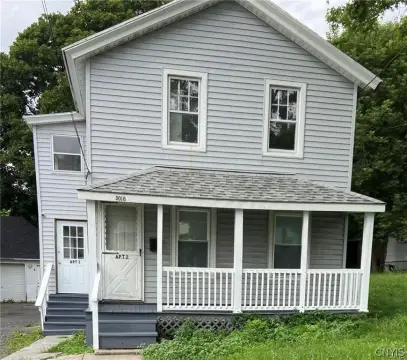
Built in 1923, this duplex contains two matching units, each with two bedrooms, spacious rooms, original hardwood flooring and trim, and an enclosed sun porch. Each unit has its own laundry setup in the clean, dry basement. Major improvements include replacement of the roof, mechanical systems, plumbing, electrical components, and bathrooms.
Outside, the property includes an extended driveway, a large two-bay garage, a paver patio, and a grassy double lot. The rear of the lot is fenced along a golf course. Set on a quiet dead-end street, the property also provides access to Route 690 and downtown Syracuse.
Outside, the property includes an extended driveway, a large two-bay garage, a paver patio, and a grassy double lot. The rear of the lot is fenced along a golf course. Set on a quiet dead-end street, the property also provides access to Route 690 and downtown Syracuse.
Key Highlights
- Two matching 2‑bedroom units
- Original hardwood floors and trim in both units
- Individual laundry units located in the basement
Financial Insights
Estimated NOI and Cap Rate
NOI / Yr
$18,128
Cap Rate
8.64%
Suggested Prices Based on Cap Rates
Cap Rate 5%
$362,560
$362.6K
Cap Rate 7%
$258,971
$259.0K
Cap Rate 9%
$201,422
$201.4K
Market Conditions
NOI Build-Up for 1,920 SF
Gross rent
$35.3K $18.36/SF
− Vacancy
−$2.3K −$1.19/SF
EGI
$33.0K $17.17/SF
− OpEx
−$14.8K −$7.72/SF
NOI
$18.1K $9.44/SF
Area
Syracuse, NY
Vacancy
6.50%
Lease Rate
$18.36 /SF/Yr
Expense Ratio
45.00%
Simulate Cap Rate and NOI
Suggested Prices Based on Cap Rates
Cap Rate 5%
$362,560
Cap Rate 7%
$258,971
Cap Rate 9%
$201,422
Alternative Uses
Best Use
Multifamily LT 5
$291.8K
$255.4K – $340.5K
NOI $20,429 @ 7.0% cap · market cap 9.73%
Second Best
Apartment 5plus
$259.0K
$226.6K – $302.1K
NOI $18,128 @ 7.0% cap · market cap 8.64%
Theoretical Best
Office A
$333.7K
$292.0K – $389.3K
NOI $23,357 @ 7.0% cap · market cap 11.13%
Zoning and permitted uses should be independently verified with authorities.
How Realmo checks its estimates
Property Analytics
Unlock full access to Insights
Subscribe to Realmo Intelligence
Open Analytics
Lease Details
2
Residential units
Yes
Highway access
Yes
Paved road access
Location Intelligence
Trade Area within ½ mile
560
Businesses Nearby
Explore this area
Business Placement
Demographics for 13206, NY
16,599
Population
8,460
Households
2
Avg Household Size
38
Median Age
27%
College-Educated
90%
High-School Grad
4.1 sq mi
ZIP Area
4,049
Density / Sq Mi
$60,314
Median Household Income
$40,429
Median Earnings
$952
Median Rent
$130,300
Median Home Value
Check the figures for this property
Cap Rate, Value Estimation, Potential NOI and more
View Realmo Analytics
Market
Vacancy Rate% for Multifamily in Northeast region




Frequently Asked Questions
What type of property is this?
Duplex - Two matching two-bedroom units offer individual laundry, enclosed sun porches, and substantial system upgrades.
Where is this duplex located?
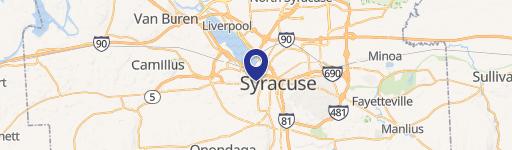
The property is located at 433 Vann Street Syracuse, NY.
What is the asking price?
The asking price for this property is $209,900.
What are key features of this property?
This property features: Two matching 2‑bedroom units; Original hardwood floors and trim in both units; Individual laundry units located in the basement


