Warehouse and Athletic Training
For Sale
$6,000,000
4309 W Us Highway 83, McAllen, TX 78501
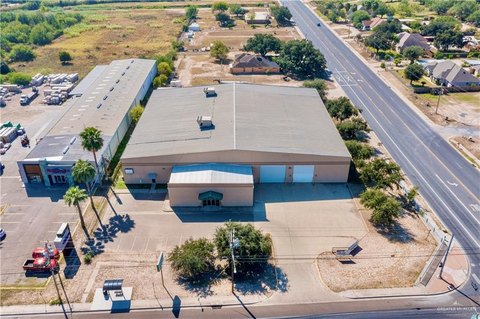
Mixed-use warehouse and fully equipped gym/training center with 22-foot clear height and multiple roll-up doors.
Property Size27,750 SF
Lot Size2.50 Acres
Price / SF$216.22
Days on Market349
Property Features for 4309 W Us Highway 83
General Information
Standard status
Active
Size
27,750 SF
Lot size
2.50 Acres
Site & Location
Highway Access
Yes
Road Access
Yes
Warehouse & Industrial
Clear Height
22 ft
Drive-In Doors
4
Additional Details
Business Included
Yes
Taxes and HOA fees
Annual Taxes
$45,512
Listing Agency:
Encore Fine Properties
(956) 821-6170
Listed By:
Martie Martinez
(956) 393-7365
Source:
Exprealty
Added: Nov 7, 2025
Changed: Oct 4
Last Checked: Oct 21 at 12:35AM
Displayed information is deemed reliable but is not guaranteed and should be independently verified. All listing content including descriptions, pricing, images are the copyrighted material of Encore Fine Properties

Ask AI about this property
Review the available facts, identify missing information and prepare questions for the agent.
Investment Insights
Based on property information with market context.
This exceptional mixed-use commercial facility combines a warehouse with a fully equipped athletic gym and training center in a flexible, divisible layout. The building features 22-foot clear ceiling height, concrete floors, HVAC throughout, and four roll-up doors. The gym/training area includes 22-foot ceilings, a full-size hardwood basketball court, a volleyball training area, a martial arts room, and a weight training area with equipment. Additional amenities include an incline ramp for training, private men’s and women’s restrooms, and a retail/office front area.
The property is located along W. Bus. Hwy 83 with convenient access on Bentsen Rd, and it is close to Interstate Hwy 2. The site offers great visibility and is described as having a high traffic count. A separate 2,684-square-foot brick home on the property includes 4 bedrooms and 3 bathrooms, with some recent updates.
With both warehouse functionality and specialized training improvements already in place, the facility can fit operators seeking sports and fitness use, tenants needing a high-clearance warehouse environment, or buyers considering redevelopment options. Its adaptable configuration and on-site residential component add additional flexibility for a range of commercial planning approaches.
The property is located along W. Bus. Hwy 83 with convenient access on Bentsen Rd, and it is close to Interstate Hwy 2. The site offers great visibility and is described as having a high traffic count. A separate 2,684-square-foot brick home on the property includes 4 bedrooms and 3 bathrooms, with some recent updates.
With both warehouse functionality and specialized training improvements already in place, the facility can fit operators seeking sports and fitness use, tenants needing a high-clearance warehouse environment, or buyers considering redevelopment options. Its adaptable configuration and on-site residential component add additional flexibility for a range of commercial planning approaches.
Key Highlights
- 29,550 SF mixed‑use building on 2.5+ acres with 22‑foot clear ceiling height and HVAC throughout
- Warehouse space includes four roll‑up doors, concrete floors, and a flexible, divisible layout
- Fully equipped gym/training areas with 22‑foot ceilings, full‑size hardwood basketball court, and volleyball training area
Financial Insights
Estimated NOI and Cap Rate
NOI / Yr
$204,645
Cap Rate
3.41%
Suggested Prices Based on Cap Rates
Cap Rate 5%
$4,092,900
$4.1M
Cap Rate 7%
$2,923,500
$2.9M
Cap Rate 9%
$2,273,833
$2.3M
Market Conditions
NOI Build-Up for 27,750 SF
Gross rent
$249.8K $9.00/SF
− Vacancy
−$9.0K −$0.32/SF
EGI
$240.8K $8.68/SF
− OpEx
−$36.1K −$1.30/SF
NOI
$204.6K $7.37/SF
Area
McAllen, TX
Vacancy
3.60%
Lease Rate
$9.00 /SF/Yr
Expense Ratio
15.00%
Simulate Cap Rate and NOI
Suggested Prices Based on Cap Rates
Cap Rate 5%
$4,092,900
Cap Rate 7%
$2,923,500
Cap Rate 9%
$2,273,833
Alternative Uses
Best Use
Warehouse
$2.92M
$2.56M – $3.41M
NOI $204,645 @ 7.0% cap · market cap 3.41%
Second Best
Flex RnD
$2.46M
$2.15M – $2.87M
NOI $171,926 @ 7.0% cap · market cap 2.87%
Theoretical Best
Office A
$7.54M
$6.59M – $8.79M
NOI $527,472 @ 7.0% cap · market cap 8.79%
Zoning and permitted uses should be independently verified with authorities.
How Realmo checks its estimates
Property Analytics
Who owns this building?
See the owner, sales and loan history
Open Analytics
Current Use
Lease Details
22 ft
Clear height
4
Drive-in doors
Turnkey business
Opportunity
Yes
Highway access
Yes
Paved road access
Location Intelligence
Trade Area within ½ mile
375
Businesses Nearby
Under-served
Demand for This Use
Explore this area
Business Placement
Demographics for 78501, TX
60,817
Population
24,807
Households
2.5
Avg Household Size
37
Median Age
27%
College-Educated
77%
High-School Grad
15.5 sq mi
ZIP Area
3,924
Density / Sq Mi
$49,451
Median Household Income
$29,092
Median Earnings
$943
Median Rent
$149,000
Median Home Value
Check the figures for this property
Cap Rate, Value Estimation, Potential NOI and more
View Realmo Analytics
Market
Vacancy Rate% for Industrial in South region


Frequently Asked Questions
What type of property is this?
Flex space - Mixed-use warehouse and fully equipped gym/training center with 22-foot clear height and multiple roll-up doors.
Where is this flex space located?
The property is located at 4309 W Us Highway 83 McAllen, TX.
What is the asking price?
The asking price for this property is $6,000,000.
What are key features of this property?
This property features: 29,550 SF mixed‑use building on 2.5+ acres with 22‑foot clear ceiling height and HVAC throughout; Warehouse space includes four roll‑up doors, concrete floors, and a flexible, divisible layout; Fully equipped gym/training areas with 22‑foot ceilings, full‑size hardwood basketball court, and volleyball training area


