Two-Family Home with Updated
For Sale
$289,900
427 Zion, Hartford, CT 06106
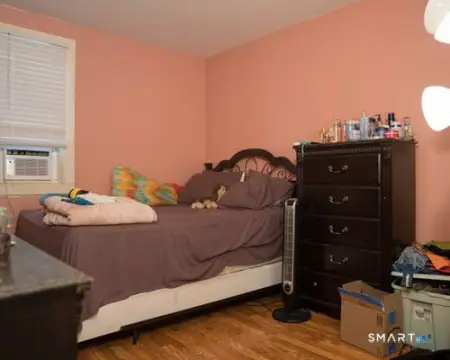
Well-maintained two-family residence featuring newer boilers, recent interior updates, and a full basement for added storage.
Property Size1,488 SF
Price / SF$194.83
Days on Market110
Property Features for 427 Zion
General Information
Standard status
Active
Size
1,488 SF
Property subtype
2 Family
Additional Details
Highway Access
Yes
Multifamily Units
2
Building Details
Year Built
1820
Listing Agency:
Carbutti & Co., Realtors
(203) 269-4910
Listed By:
Michael Mitchell · License #RES.0818939
(860) 796-0151
Source:
Lockandkeyre
Added: Jun 26
Changed: Oct 11
Last Checked: Oct 12 at 8:40PM
Displayed information is deemed reliable but is not guaranteed and should be independently verified. All listing content including descriptions, pricing, images are the copyrighted material of Carbutti & Co., Realtors
Investment Insights
Based on property information with market context.
This two-family home offers two separate living units within an approximately 1,488-square-foot total layout, with 4 bedrooms and 2 full bathrooms. Recent interior improvements include new flooring and interior paint completed within the last three years. The home is equipped with gas-fired hot water heat and features vinyl siding and an asphalt shingle roof. A full basement provides additional storage space. The property also benefits from updated major mechanicals, including boilers installed a few years ago.
The property is located near downtown Hartford and within convenient reach of shopping, restaurants, public transportation, parks, schools, and major highways. This central convenience can support a range of day-to-day needs for occupants and simplifies tenant accessibility.
The configuration is well-suited for an investor seeking rental income from a two-unit structure, or for an owner-occupant looking to offset housing costs by living in one unit and renting the other. With the interior refresh and mechanical updates already in place, the home provides a practical option for buyers who want a turn-key starting point and dependable core systems, supported by the added storage offered by the basement.
The property is located near downtown Hartford and within convenient reach of shopping, restaurants, public transportation, parks, schools, and major highways. This central convenience can support a range of day-to-day needs for occupants and simplifies tenant accessibility.
The configuration is well-suited for an investor seeking rental income from a two-unit structure, or for an owner-occupant looking to offset housing costs by living in one unit and renting the other. With the interior refresh and mechanical updates already in place, the home provides a practical option for buyers who want a turn-key starting point and dependable core systems, supported by the added storage offered by the basement.
Key Highlights
- Two‑family home built in 1820 with approximately 1,488 SF of living space
- 4 bedrooms and 2 full bathrooms across the two‑family layout
- Recent interior updates include new flooring and interior paint completed within the last 3 years
Financial Insights
Estimated NOI and Cap Rate
NOI / Yr
$21,849
Cap Rate
7.54%
Suggested Prices Based on Cap Rates
Cap Rate 5%
$436,980
$437.0K
Cap Rate 7%
$312,129
$312.1K
Cap Rate 9%
$242,767
$242.8K
Market Conditions
NOI Build-Up for 1,488 SF
Gross rent
$33.0K $22.20/SF
− Vacancy
−$1.8K −$1.22/SF
EGI
$31.2K $20.98/SF
− OpEx
−$9.4K −$6.29/SF
NOI
$21.8K $14.68/SF
Area
Hartford, CT
Vacancy
5.51%
Lease Rate
$22.20 /SF/Yr
Expense Ratio
30.00%
Simulate Cap Rate and NOI
Suggested Prices Based on Cap Rates
Cap Rate 5%
$436,980
Cap Rate 7%
$312,129
Cap Rate 9%
$242,767
Alternative Uses
Best Use
Multifamily LT 5
$312.1K
$273.1K – $364.2K
NOI $21,849 @ 7.0% cap · market cap 7.54%
Second Best
Apartment 5plus
$286.8K
$250.9K – $334.6K
NOI $20,075 @ 7.0% cap · market cap 6.92%
Theoretical Best
Office A
$443.5K
$388.1K – $517.5K
NOI $31,047 @ 7.0% cap · market cap 10.71%
Zoning and permitted uses should be independently verified with authorities.
How Realmo checks its estimates
Property Analytics
Unlock full access to Insights
Subscribe to Realmo Intelligence
Open Analytics
Current Use
Lease Details
2
Residential units
Yes
Highway access
Location Intelligence
Trade Area within ½ mile
2,723
Businesses Nearby
Explore this area
Business Placement
Demographics for 06106, CT
38,036
Population
16,938
Households
2.2
Avg Household Size
33
Median Age
17%
College-Educated
70%
High-School Grad
4.2 sq mi
ZIP Area
9,056
Density / Sq Mi
$47,542
Median Household Income
$31,395
Median Earnings
$1,237
Median Rent
$201,600
Median Home Value
Check the figures for this property
Cap Rate, Value Estimation, Potential NOI and more
View Realmo Analytics
Market
Vacancy Rate% for Multifamily in Northeast region

Questions? Ask Rey
Realmo’s AI knows this listing — price, zoning, demand, history. Ask anything.




Frequently Asked Questions
What type of property is this?
Duplex - Well-maintained two-family residence featuring newer boilers, recent interior updates, and a full basement for added storage.
Where is this duplex located?
The property is located at 427 Zion Hartford, CT.
What is the asking price?
The asking price for this property is $289,900.
What are key features of this property?
This property features: Two‑family home built in 1820 with approximately 1,488 SF of living space; 4 bedrooms and 2 full bathrooms across the two‑family layout; Recent interior updates include new flooring and interior paint completed within the last 3 years


