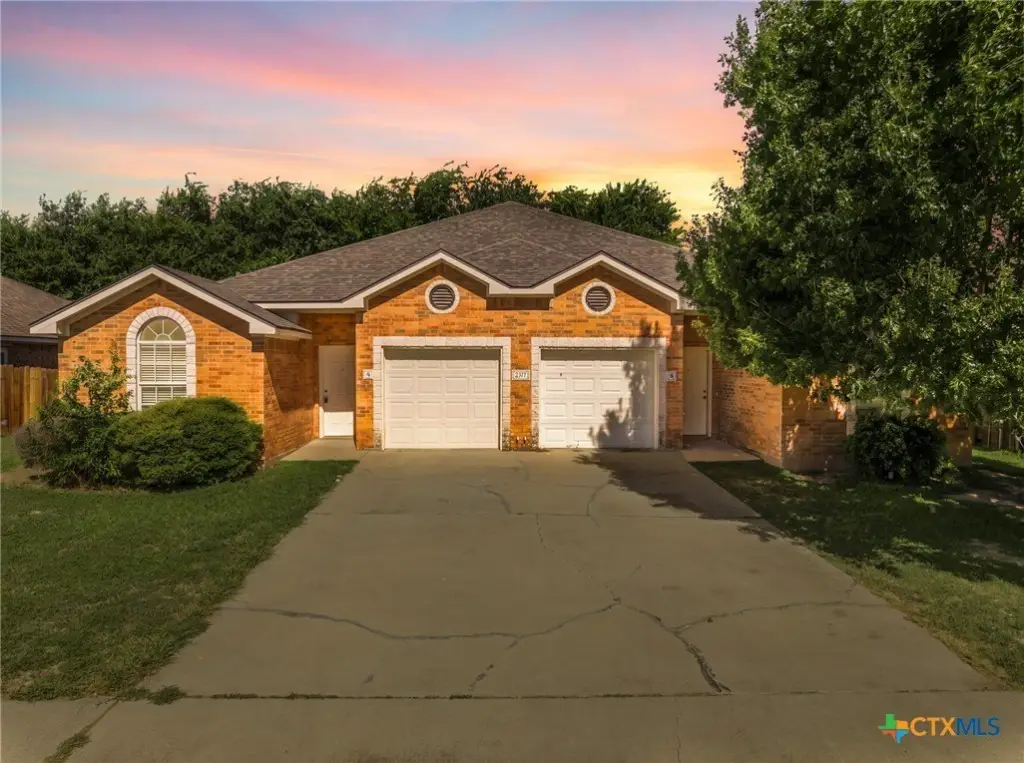
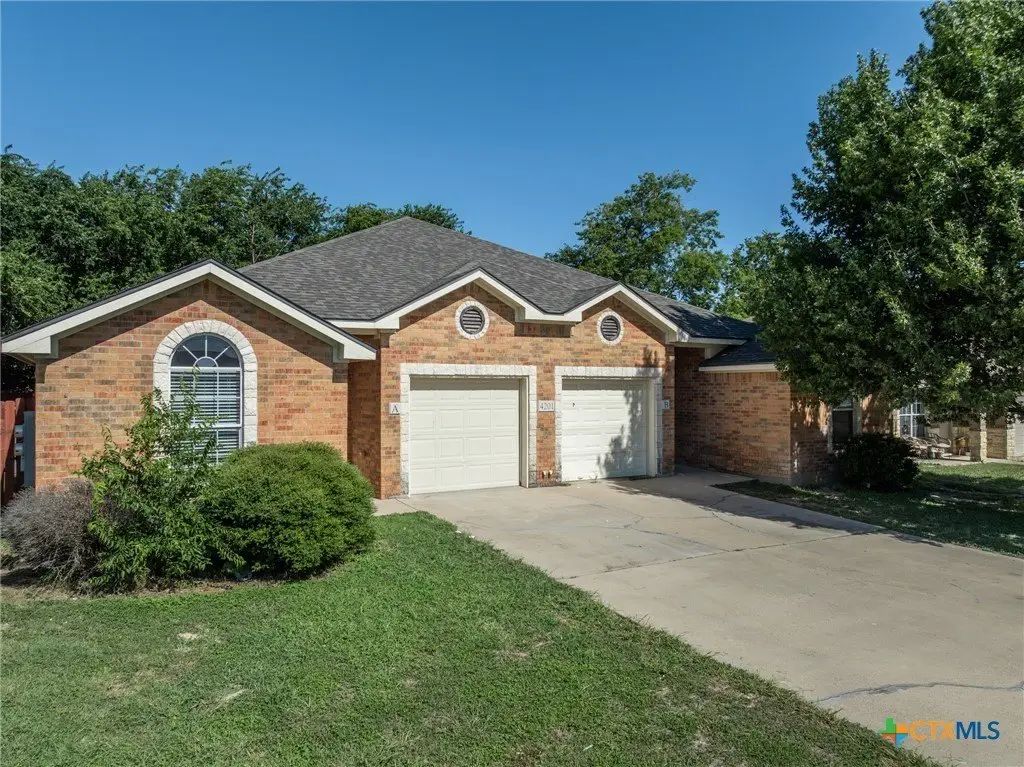
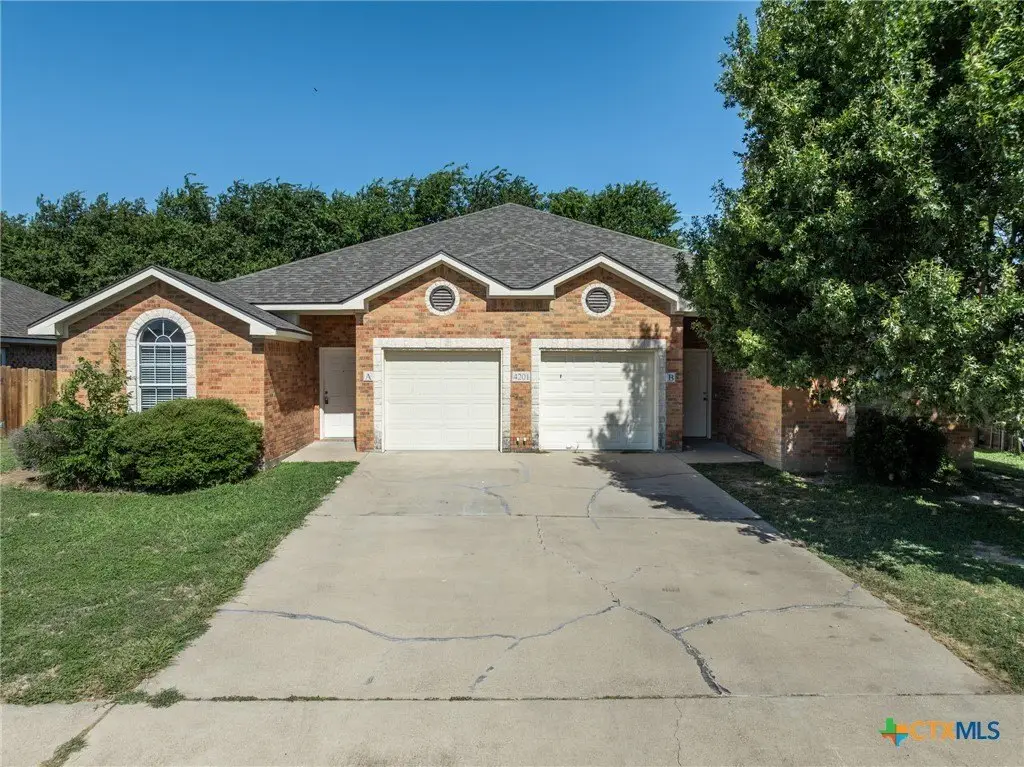
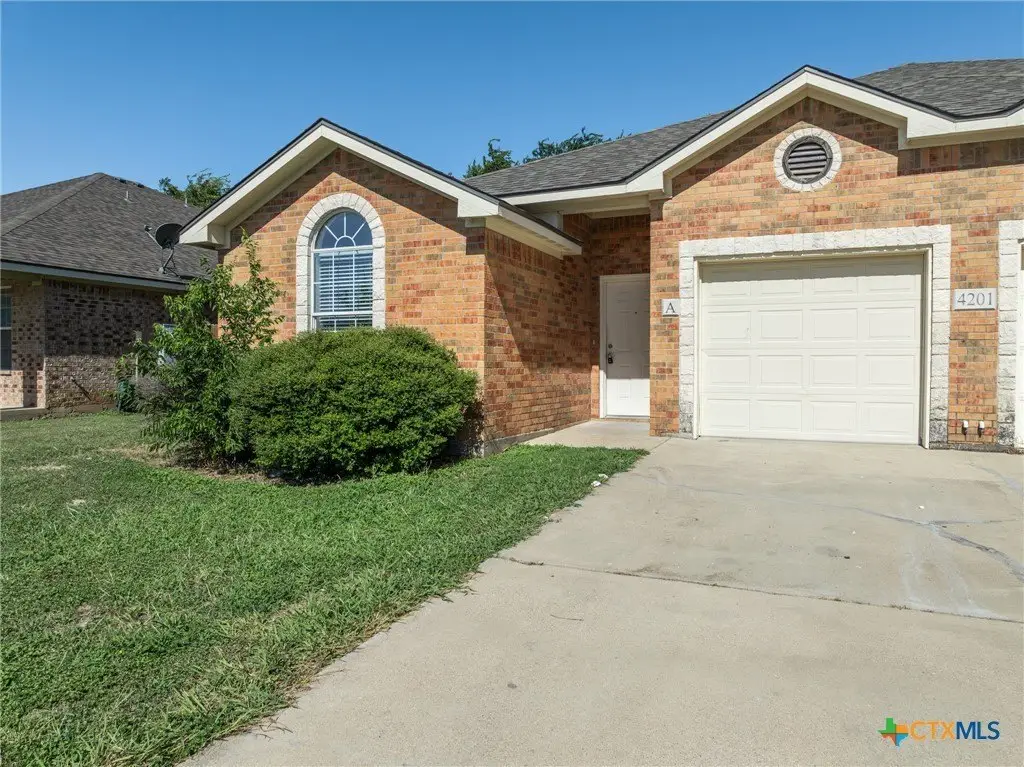
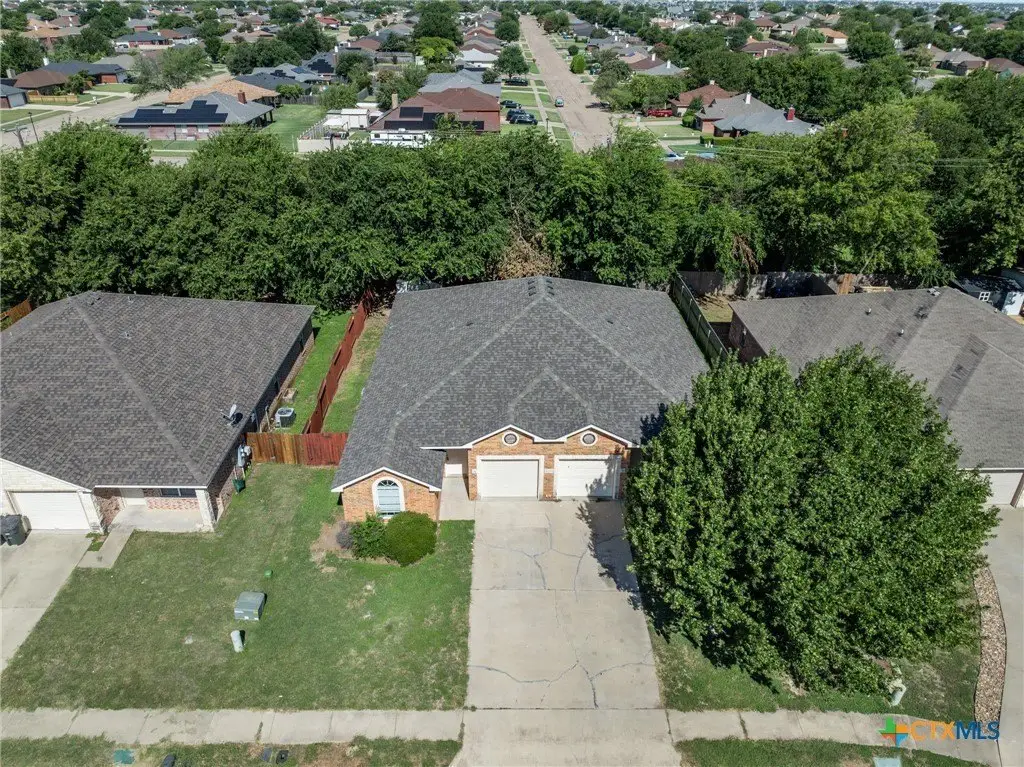
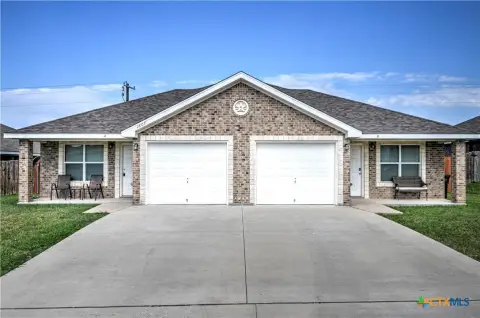
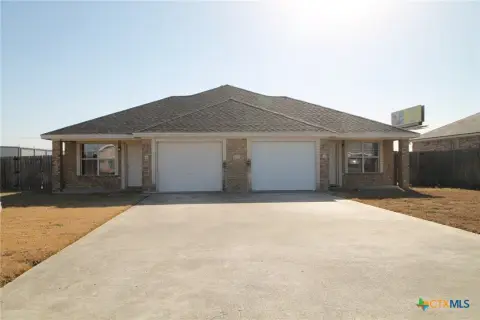
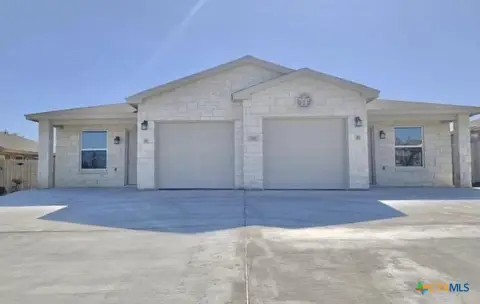
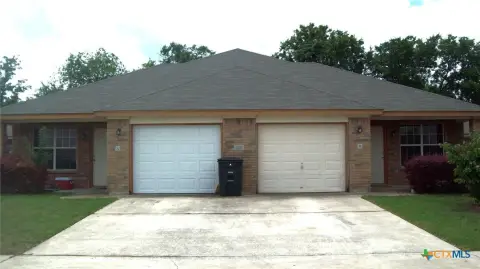
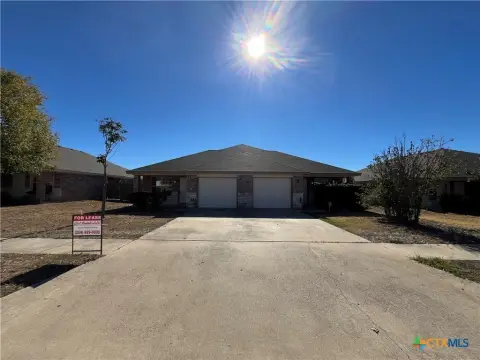
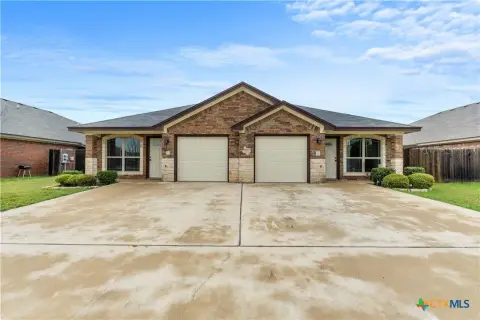
Renovated Duplex with Brick
For Sale
$339,000
4201 Cambridge Drive, Killeen, TX 76549
Residential, Killeen, TX
Property Size2,806 SF
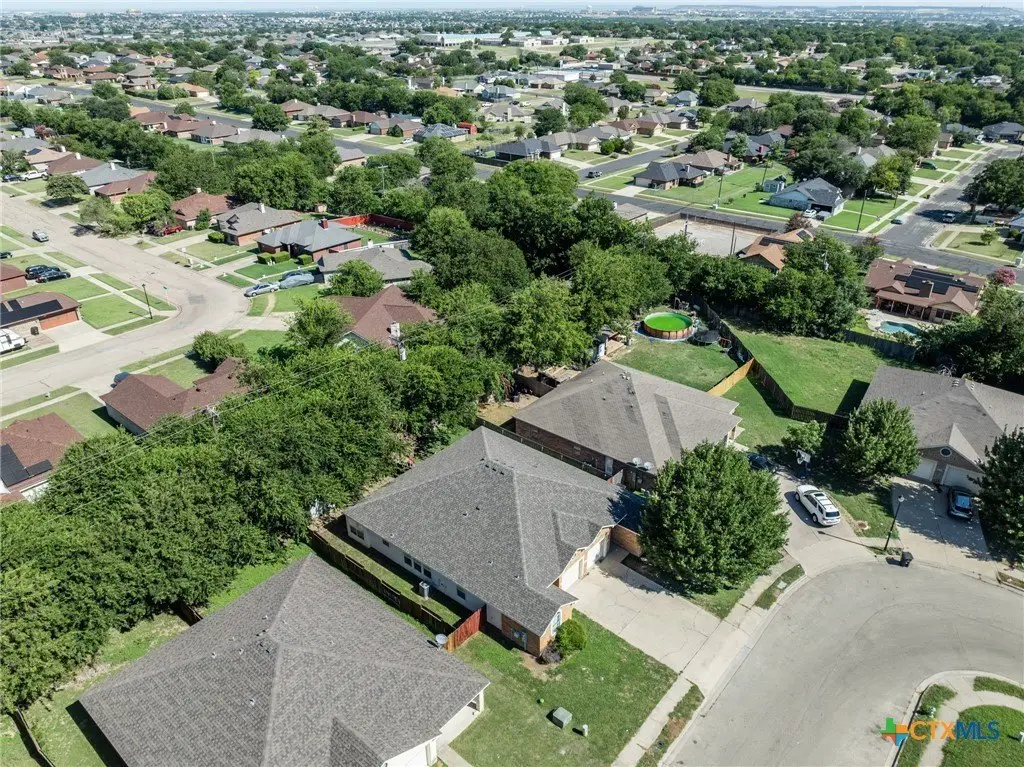
Lot Size0.20 Acres
Price / SF$120.81
Days on Market82
Property Features for 4201 Cambridge Drive
General Information
Property type
Residential Multi Family
Property subtype
Duplex
Interior features
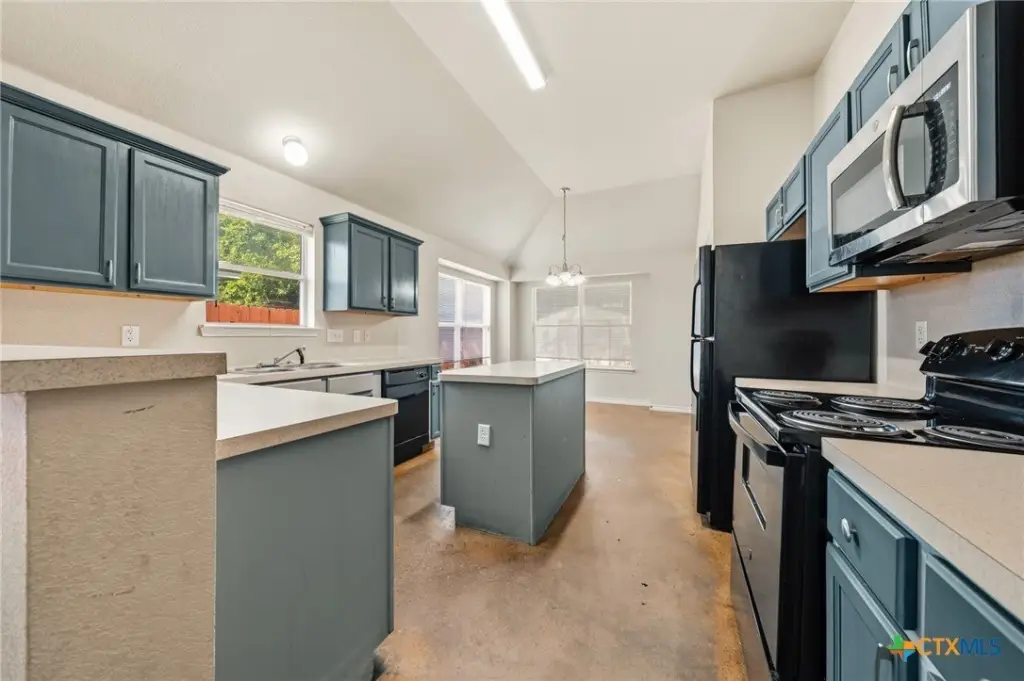
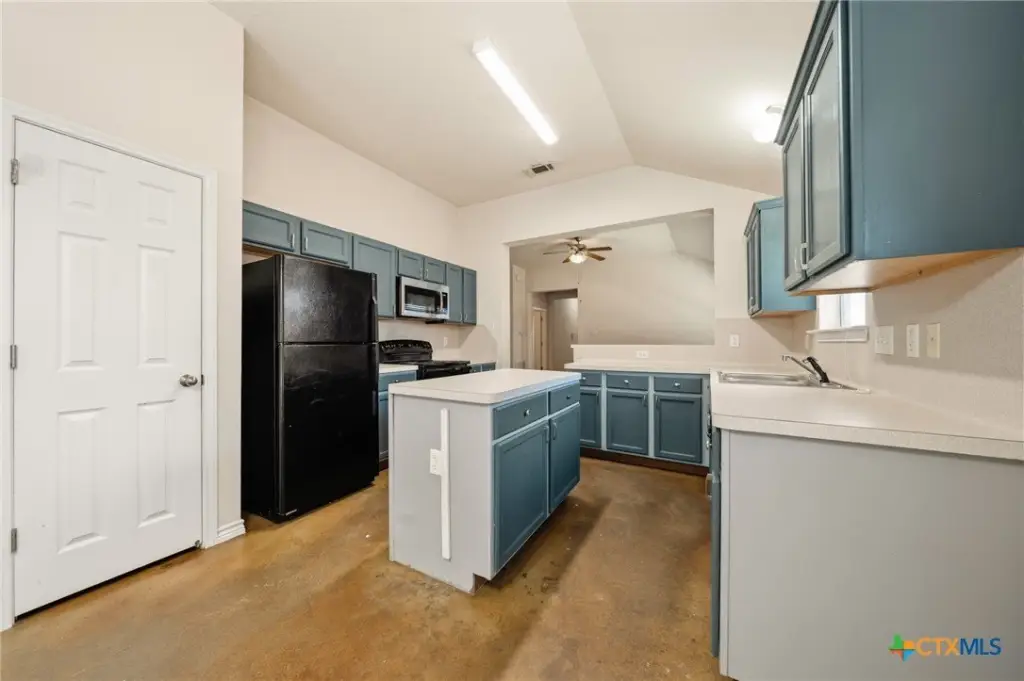
PullDownAtticStairs, TubShower, KitchenIsland, KitchenFamilyRoomCombo, SolidSurfaceCounters
Appliances
Dishwasher, ElectricCooktop, Disposal, MultipleWaterHeaters, Microwave, PlumbedForIceMaker, Refrigerator, SomeElectricAppliances
Subdivision
Old 440 Village
Lot features
City Lot, Less Than Quarter Acre
Elementary school
Willow Springs Elementary School
Middle school
Patterson Middle School
High school
Ellison High School
Elementary school district
Killeen ISD
Middle school district
Killeen ISD
High school district
Killeen ISD
Directions
Turn right onto Pershing Dr from Fort Hood St and then Turn left onto Old FM 440 Rd/Old Fmarm To Market 440 , then Turn right onto Clairidge Ave, then Turn left onto Cambridge Dr Destination will be on the right
Standard status
Active
APN
393346
Size
2,806 SF
Lot size
0.20 Acres
Taxes and HOA fees
Tax Year
2026
Tax Description
OLD 440 VILLAGE, BLOCK 001, LOT 0055
Tax Annual Amount
6562
Legal Description
OLD 440 VILLAGE, BLOCK 001, LOT 0055
Utilities
Sewer type
Public Sewer
Heating system
Central, Electric (Heating)
Cooling system
Electric, Central Air
Water source
Public
Building Details
Year built
2008
Floors in Building
1
Flooring type
Paintedstained, Concrete
Building materials
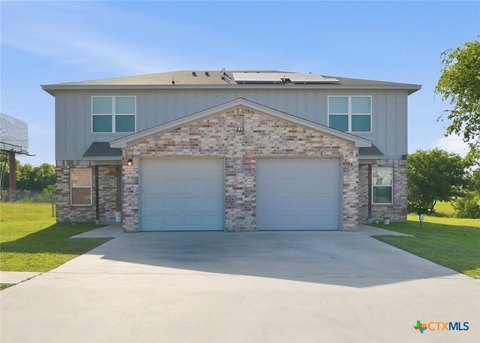
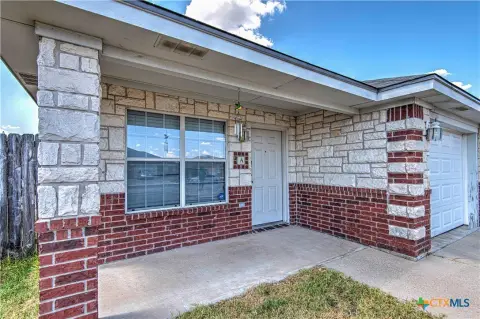
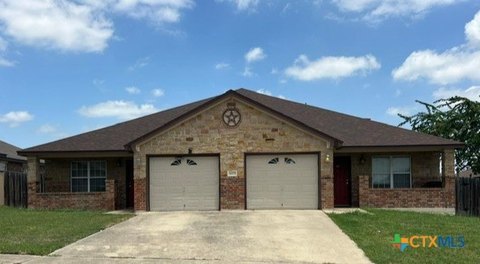
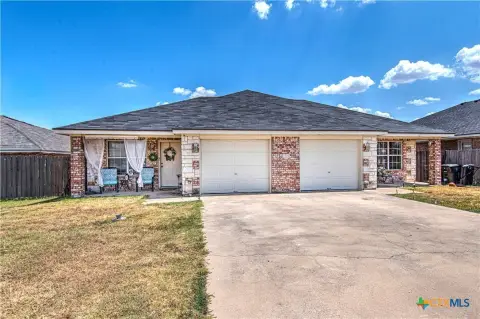
Brick, Masonry, StoneVeneer
Roof type
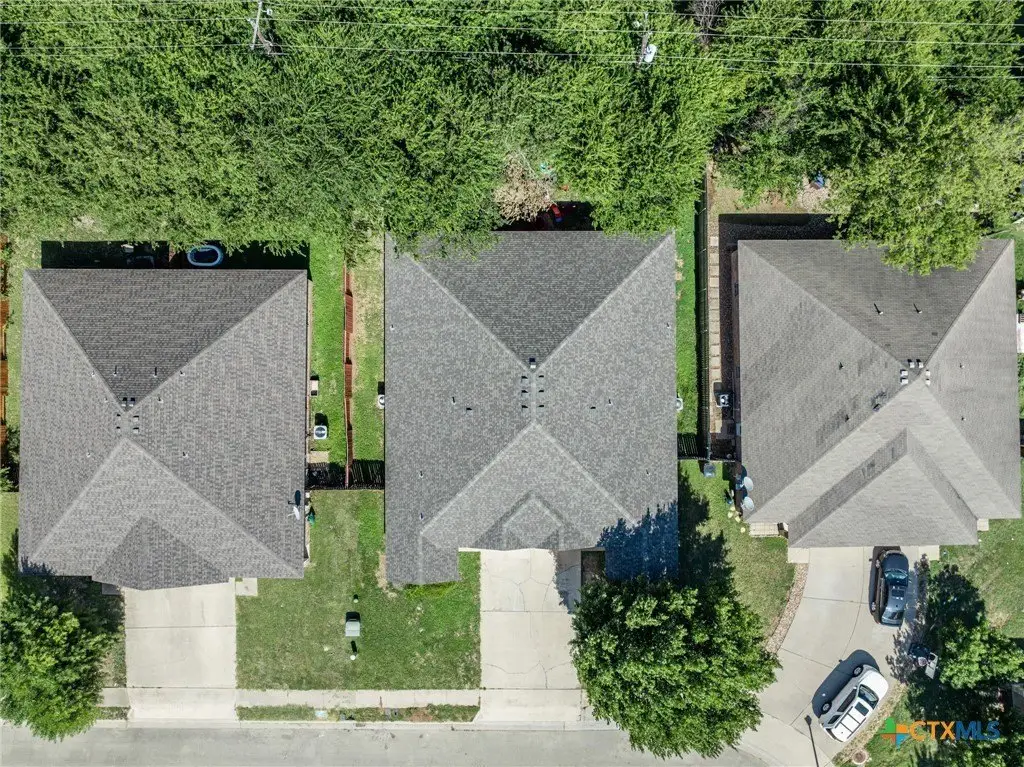
Composition, Shingle
Architectural style
Other
Listing Agency:
StarPointe Realty CTX, LLC
(254) 213-3290
Listed By:
Sujin Henson · License #0713862
(737) 203-0360
Added: Aug 2
Changed: Oct 19
Last Checked: Oct 22 at 9:06PM
MLS# 621409
Copyright © 2026 Central Texas Multiple Listing Service. All rights reserved. All information provided by the listing agent/broker is deemed reliable but is not guaranteed and should be independently verified.

Ask AI about this property
Review the available facts, identify missing information and prepare questions for the agent.
Investment Insights
Based on property information with market context.
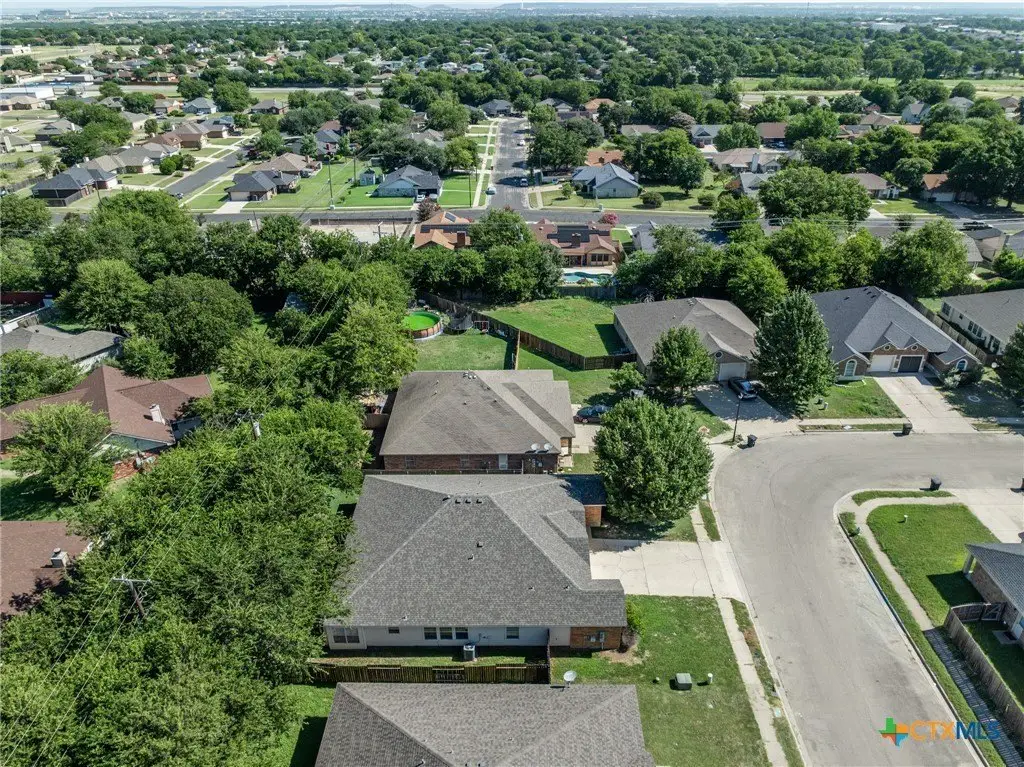
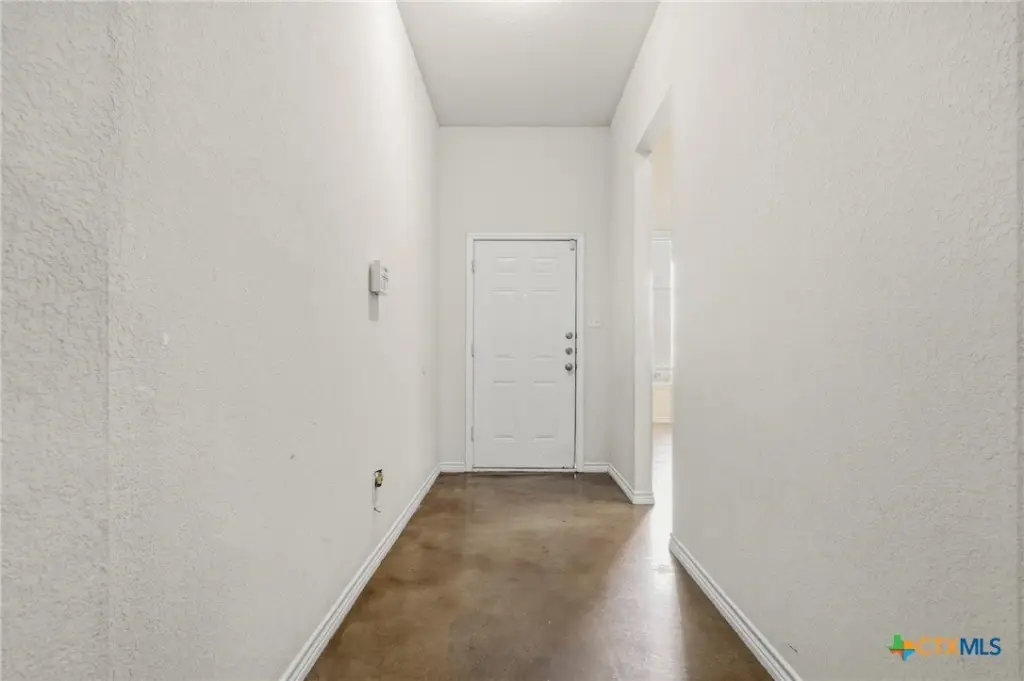
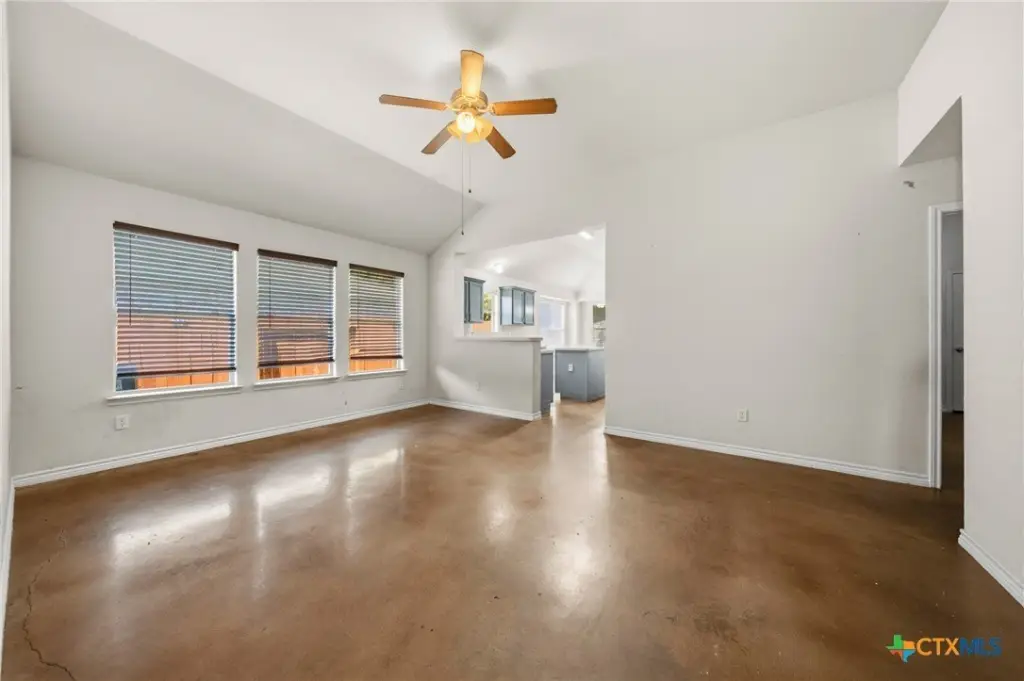
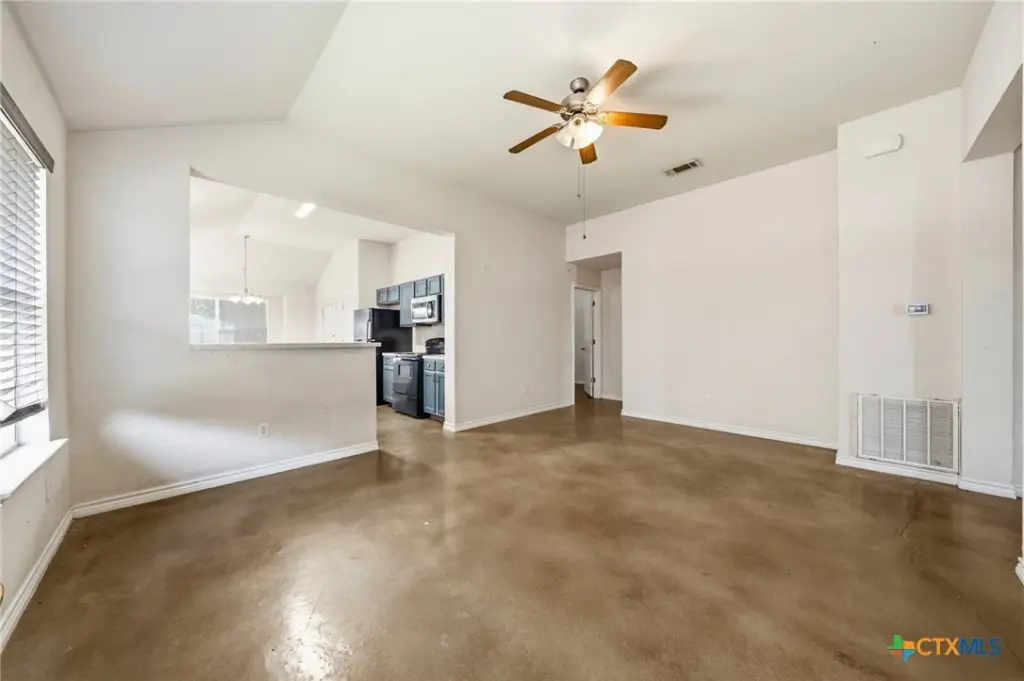
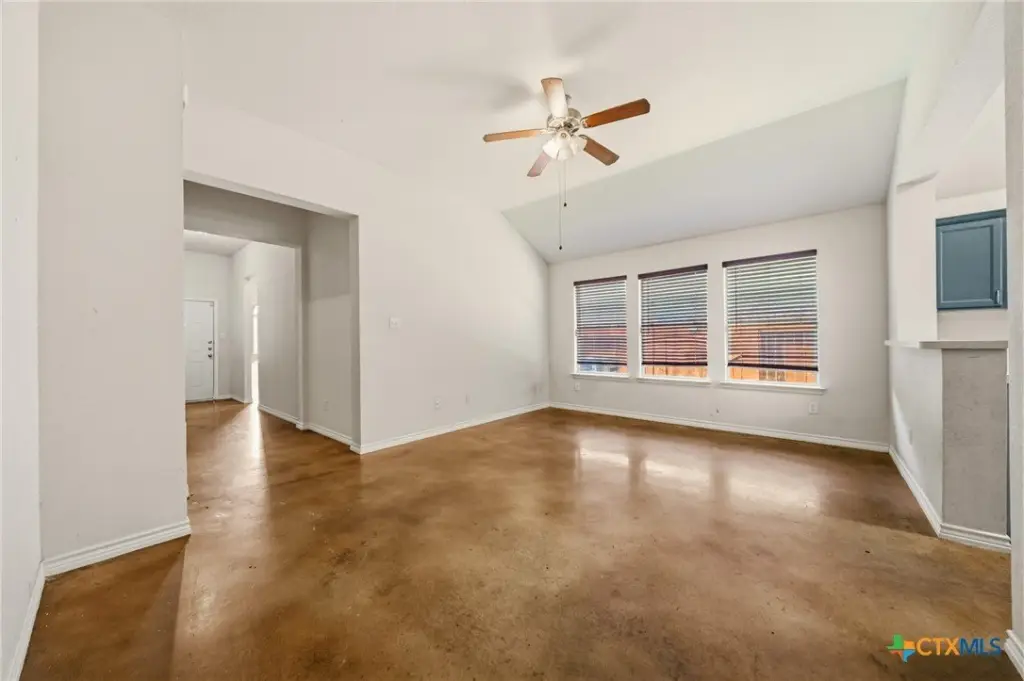
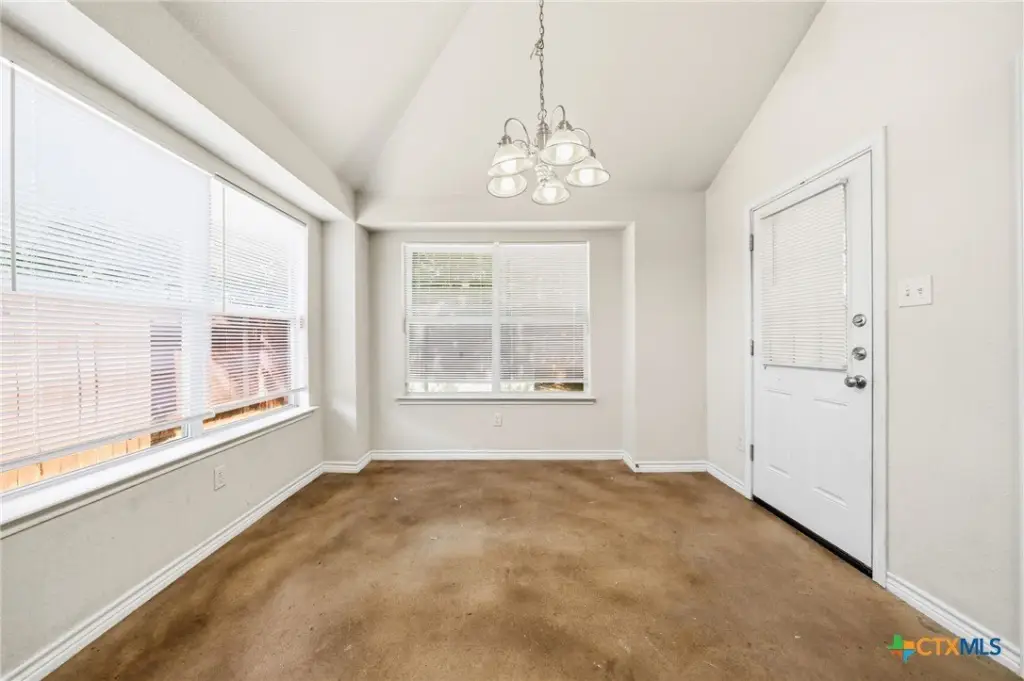
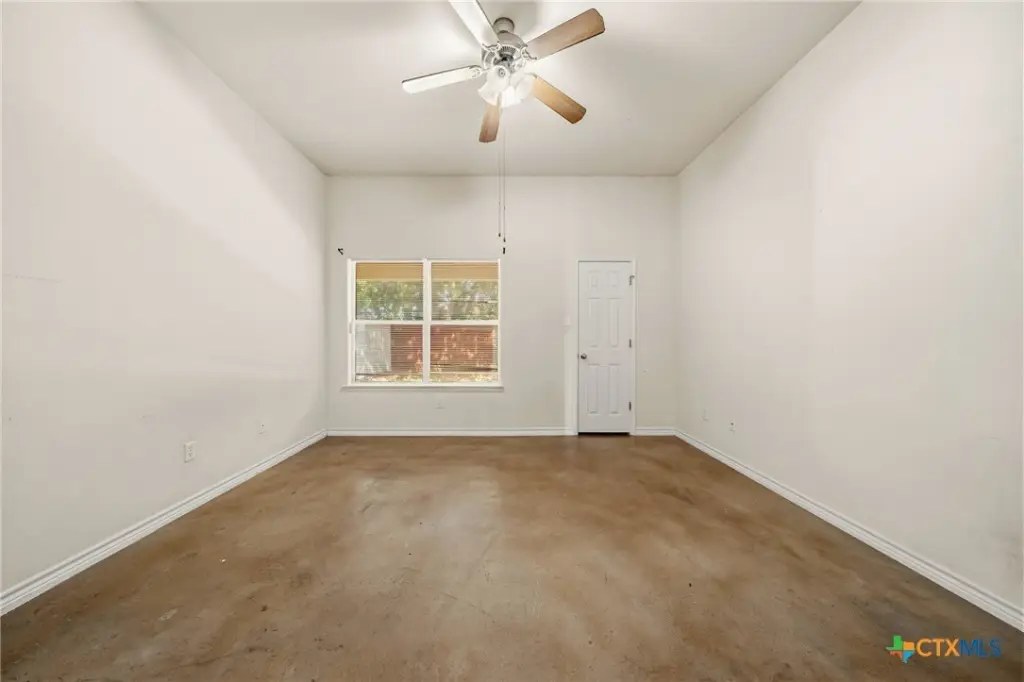
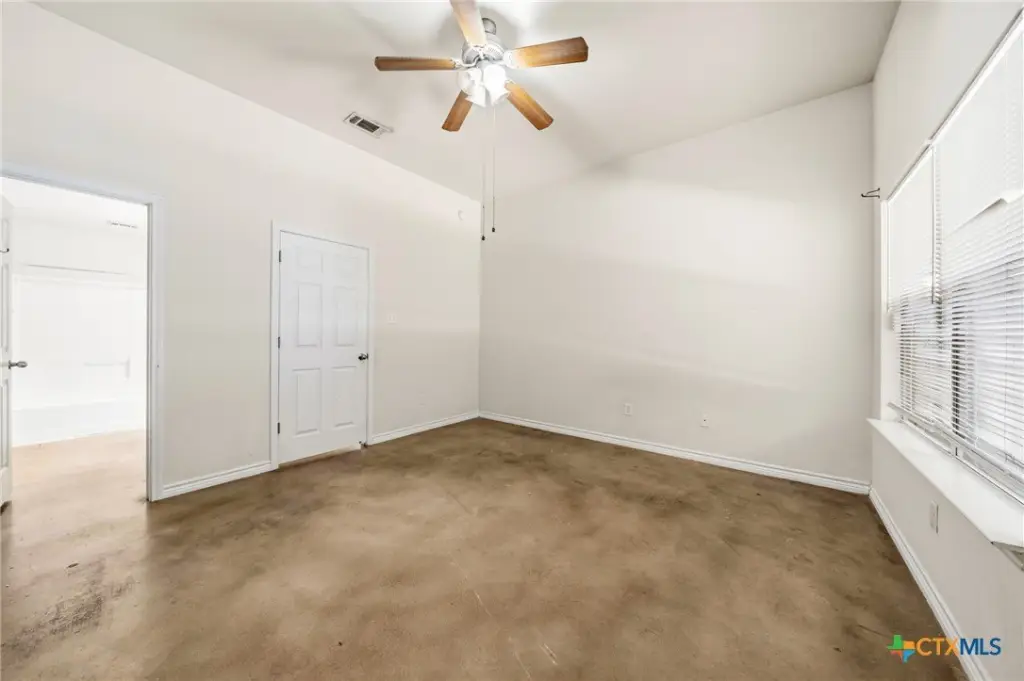
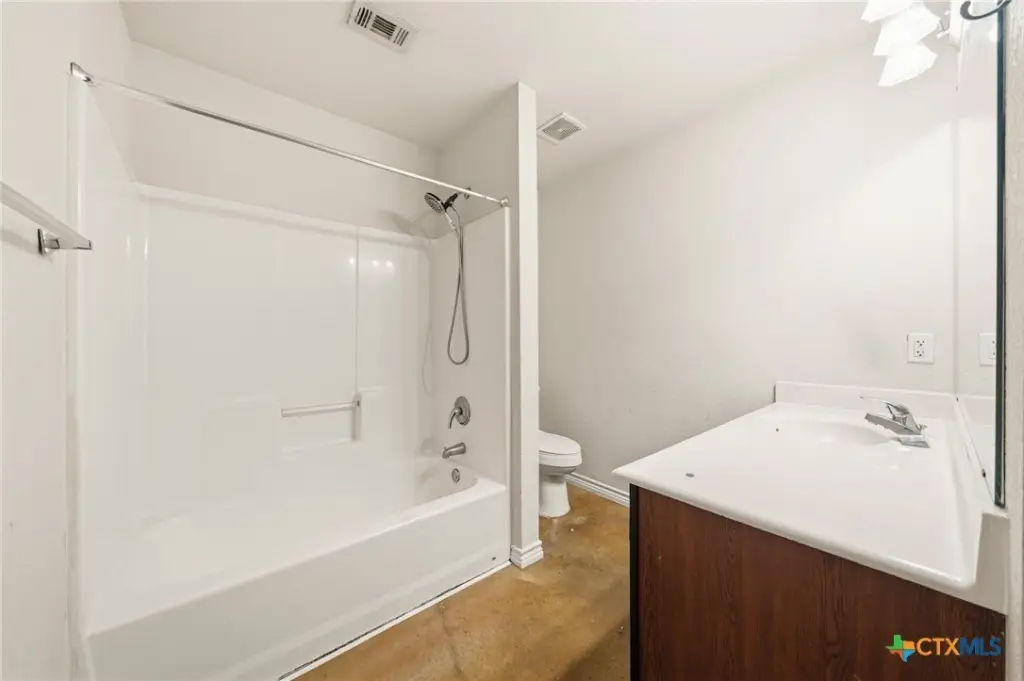
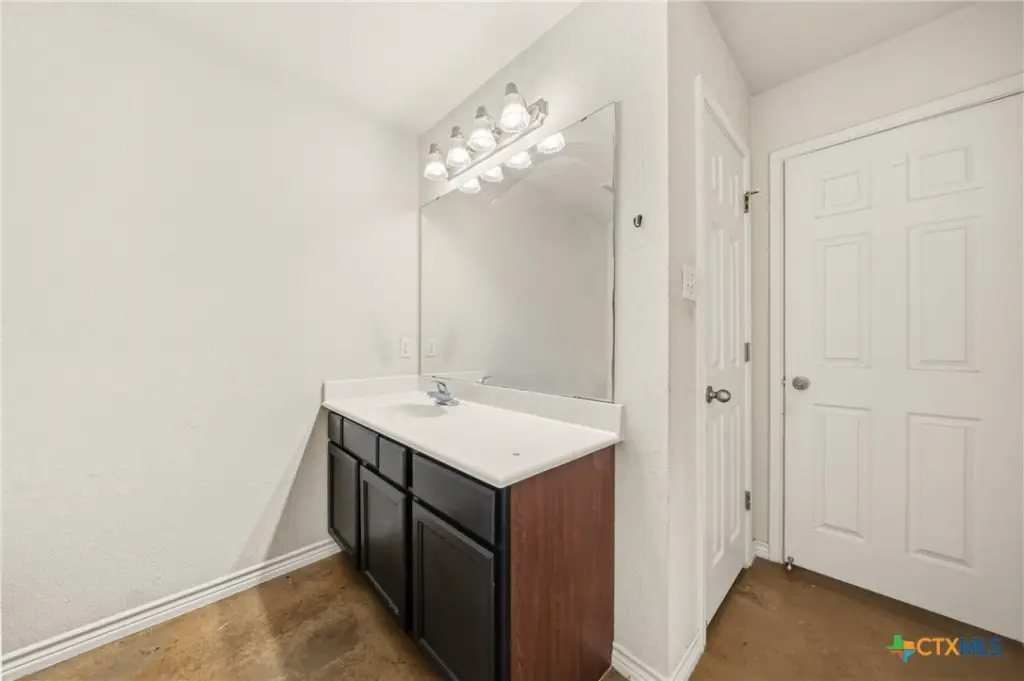
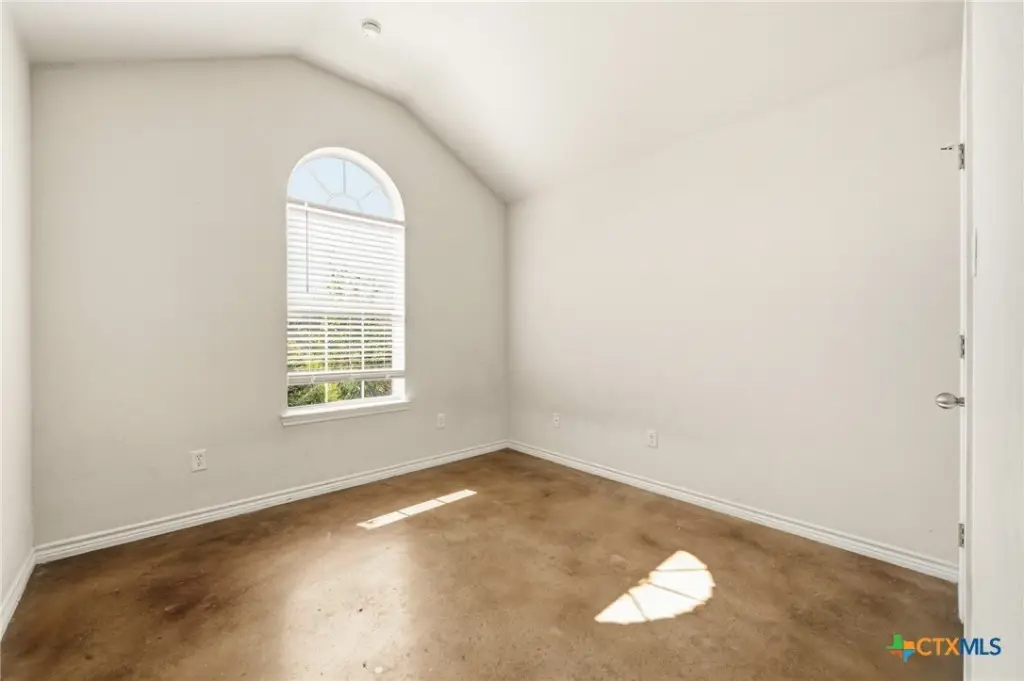
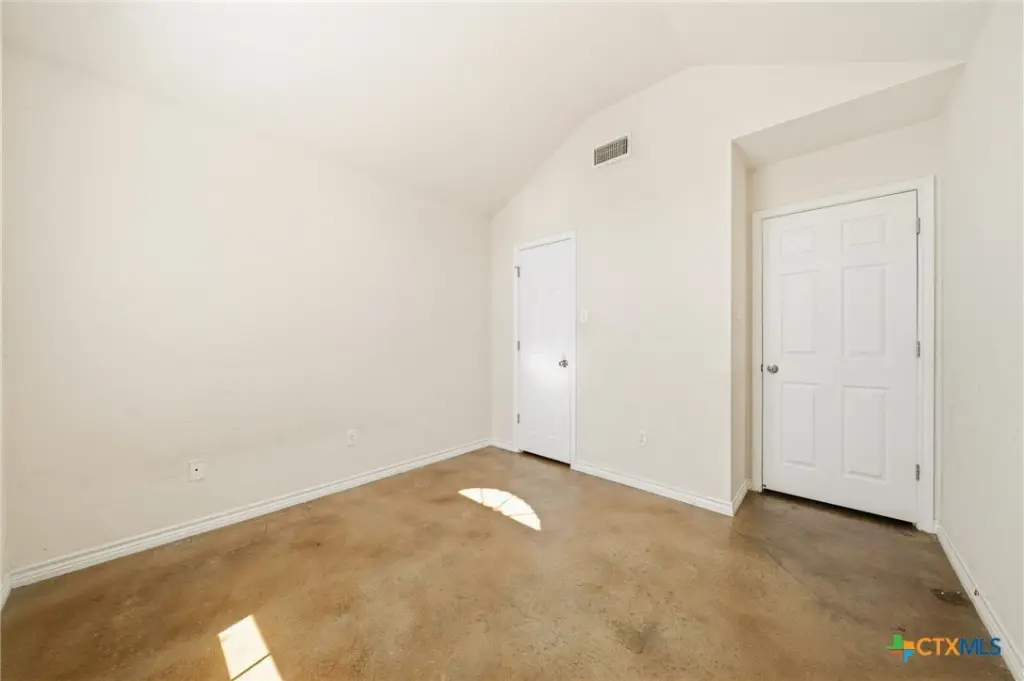
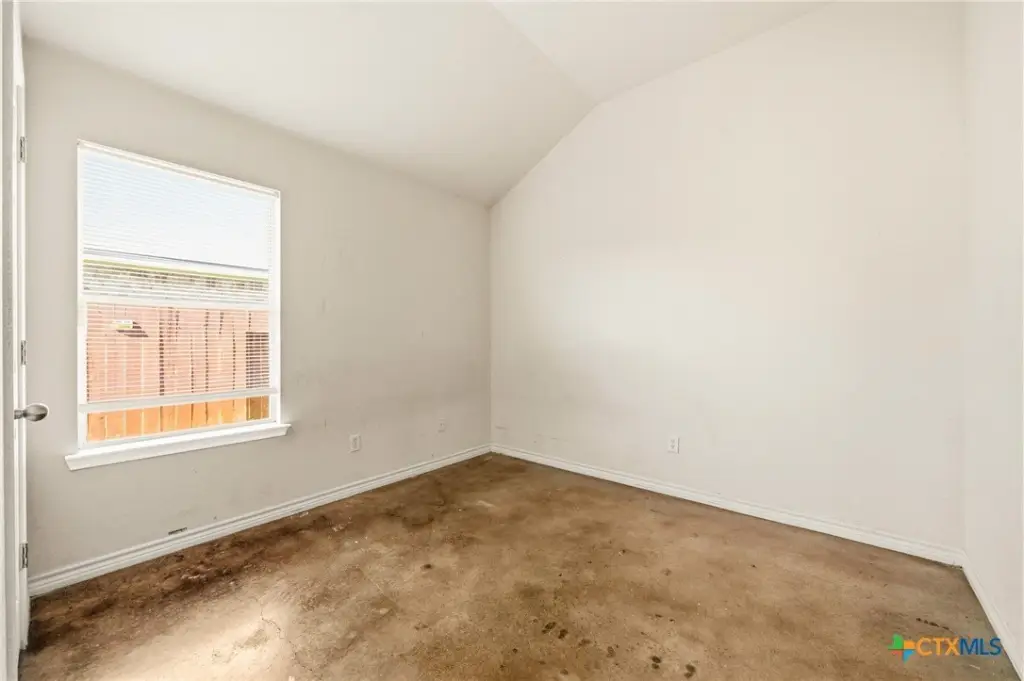
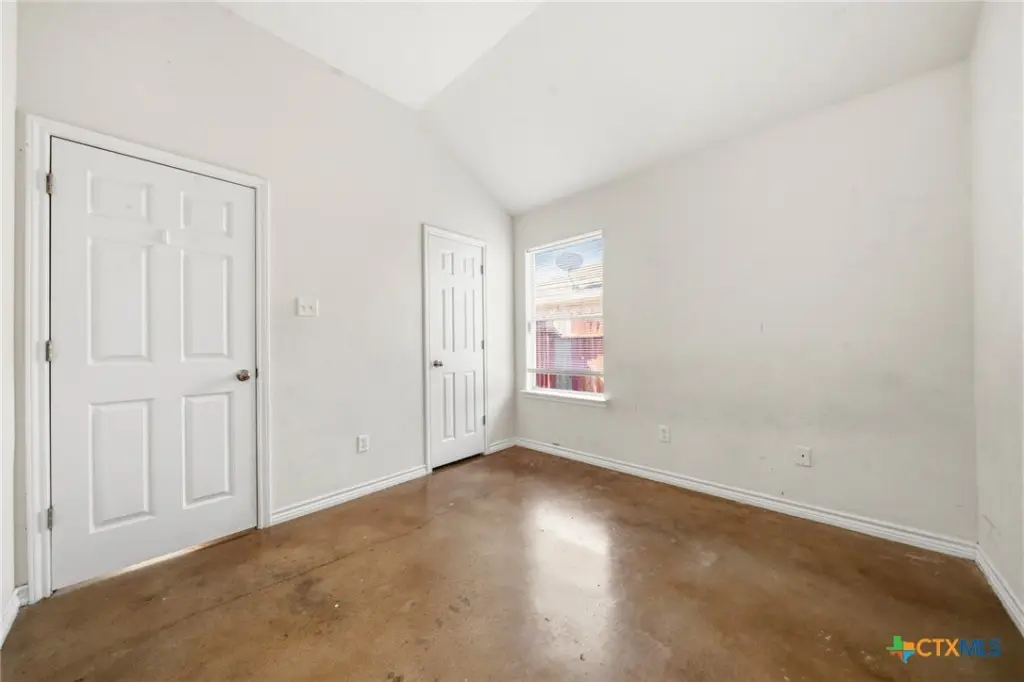
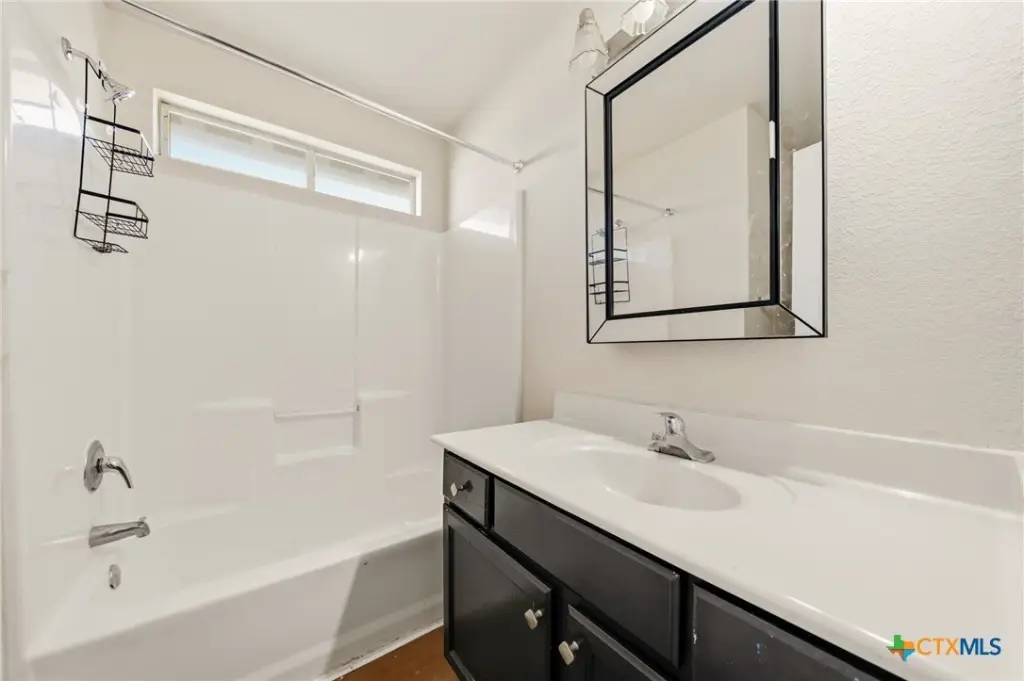
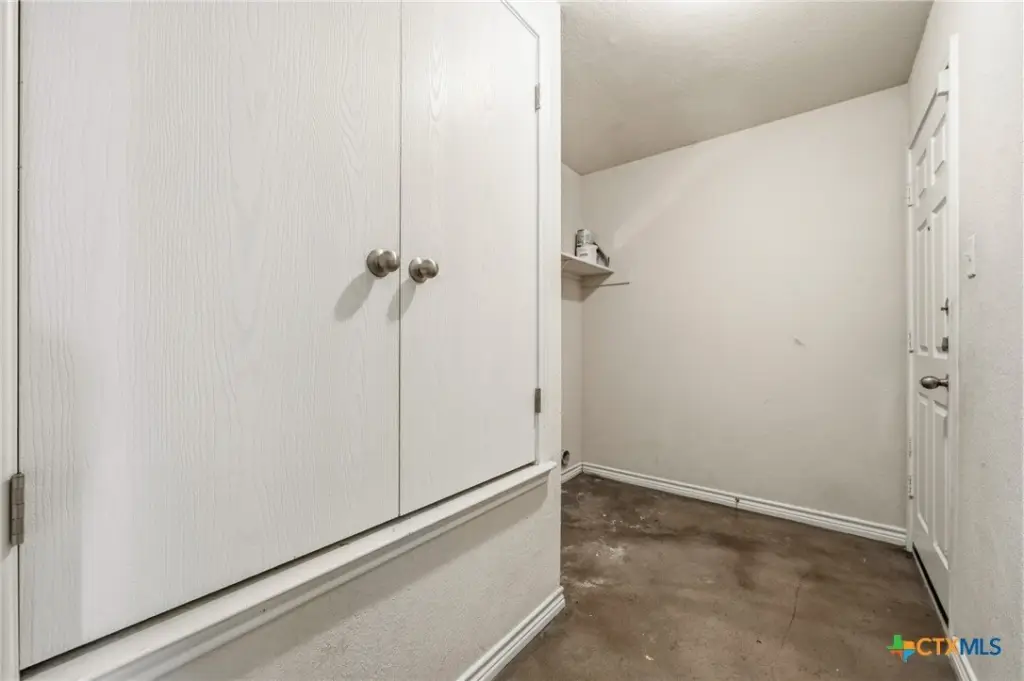
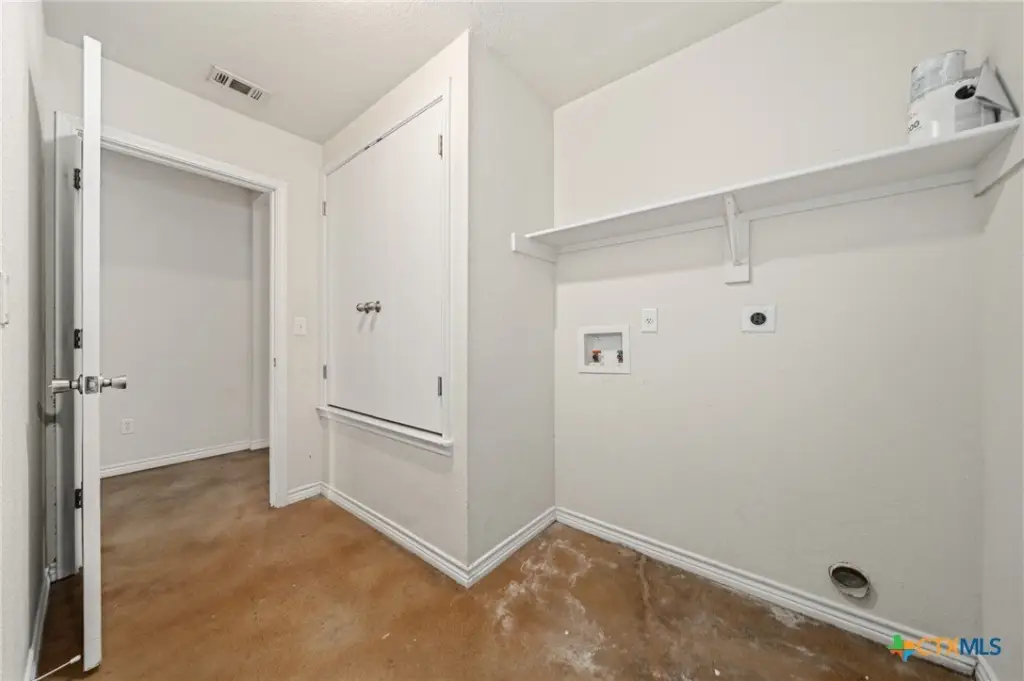
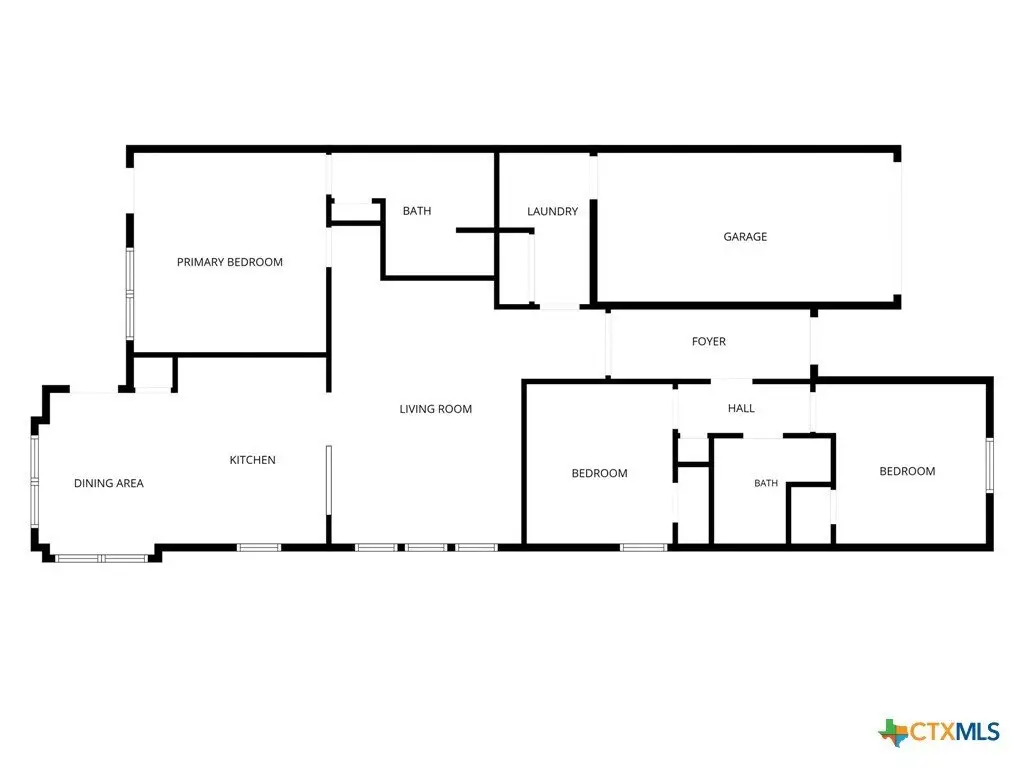
Built in 2008, this 2,806-square-foot duplex offers two residential units with spacious layouts and practical finishes. Each side has stained concrete flooring, a new roof, and a new HVAC system, eliminating carpet and reducing floor-maintenance requirements. Interior features include kitchen islands, solid-surface counters, combined kitchen and family-room areas, tub-and-shower combinations, and pull-down attic stairs. The property also includes electric cooking appliances, dishwashers, disposals, refrigerators, microwaves, and multiple water heaters.
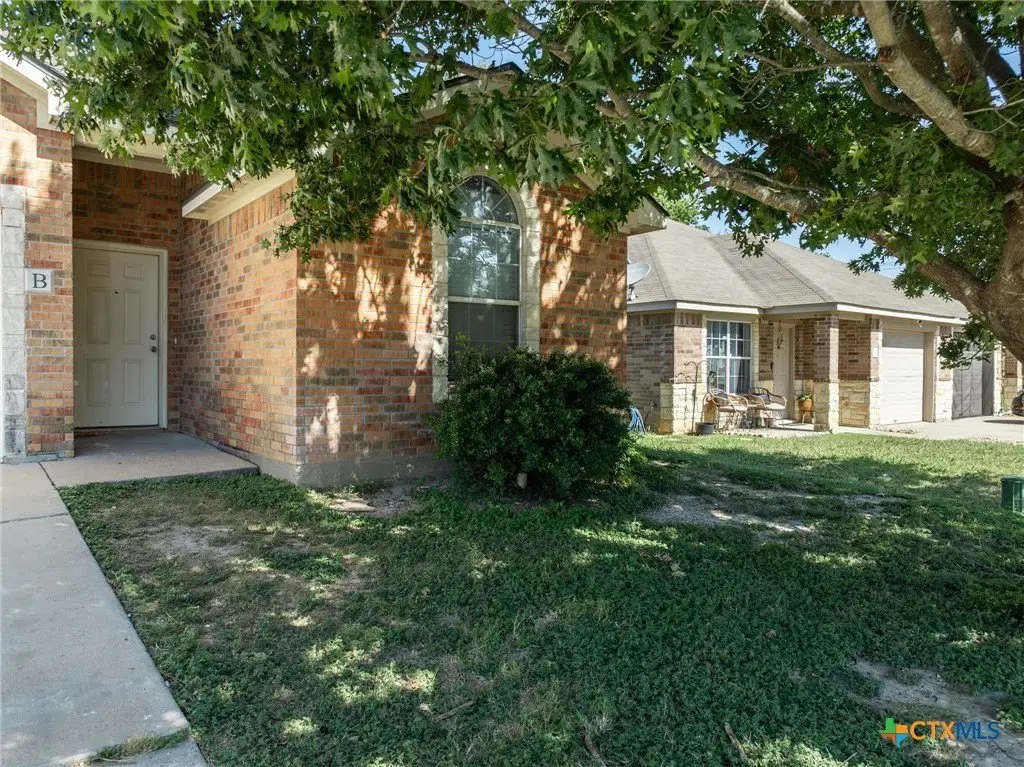
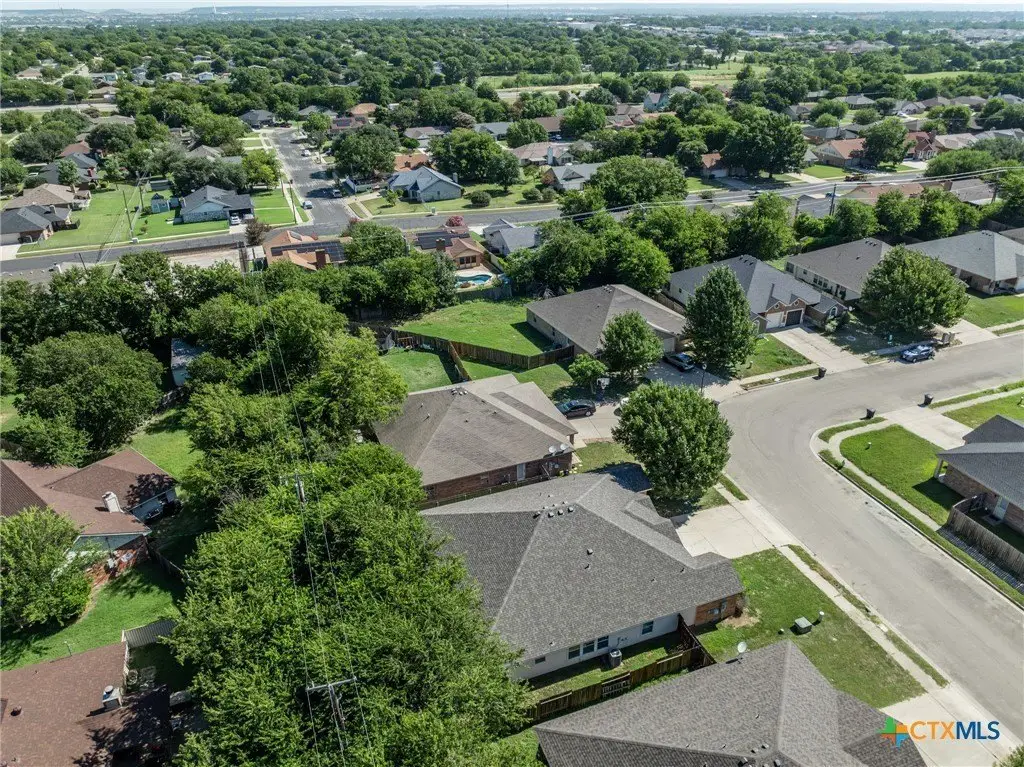
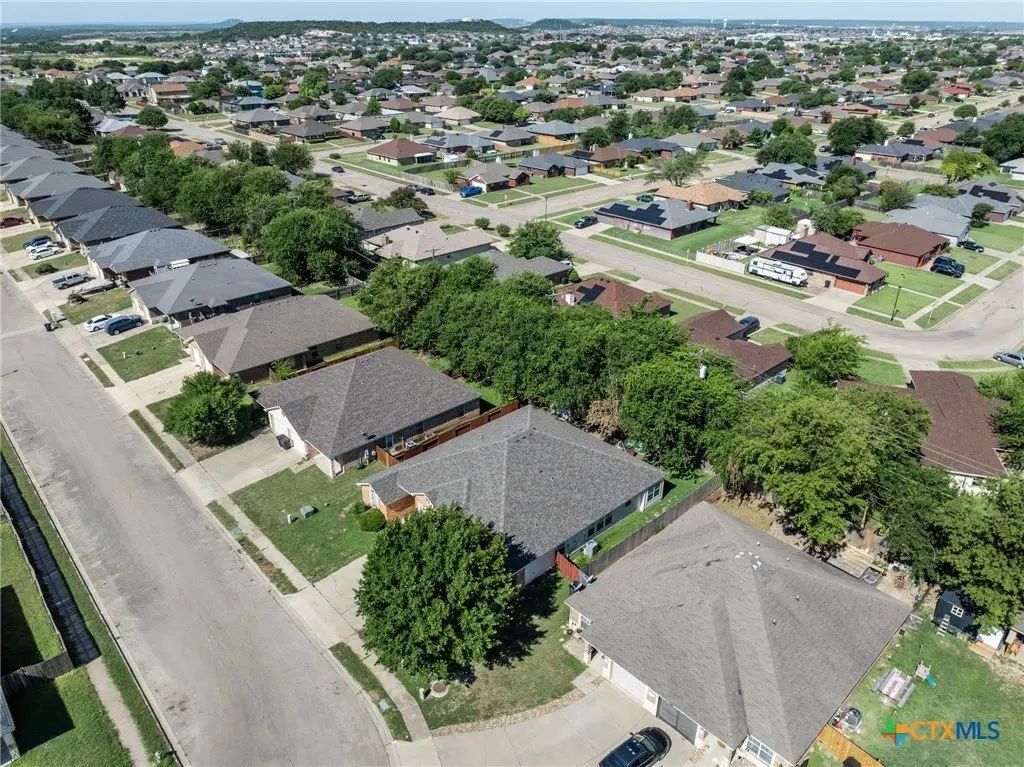
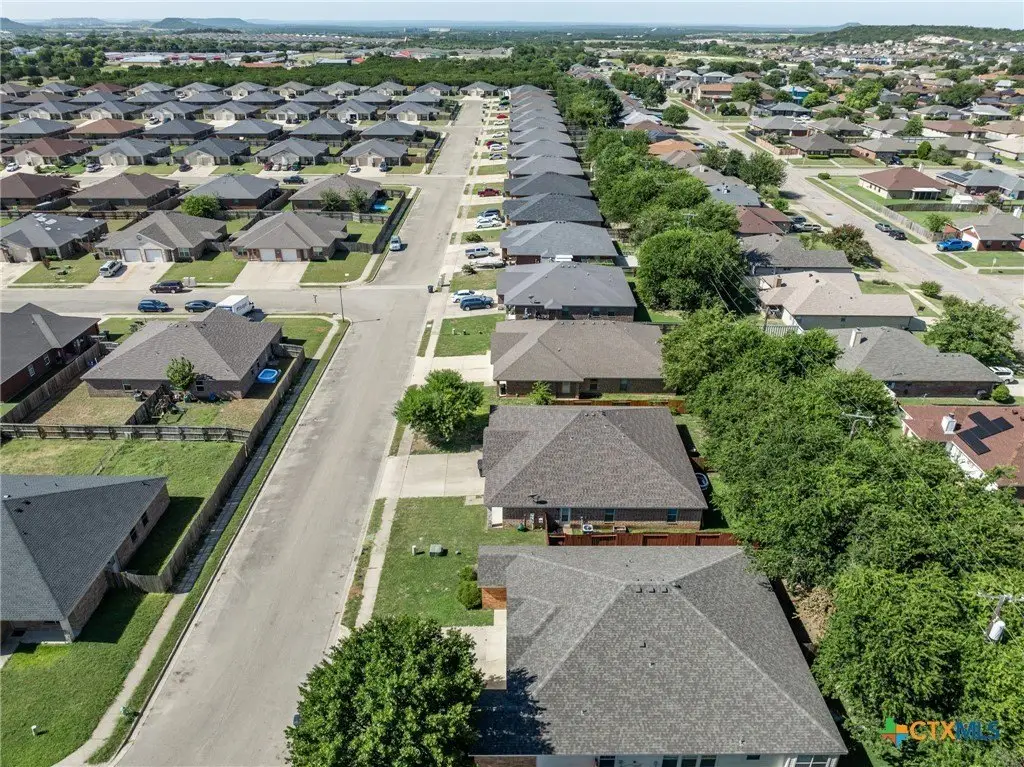
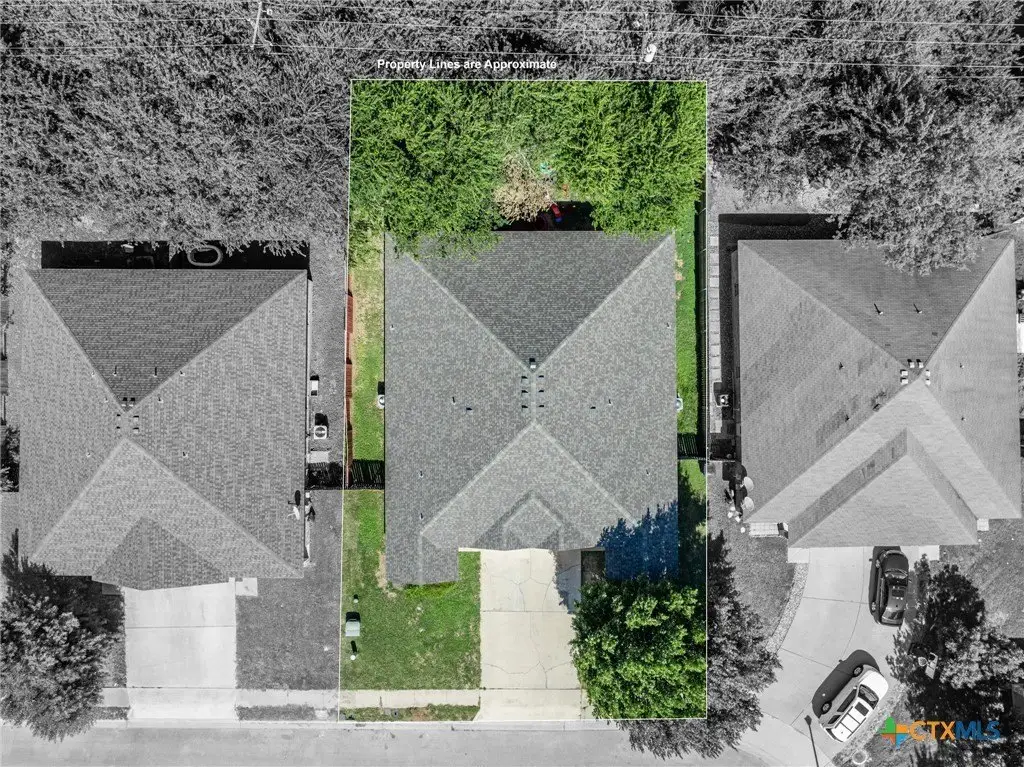
The 0.1967-acre site is located at 4201 Cambridge Drive in Killeen, Texas 76549, with public water and public sewer service. The property is positioned minutes from Fort Hood and near shopping and dining. Brick, masonry, and stone veneer construction, along with a composition shingle roof and central electric heating and cooling, complete the improvements. No HOA is associated with the property.
The 0.1967-acre site is located at 4201 Cambridge Drive in Killeen, Texas 76549, with public water and public sewer service. The property is positioned minutes from Fort Hood and near shopping and dining. Brick, masonry, and stone veneer construction, along with a composition shingle roof and central electric heating and cooling, complete the improvements. No HOA is associated with the property.
Key Highlights
- 2,806‑square‑foot duplex built in 2008
- Two‑unit layout with stained concrete flooring throughout both sides
- New roof and new HVAC systems
Financial Insights
Estimated NOI and Cap Rate
NOI / Yr
$24,253
Cap Rate
7.15%
Suggested Prices Based on Cap Rates
Cap Rate 5%
$485,060
$485.1K
Cap Rate 7%
$346,471
$346.5K
Cap Rate 9%
$269,478
$269.5K
Market Conditions
NOI Build-Up for 2,806 SF
Gross rent
$37.0K $13.20/SF
− Vacancy
−$2.4K −$0.85/SF
EGI
$34.6K $12.35/SF
− OpEx
−$10.4K −$3.70/SF
NOI
$24.3K $8.64/SF
Area
Killeen, TX
Vacancy
6.46%
Lease Rate
$13.20 /SF/Yr
Expense Ratio
30.00%
Simulate Cap Rate and NOI
Suggested Prices Based on Cap Rates
Cap Rate 5%
$485,060
Cap Rate 7%
$346,471
Cap Rate 9%
$269,478
Alternative Uses
Best Use
Multifamily LT 5
$346.5K
$303.2K – $404.2K
NOI $24,253 @ 7.0% cap · market cap 7.15%
Second Best
Apartment 5plus
$320.5K
$280.5K – $374.0K
NOI $22,438 @ 7.0% cap · market cap 6.62%
Theoretical Best
Office A
$674.0K
$589.7K – $786.3K
NOI $47,179 @ 7.0% cap · market cap 13.92%
Zoning and permitted uses should be independently verified with authorities.
How Realmo checks its estimates
Property Analytics
Unlock full access to Insights
Subscribe to Realmo Intelligence
Open Analytics
Location Intelligence
Trade Area within ½ mile
404
Businesses Nearby
Explore this area
Business Placement
Demographics for 76549, TX
56,199
Population
21,794
Households
2.6
Avg Household Size
29
Median Age
23%
College-Educated
95%
High-School Grad
94.1 sq mi
ZIP Area
597
Density / Sq Mi
$62,536
Median Household Income
$36,340
Median Earnings
$1,363
Median Rent
$202,100
Median Home Value
Check the figures for this property
Cap Rate, Value Estimation, Potential NOI and more
View Realmo Analytics
Market
Vacancy Rate% for Multifamily in South region
Frequently Asked Questions
What type of property is this?
Duplex - Two-unit property with updated mechanical systems, durable concrete floors, and no HOA restrictions.
Where is this duplex located?
The property is located at 4201 Cambridge Drive Killeen, TX.
What is the asking price?
The asking price for this property is $339,000.
What are key features of this property?
This property features: 2,806‑square‑foot duplex built in 2008; Two‑unit layout with stained concrete flooring throughout both sides; New roof and new HVAC systems


