Prime Corner Lot in
For Sale
Contact for pricing
4200 S 5th St, Temple, TX 76502
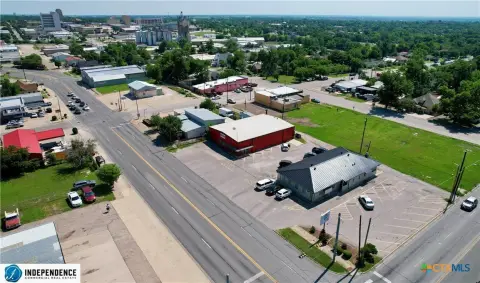
1.45 acre lot near medical district, ideal for development.
Property Size1,458 SF
Lot Size1.45 Acres
Price / SF$325.79
Days on Market816
Property Features for 4200 S 5th St
General Information
Standard status
Active
Size
1,458 SF
Lot size
1.45 Acres
Property subtype
Retail
Zoning
General Retail
Listing Agency:
Central Realty Partners
Listed By:
Scott Motsinger · License #TX 526810
(254) 791-8700
Source:
Crexi
Added: Jul 23, 2024
Changed: Sep 11
Last Checked: Oct 16 at 6:07AM
Displayed information is deemed reliable but is not guaranteed and should be independently verified. All listing content including descriptions, pricing, images are the copyrighted material of Central Realty Partners

Ask AI about this property
Review the available facts, identify missing information and prepare questions for the agent.
Investment Insights
Based on property information with market context.
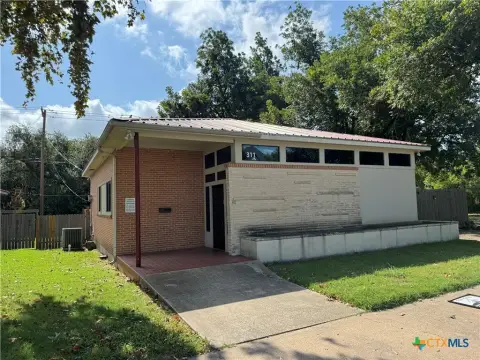
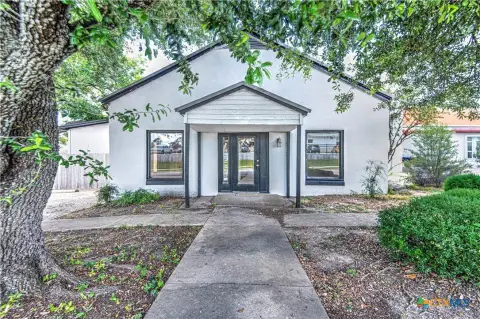
Located in Temple, Texas, along IH 35 between Austin and Waco, this 1.45-acre lot occupies a corner position at a busy intersection on the south side of Temple, an area experiencing growth. The property offers development potential due to its proximity to Baylor Scott & White, the VA Hospital, Temple College, Texas A&M College of Medicine, and the retail district on 31st Street. Nearby amenities include Raye-Allen Elementary School, Friar’s Creek Nature Trail, Lions Junction Family Water Park, and the South Temple Disc Golf Course. Adjacent to the Encore apartments and north of new neighborhood developments, the location is suitable for neighborhood stores or office use. A 1458 square foot home built in 1981 is present on the property, which could be converted to office space or demolished. The property is located within a few miles of the Temple Medical Education District (TMED), a redevelopment effort focused on the economic vitality of Temple. The area is experiencing rapid growth in new home construction. The site benefits from increased investment in south Temple and its proximity to major economic drivers for the community.
Key Highlights
- 1.45 acre lot at a busy intersection in a high‑growth area of South Temple.
- Close proximity to major economic drivers: Baylor Scott & White, VA Hospital, Temple College, Texas A&M College of Medicine, and the 31st Street retail district.
- Extraordinary development potential for neighborhood stores or office use.
Financial Insights
Estimated NOI and Cap Rate
NOI / Yr
$24,388
Cap Rate
5.13%
Suggested Prices Based on Cap Rates
Cap Rate 5%
$487,760
$487.8K
Cap Rate 7%
$348,400
$348.4K
Cap Rate 9%
$270,978
$271.0K
Market Conditions
NOI Build-Up for 1,458 SF
Gross rent
$44.8K $30.72/SF
− Vacancy
−$12.3K −$8.42/SF
EGI
$32.5K $22.30/SF
− OpEx
−$8.1K −$5.58/SF
NOI
$24.4K $16.73/SF
Area
Bell County, TX
Vacancy
27.40%
Lease Rate
$30.72 /SF/Yr
Expense Ratio
25.00%
Simulate Cap Rate and NOI
Suggested Prices Based on Cap Rates
Cap Rate 5%
$487,760
Cap Rate 7%
$348,400
Cap Rate 9%
$270,978
Alternative Uses
Best Use
Office B
$348.4K
$304.9K – $406.5K
NOI $24,388 @ 7.0% cap · market cap 5.13%
Second Best
Retail
$282.1K
$246.9K – $329.2K
NOI $19,749 @ 7.0% cap · market cap 4.16%
Theoretical Best
Multifamily LT 5
$16.28M
$14.24M – $18.99M
NOI $1,139,357 @ 7.0% cap · market cap 239.86%
Zoning and permitted uses should be independently verified with authorities.
How Realmo checks its estimates
Property Analytics
Unlock full access to Insights
Subscribe to Realmo Intelligence
Open Analytics
Current Use
Location Intelligence
Trade Area within ½ mile
260
Businesses Nearby
Explore this area
Business Placement
Demographics for 76502, TX
47,297
Population
19,497
Households
2.4
Avg Household Size
37
Median Age
37%
College-Educated
91%
High-School Grad
58.3 sq mi
ZIP Area
811
Density / Sq Mi
$80,504
Median Household Income
$45,332
Median Earnings
$1,411
Median Rent
$252,100
Median Home Value
Check the figures for this property
Cap Rate, Value Estimation, Potential NOI and more
View Realmo Analytics
Market
Vacancy Rate% for Office in South region






Frequently Asked Questions
What type of property is this?
Commercial land - 1.45 acre lot near medical district, ideal for development.
Where is this commercial land located?
The property is located at 4200 S 5th St Temple, TX.
What is the asking price?
The asking price for this property is $475,000.
What are key features of this property?
This property features: 1.45 acre lot at a busy intersection in a high‑growth area of South Temple.; Close proximity to major economic drivers: Baylor Scott & White, VA Hospital, Temple College, Texas A&M College of Medicine, and the 31st Street retail district.; Extraordinary development potential for neighborhood stores or office use.


