Mixed-Use Development Site with
For Sale
$1,995,000
4160 M 72 E, Williamsburg, MI 49690
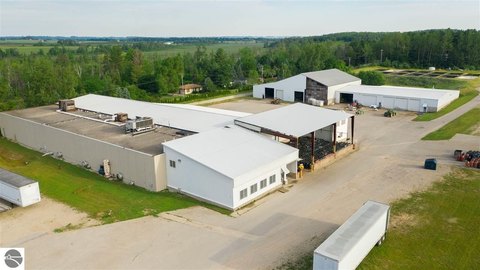
Shovel-ready mixed-use site with fully developed utilities, an approved PD, and a 12,000-sq-ft existing mixed-use building.
Property Size12,000 SF
Lot Size4.35 Acres
Price / SF$166.25
Days on Market314
Property Features for 4160 M 72 E
General Information
Standard status
Active
Size
12,000 SF
Lot size
4.35 Acres
Site & Location
Road Access
Yes
Utilities to Site
Yes
Taxes and HOA fees
Annual Taxes
$126,930
Listing Agency:
REMAX Bayshore - West Shore Dr TC
Listed By:
Robert Brick · License #6502134537
(231) 941-4500
Source:
Exprealty
Added: Dec 12, 2025
Changed: Oct 12
Last Checked: Oct 21 at 1:59AM
Displayed information is deemed reliable but is not guaranteed and should be independently verified. All listing content including descriptions, pricing, images are the copyrighted material of REMAX Bayshore - West Shore Dr TC

Ask AI about this property
Review the available facts, identify missing information and prepare questions for the agent.
Investment Insights
Based on property information with market context.
A 4.35-acre mixed-use development site with an approved PD for a building footprint of 32,300 sq ft and a 45-foot height requirement. The plan includes retail on the first floor with capacity for up to 19 units, plus two floors of residential condominium units. Site infrastructure is fully developed, including underground sewer, water, electric, cable, and storm water management. An included 12,000 sq ft mixed-use building known as the former Williamsburg Dinner Theatre is part of the offering.
The property is located on a busy thoroughfare with easy access and is described as being within approximately a 1/4 mile of the east arm of Grand Traverse Bay and the newly renovated public Bayside Park. It is directly adjacent to Acme Meijer. Additional nearby context referenced in the remarks includes proximity to Turtle Creek Casino and the Grand Traverse Resort & Spa.
The site also provides direct access to the TART Trail and includes a newly constructed bridge over cascading Acme Creek, connecting to an adjoining KOTI property referenced in the remarks.
The property is located on a busy thoroughfare with easy access and is described as being within approximately a 1/4 mile of the east arm of Grand Traverse Bay and the newly renovated public Bayside Park. It is directly adjacent to Acme Meijer. Additional nearby context referenced in the remarks includes proximity to Turtle Creek Casino and the Grand Traverse Resort & Spa.
The site also provides direct access to the TART Trail and includes a newly constructed bridge over cascading Acme Creek, connecting to an adjoining KOTI property referenced in the remarks.
Key Highlights
- 4.35‑acre mixed‑use development site with an approved PD for a 32,300 SF building footprint and 45‑ft height requirement
- PD allows retail on floor 1 for up to 19 units plus 2 floors of residential condominium units
- All site infrastructure is developed, including underground sewer, water, electric, cable, and storm water management
Financial Insights
Estimated NOI and Cap Rate
NOI / Yr
$148,378
Cap Rate
7.44%
Suggested Prices Based on Cap Rates
Cap Rate 5%
$2,967,560
$3.0M
Cap Rate 7%
$2,119,686
$2.1M
Cap Rate 9%
$1,648,644
$1.6M
Market Conditions
NOI Build-Up for 12,000 SF
Gross rent
$230.4K $19.20/SF
− Vacancy
−$18.4K −$1.54/SF
EGI
$212.0K $17.66/SF
− OpEx
−$63.6K −$5.30/SF
NOI
$148.4K $12.36/SF
Area
Grand Traverse County, MI
Vacancy
8.00%
Lease Rate
$19.20 /SF/Yr
Expense Ratio
30.00%
Simulate Cap Rate and NOI
Suggested Prices Based on Cap Rates
Cap Rate 5%
$2,967,560
Cap Rate 7%
$2,119,686
Cap Rate 9%
$1,648,644
Alternative Uses
Best Use
Retail
$2.12M
$1.85M – $2.47M
NOI $148,378 @ 7.0% cap · market cap 7.44%
Second Best
Mixed Use
$1.46M
$1.28M – $1.71M
NOI $102,375 @ 7.0% cap · market cap 5.13%
Theoretical Best
Office A
$2.61M
$2.28M – $3.04M
NOI $182,477 @ 7.0% cap · market cap 9.15%
Zoning and permitted uses should be independently verified with authorities.
How Realmo checks its estimates
Property Analytics
Who owns this building?
See the owner, sales and loan history
Open Analytics
Current Use
Lease Details
Yes
Paved road access
Yes
Utilities to site
Location Intelligence
Trade Area within ½ mile
172
Businesses Nearby
29k
Monthly Visits Nearby
Explore this area
Business Placement
Foot Traffic Nearby
Dining 74%
Apparel 21%
Shops & Services 6%
McDonald's
Dining
21,330 visits/mo
0.5 miles
Goodwill
Apparel
5,951 visits/mo
0.4 miles
Advance Auto Parts
Shops & Services
1,669 visits/mo
0.3 miles
Demographics for 49690, MI
6,494
Population
3,476
Households
1.9
Avg Household Size
50
Median Age
45%
College-Educated
97%
High-School Grad
82.7 sq mi
ZIP Area
79
Density / Sq Mi
$105,701
Median Household Income
$47,114
Median Earnings
$1,279
Median Rent
$329,100
Median Home Value
Check the figures for this property
Cap Rate, Value Estimation, Potential NOI and more
View Realmo Analytics
Market
Vacancy Rate% for Retail in Midwest region




Frequently Asked Questions
What type of property is this?
Mixed-use property - Shovel-ready mixed-use site with fully developed utilities, an approved PD, and a 12,000-sq-ft existing mixed-use building.
Where is this mixed-use property located?
The property is located at 4160 M 72 E Williamsburg, MI.
What is the asking price?
The asking price for this property is $1,995,000.
What are key features of this property?
This property features: 4.35‑acre mixed‑use development site with an approved PD for a 32,300 SF building footprint and 45‑ft height requirement; PD allows retail on floor 1 for up to 19 units plus 2 floors of residential condominium units; All site infrastructure is developed, including underground sewer, water, electric, cable, and storm water management


