Two-Unit Duplex with
For Sale
$214,900
416 S James Street, Carthage, NY 13619
Residential, Carthage, NY
Property Size2,402 SF
Lot Size0.40 Acres
Price / SF$89.47
Days on Market102
Property Features for 416 S James Street
General Information
Property type
Residential Multi Family
Property subtype
Other
Bedrooms
6
Bathrooms
4
Full bathrooms
2
Half bathrooms
2
Rooms
Bedroom 2, Bedroom 1, Basement, Bathroom 1, Bathroom 3, Bedroom 3, Bathroom 2, Bedroom 4, Bedroom 5, Bedroom 6, Bathroom 4
Patio and Porch features
Porch
Interior features
CeilingFans
Exterior features
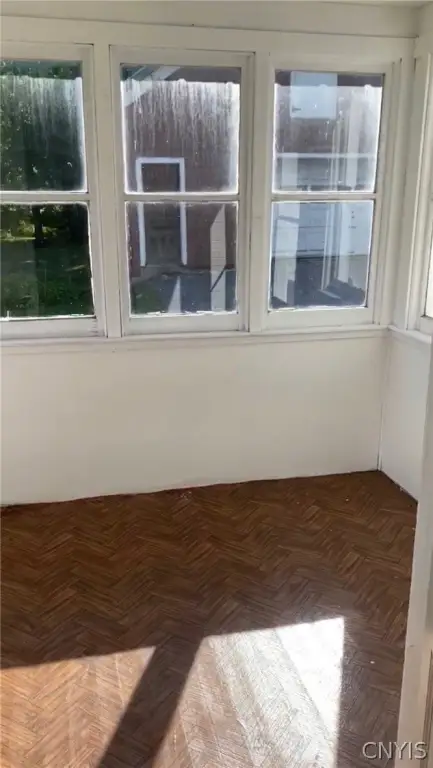
EnclosedPorch, Porch
Appliances
ElectricWaterHeater
Lot features
Rectangular, Rectangular Lot, Residential Lot
Elementary school
Carthage Elementary
Middle school
Carthage Middle
High school
Carthage Senior High
Elementary school district
Carthage
Middle school district
Carthage
High school district
Carthage
Directions
From State Street turn onto S. James St. Home will be on the right after the bottom of the hill. Look for sign
Subdivision
Carthage-Village-226001
Standard status
Active
APN
226001-086-041-0003-020-000
Size
2,402 SF
Lot size
0.40 Acres
Taxes and HOA fees
Tax Annual Amount
4004
Utilities
Heating system
Hot Water(Heating), Natural Gas
Water source
Public
Amenities
front porch
back porch
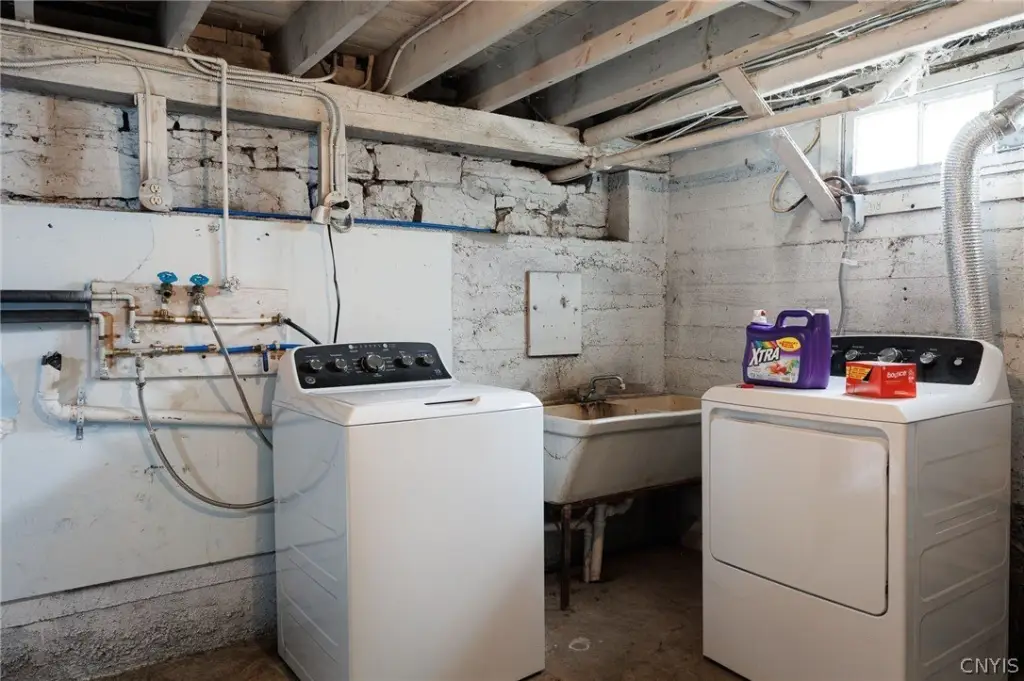
shared laundry area
Building Details
Year built
1880
Floors in Building
2
Number of units
2
Flooring type
Hardwood, Vinyl, Varies
Building materials
VinylSiding
Roof type
Asphalt, Metal
Listing Agency:
TLC Real Estate LLC - Carthage
(315) 493-1111
Listed By:
Marsha Gibbons · License #10491209646
(315) 783-6455
Added: Jul 16
Changed: Oct 22
Last Checked: Oct 25 at 11:06AM
MLS# S1699044
Copyright © 2026 New York State Alliance of MLSs, LLC. All rights reserved. All information provided by the listing agent/broker is deemed reliable but is not guaranteed and should be independently verified.

Ask AI about this property
Review the available facts, identify missing information and prepare questions for the agent.
Investment Insights
Based on property information with market context.
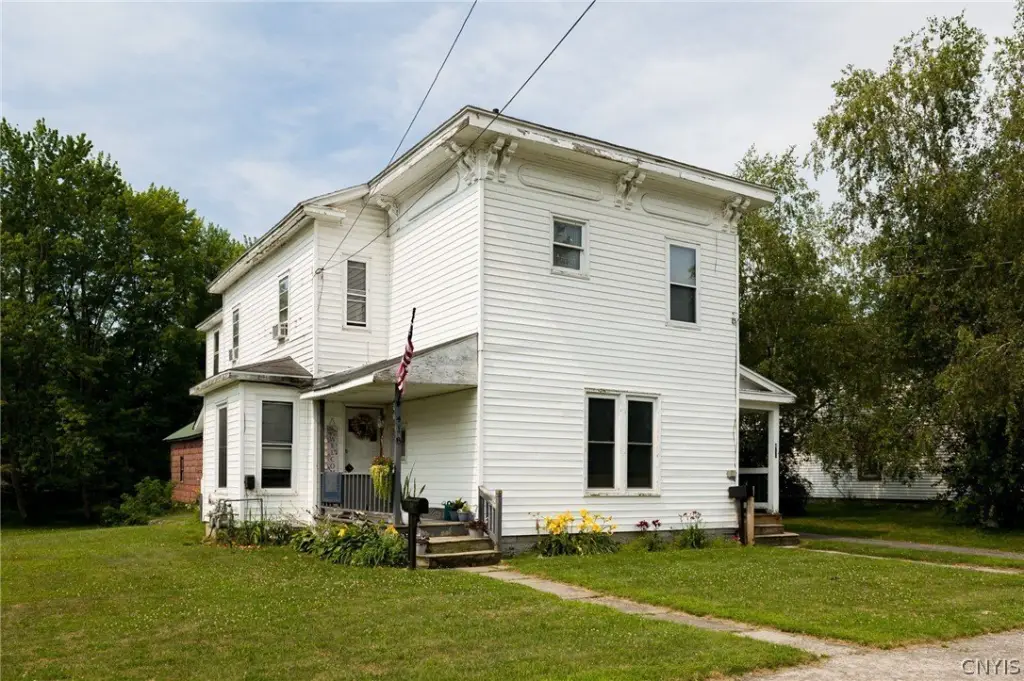
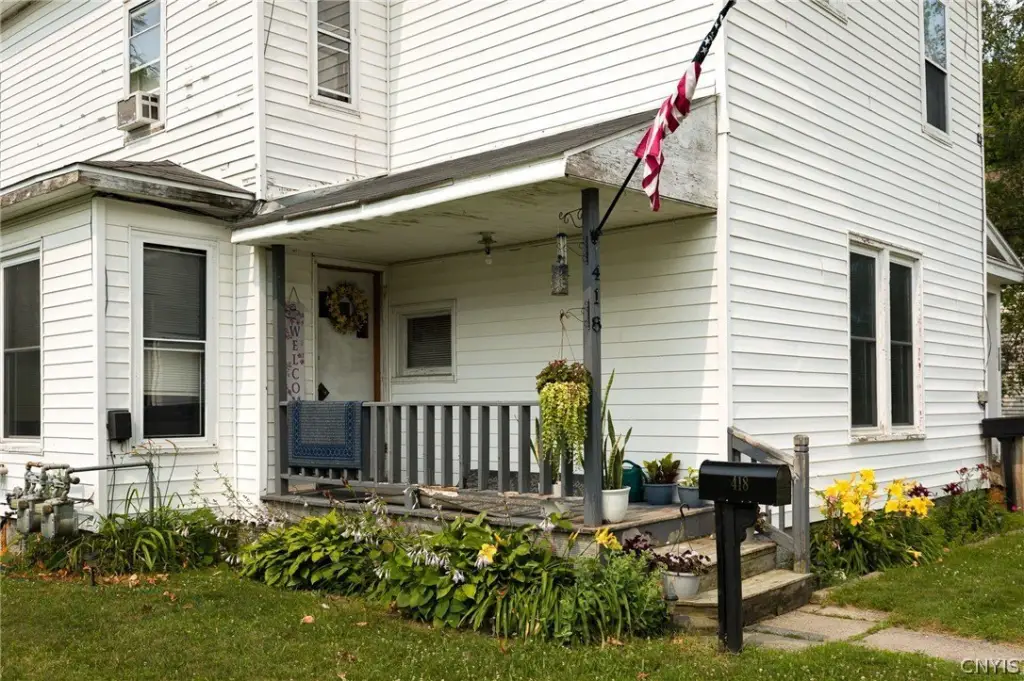
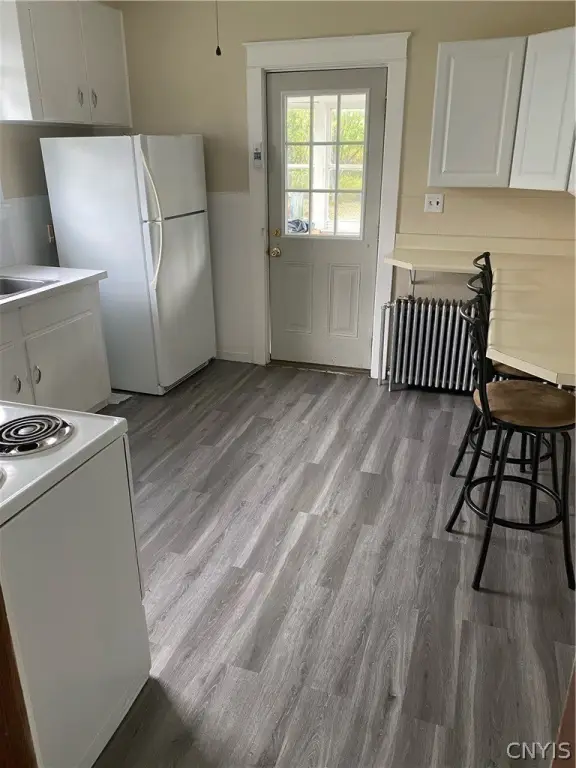
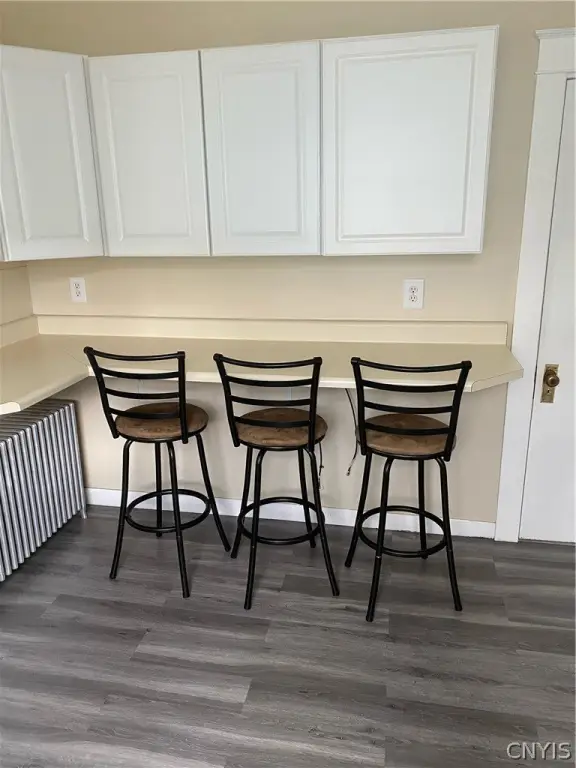
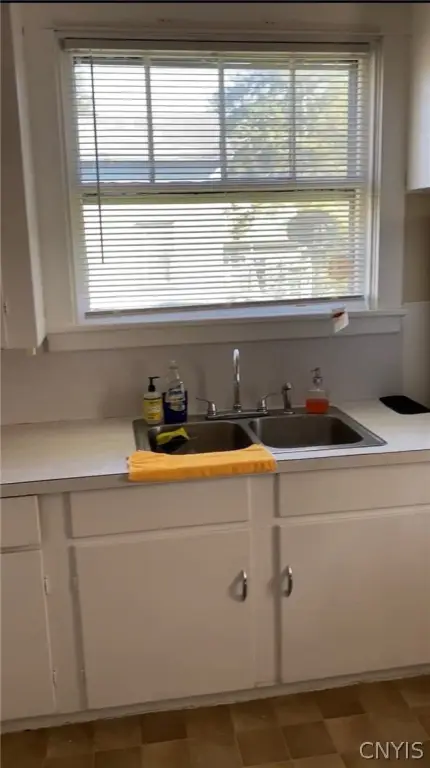
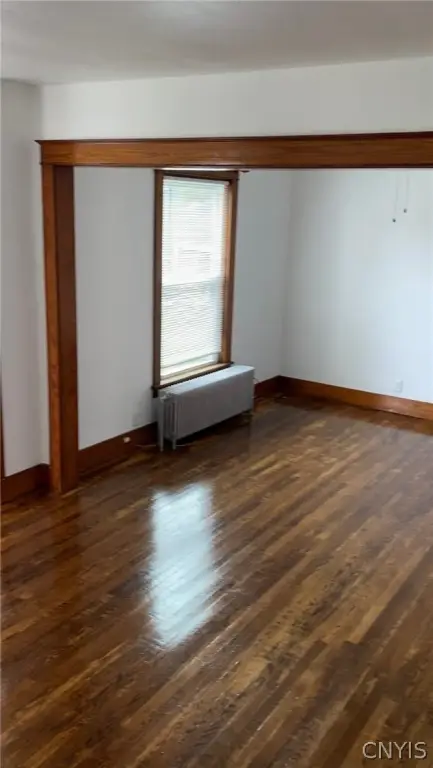
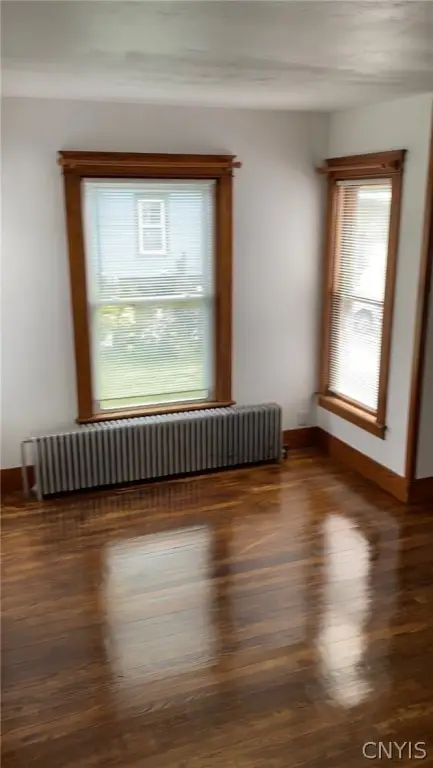
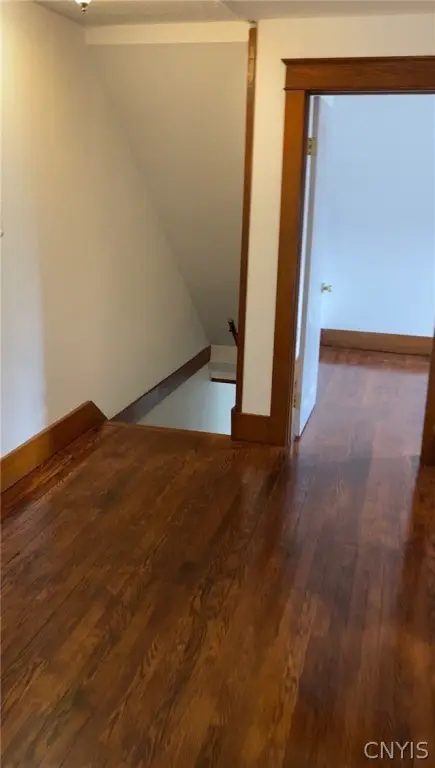
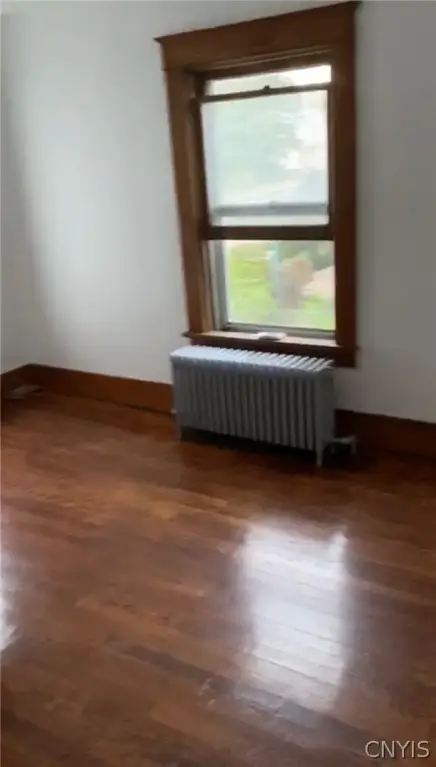
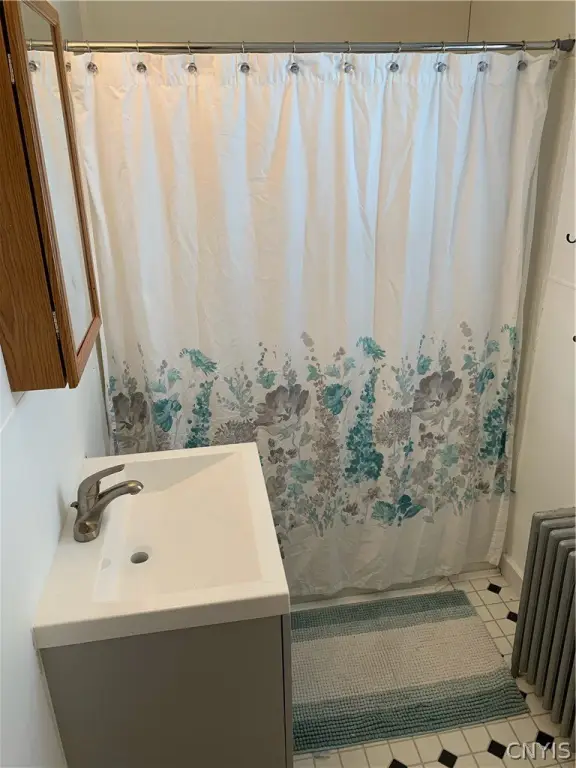
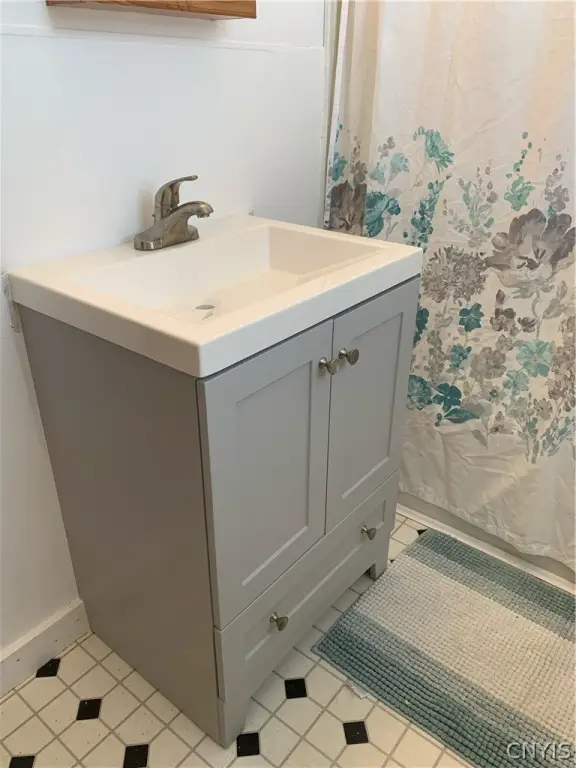
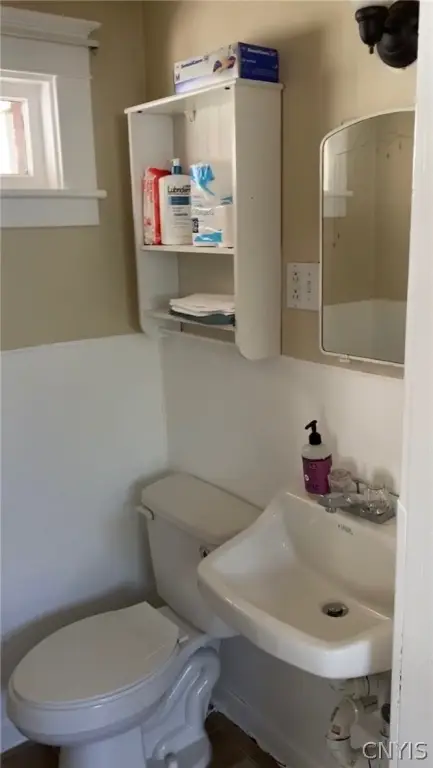
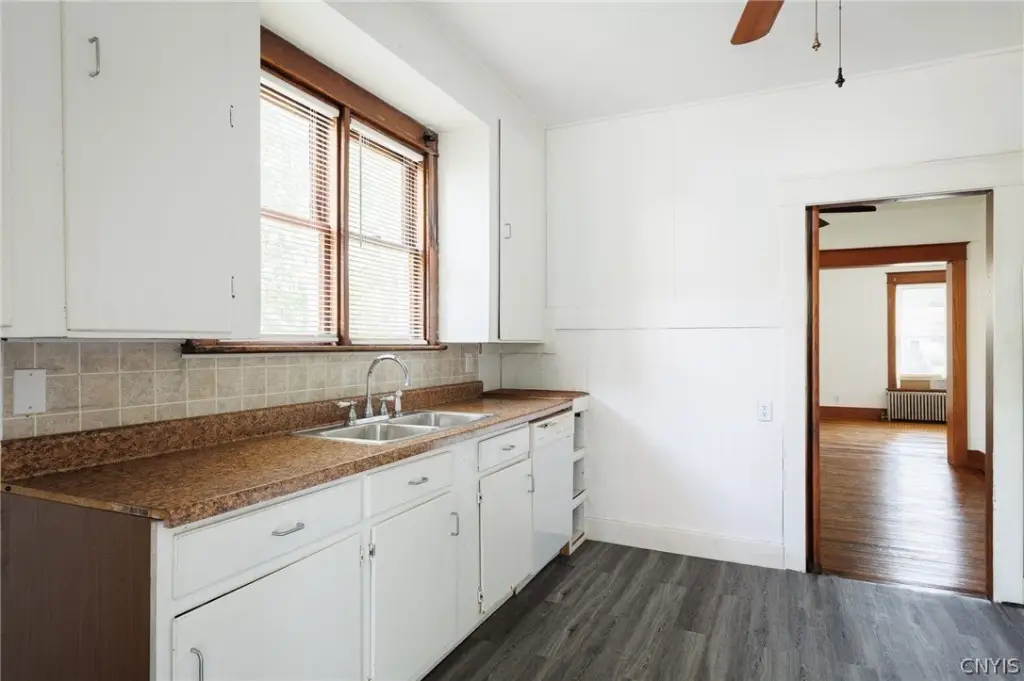
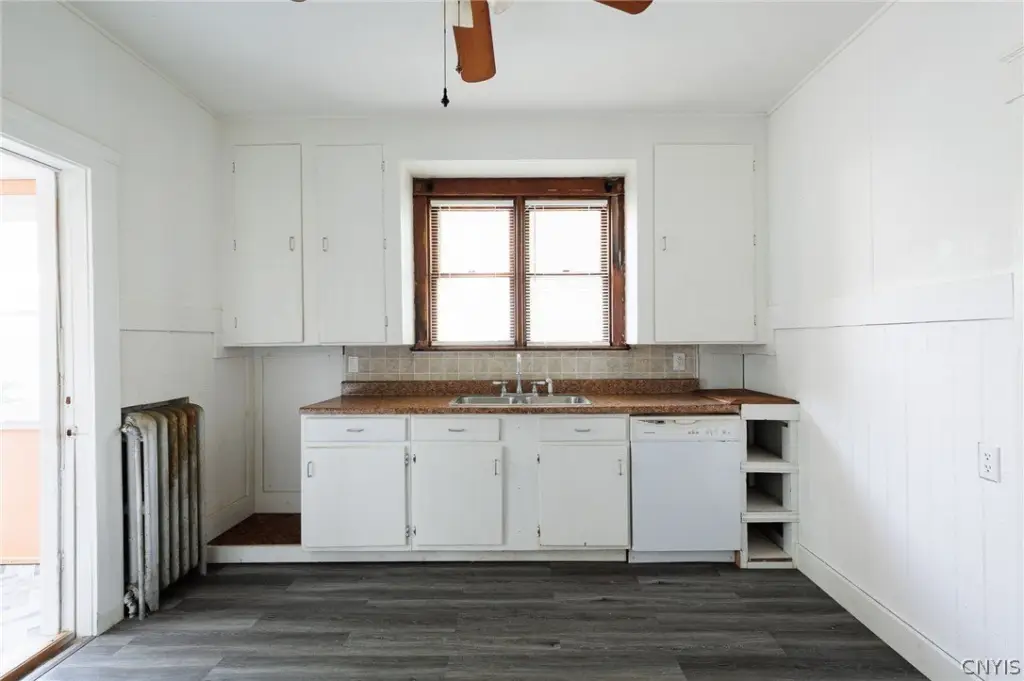
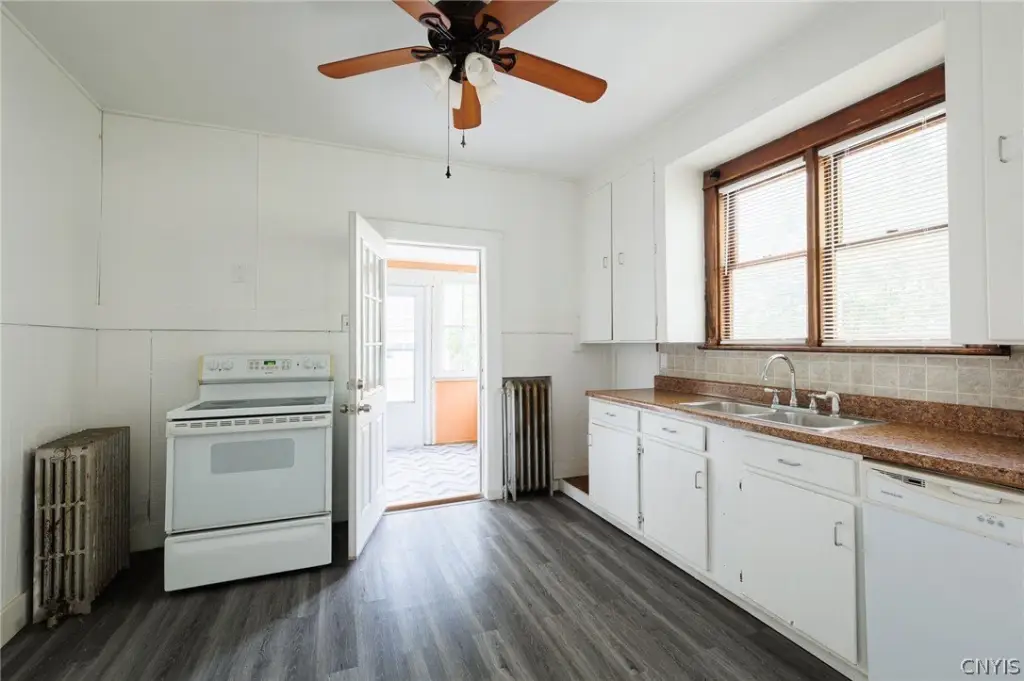
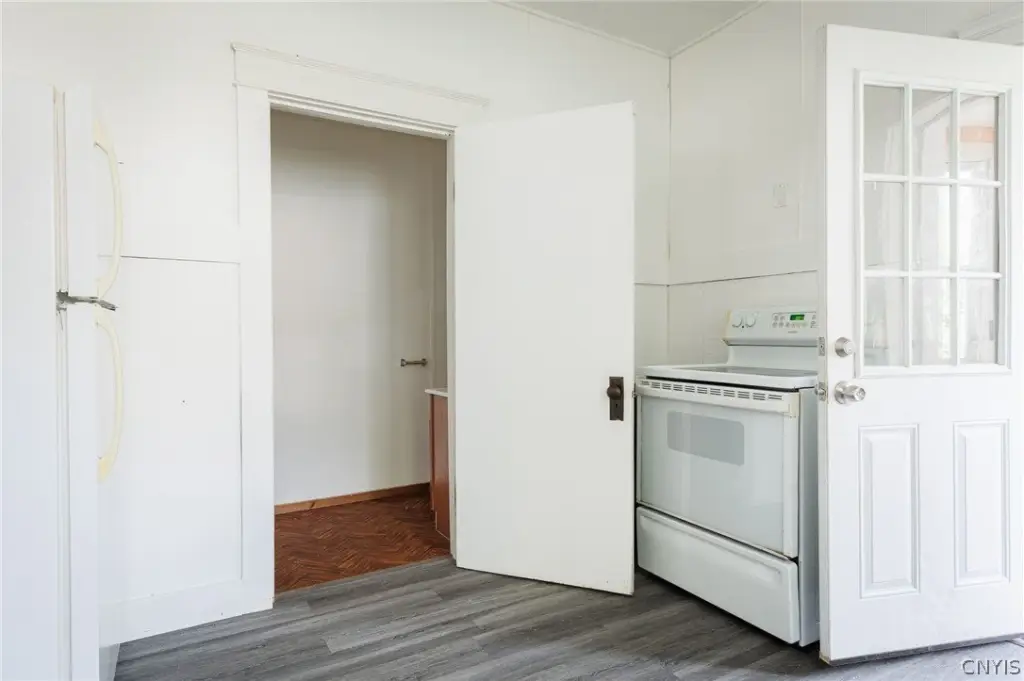
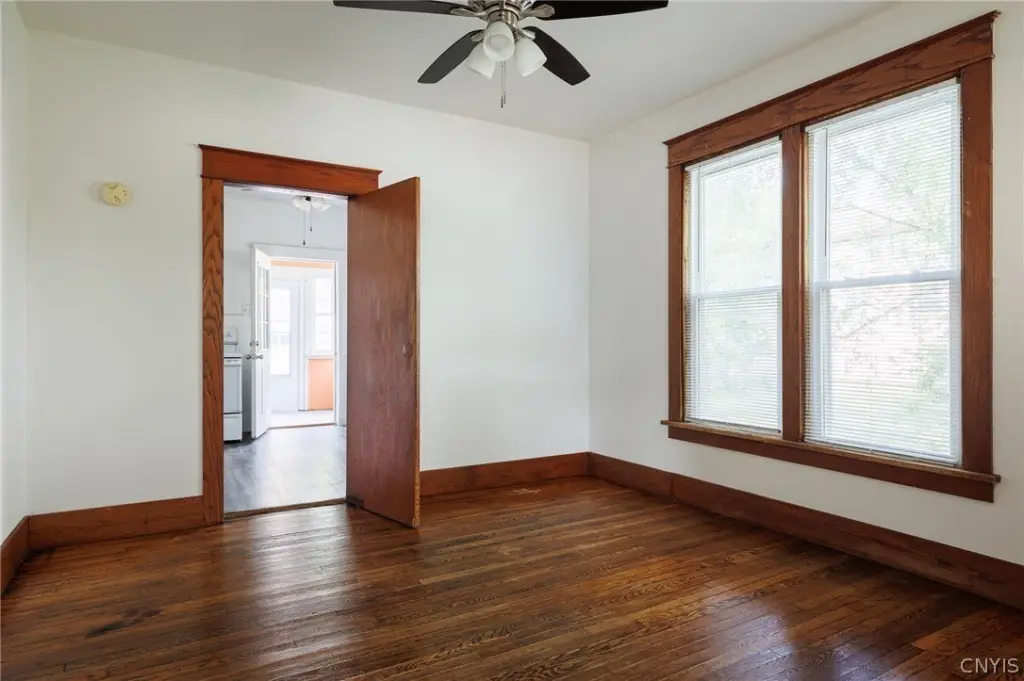
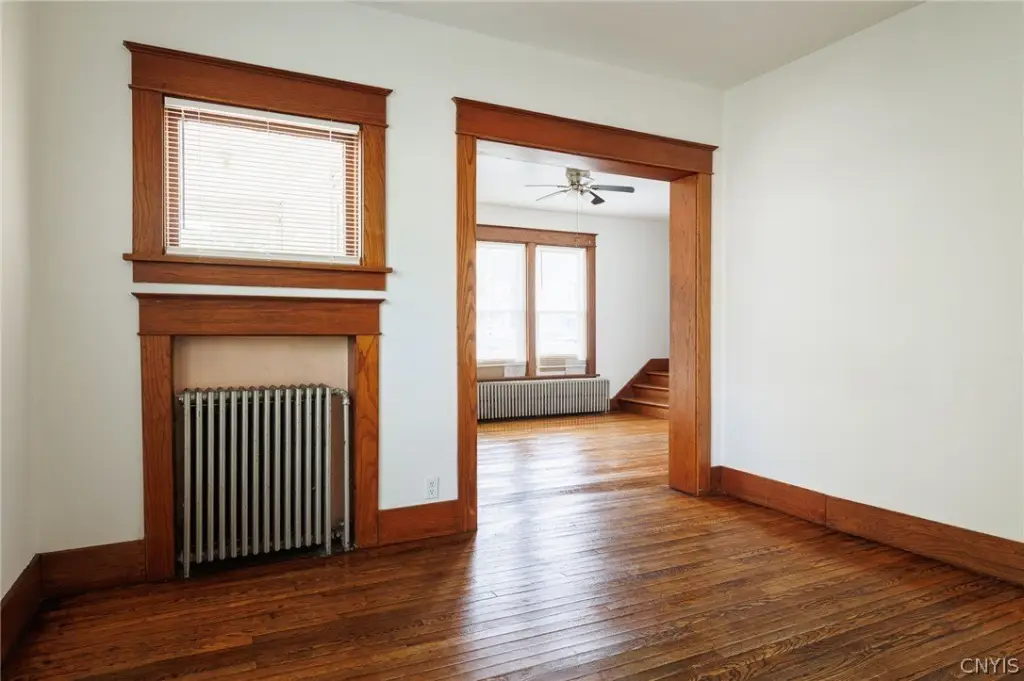
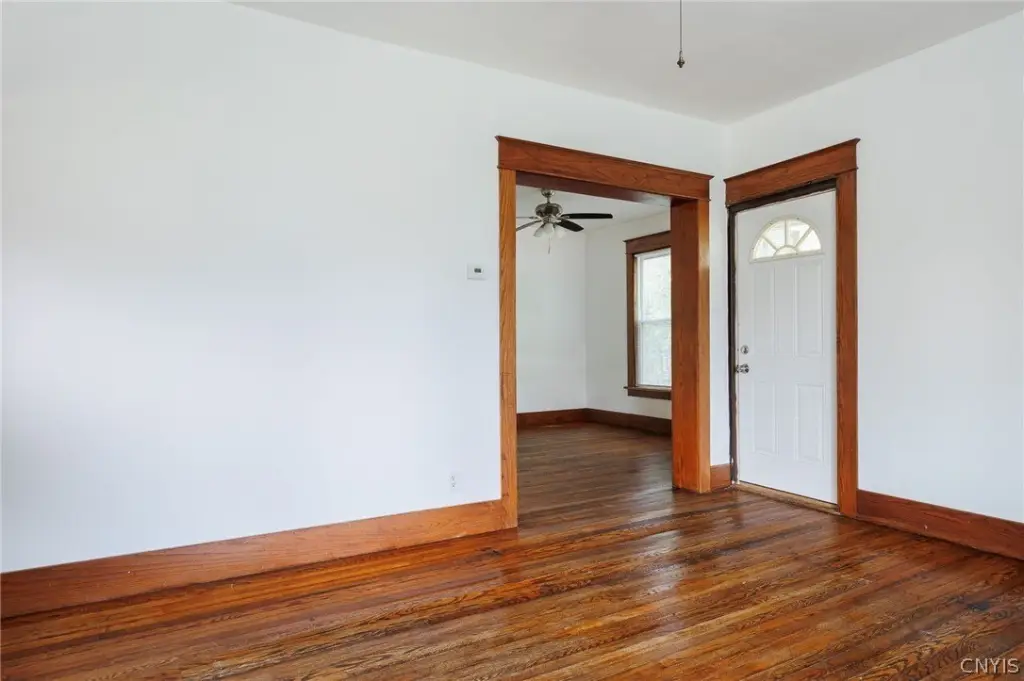
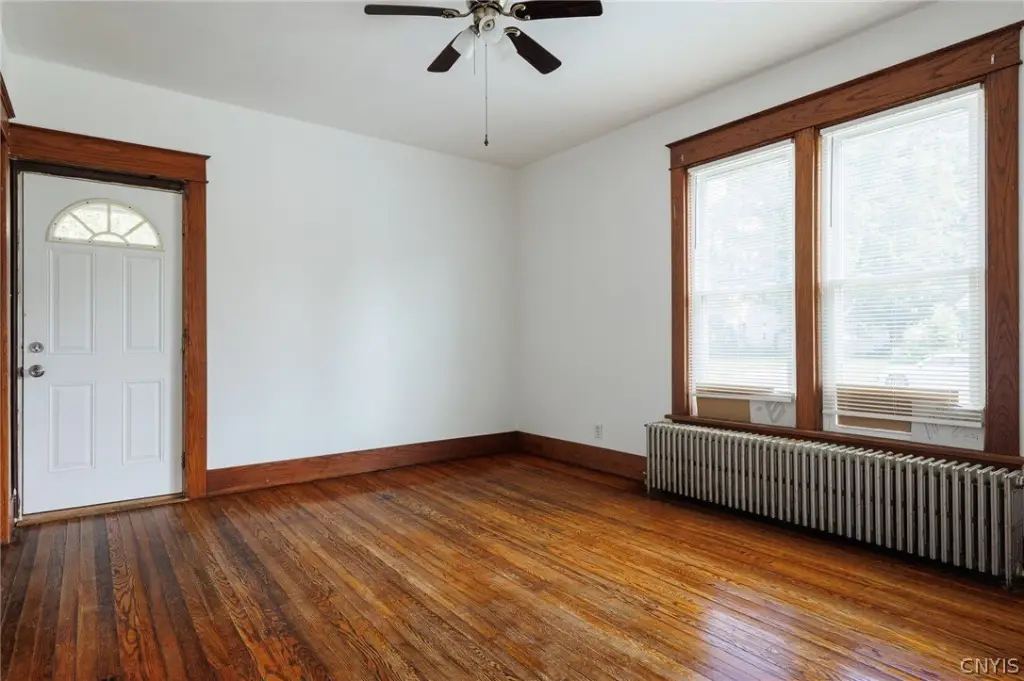
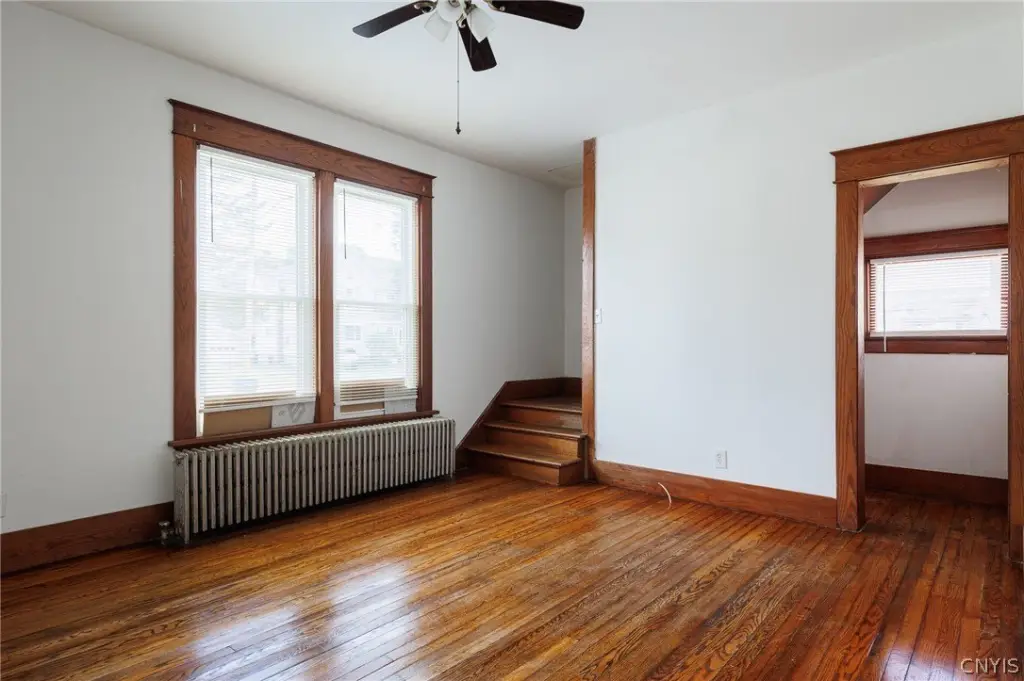
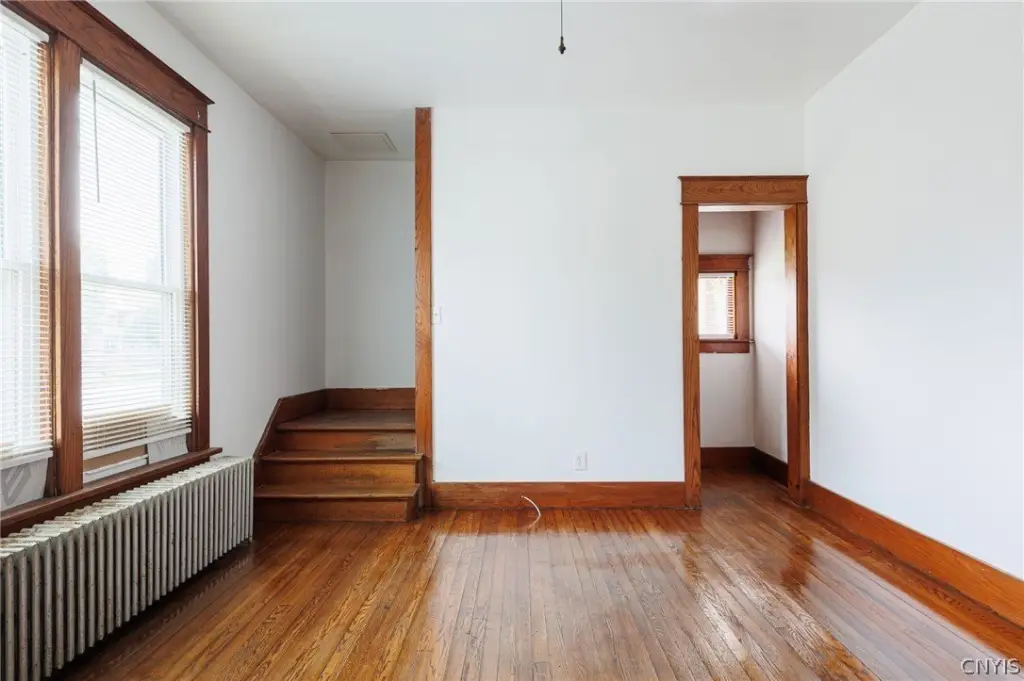
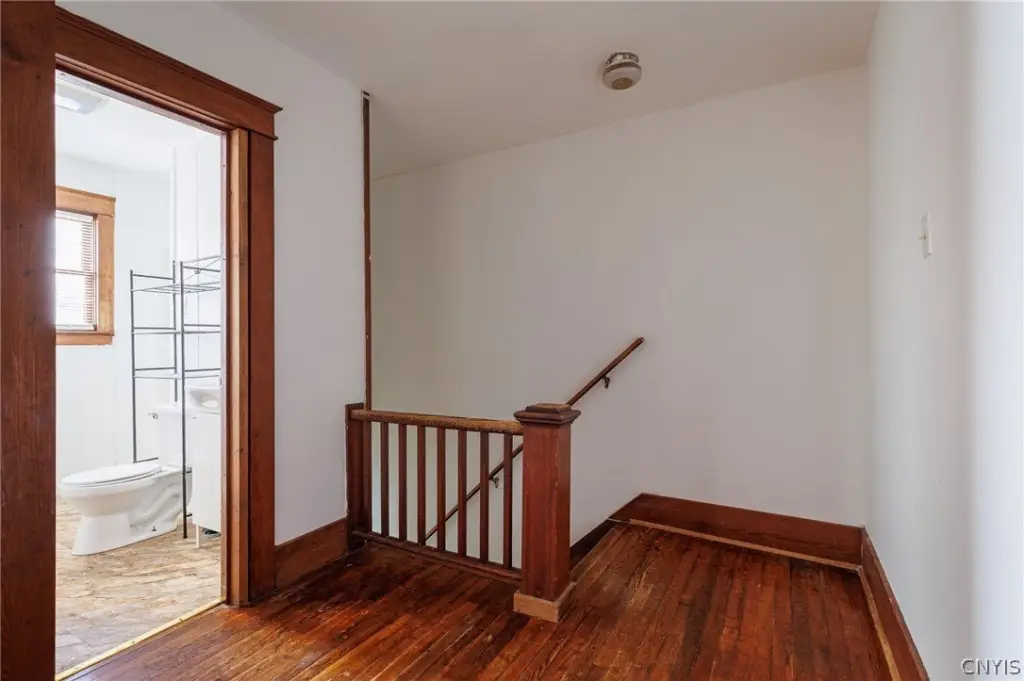
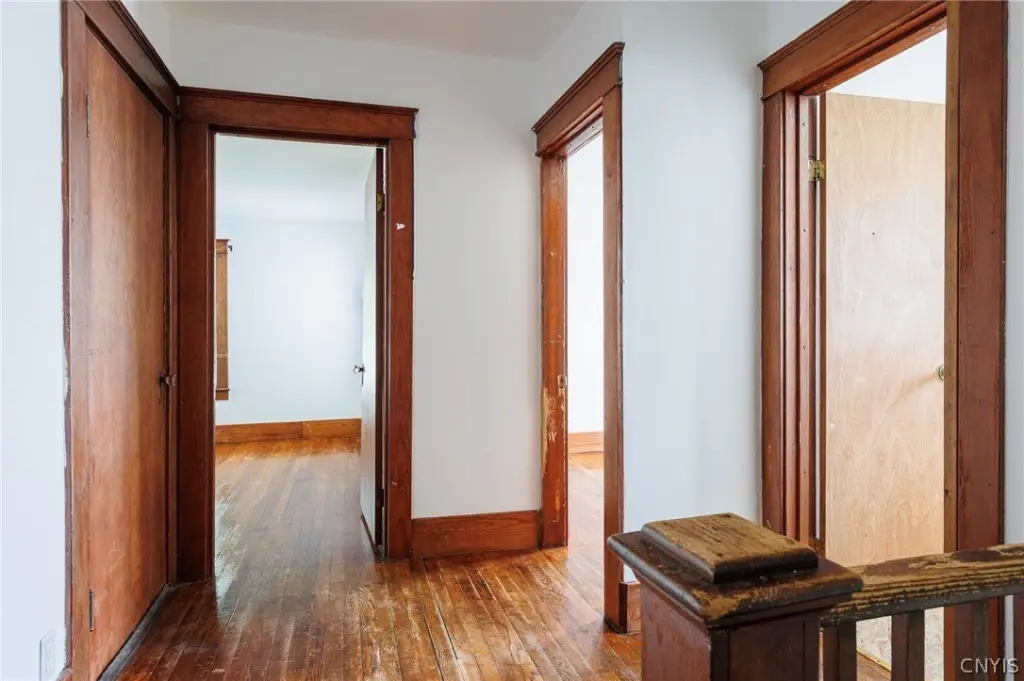
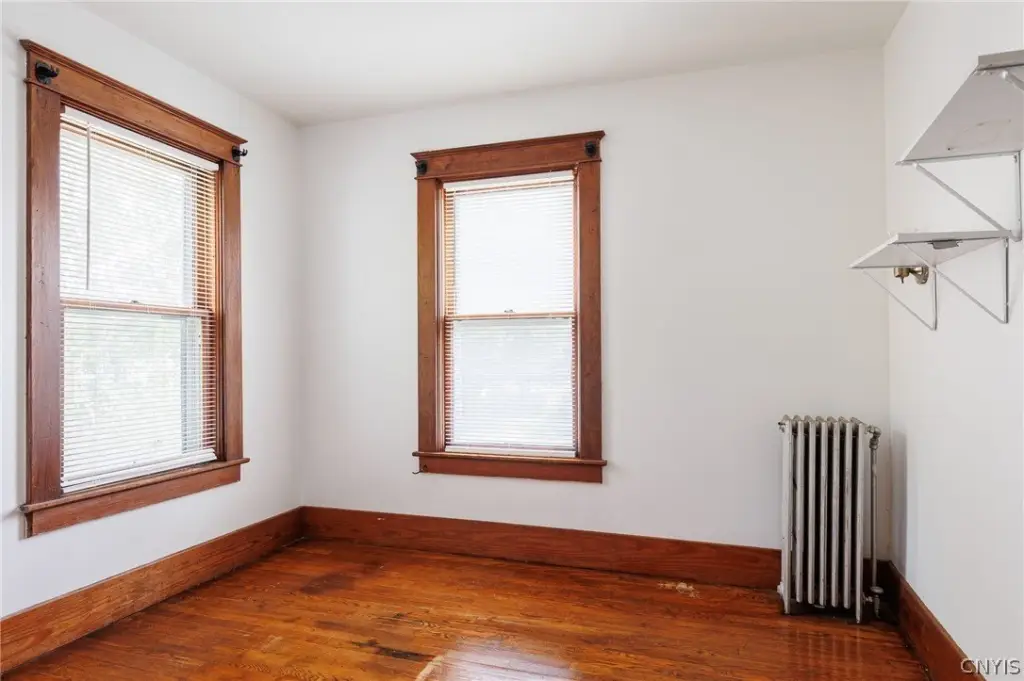
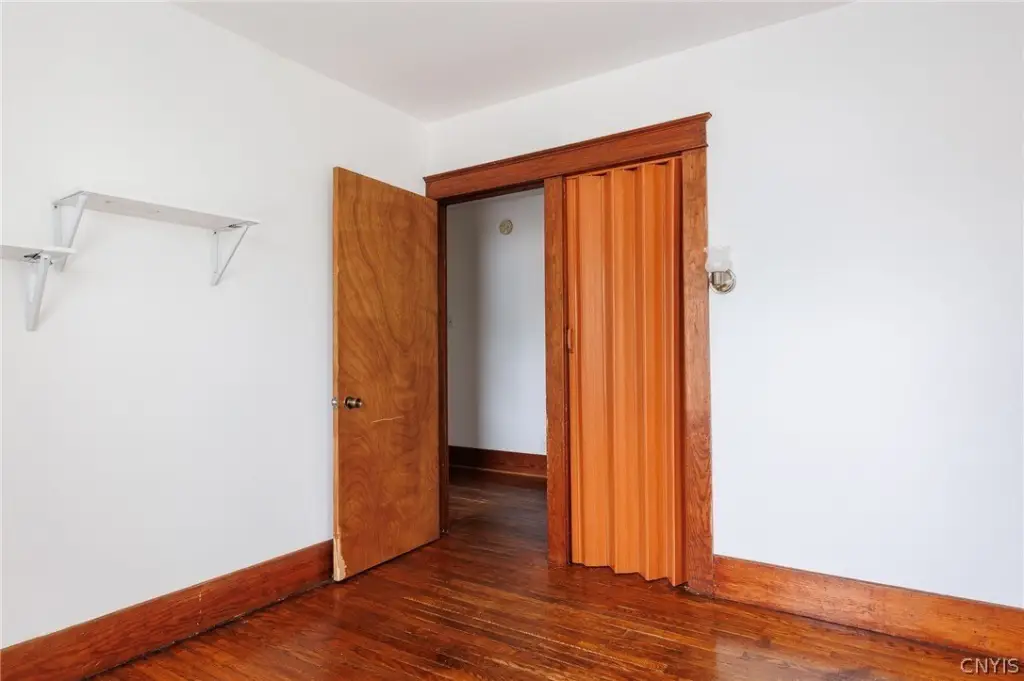
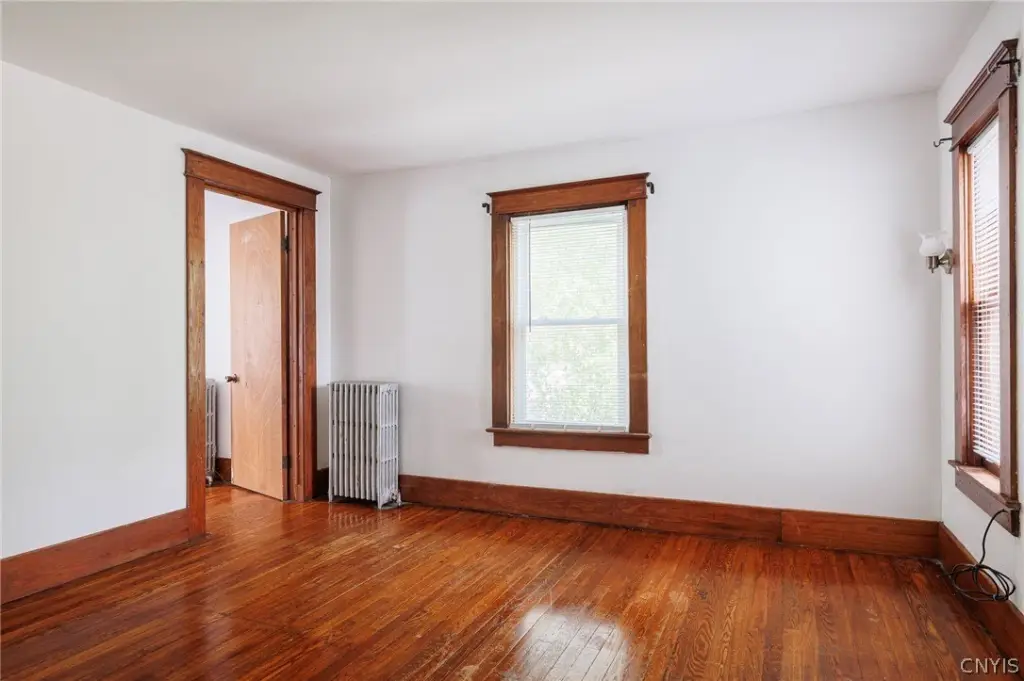
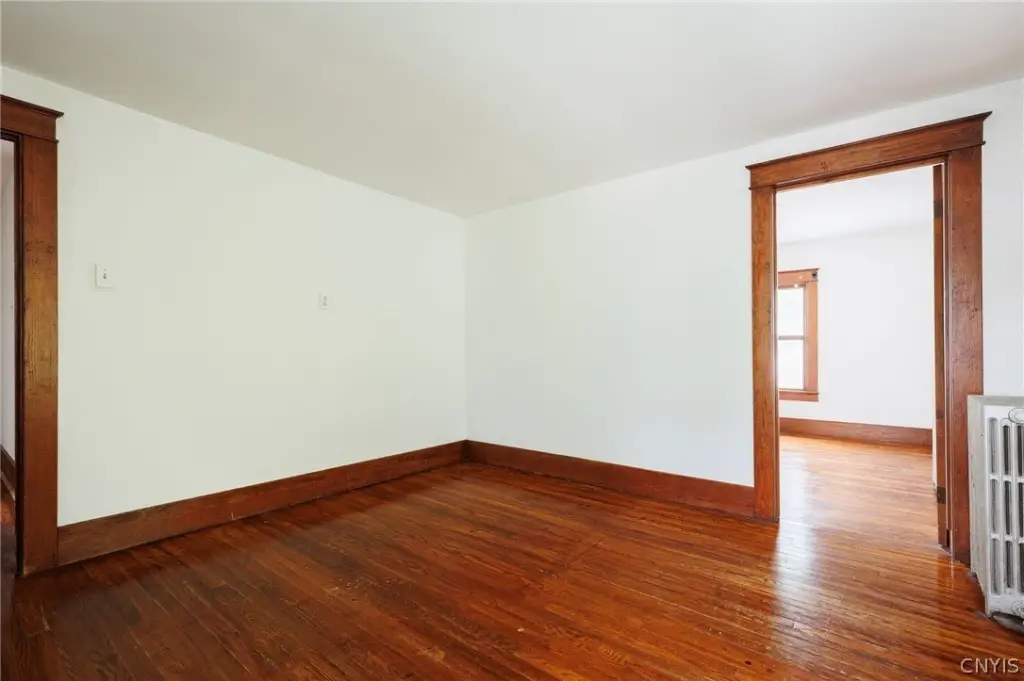
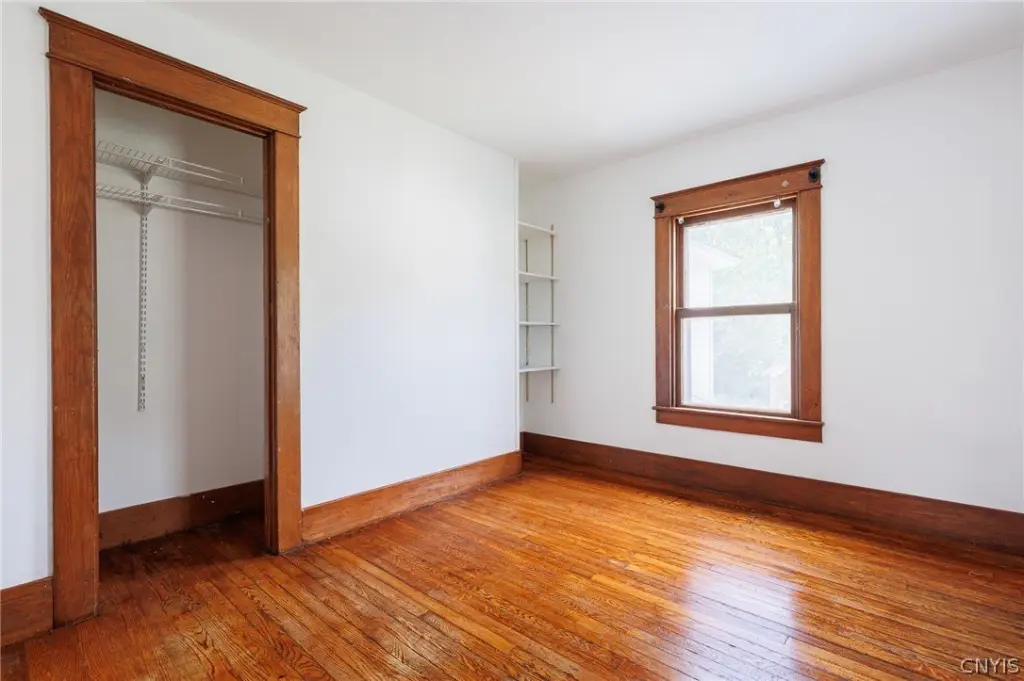
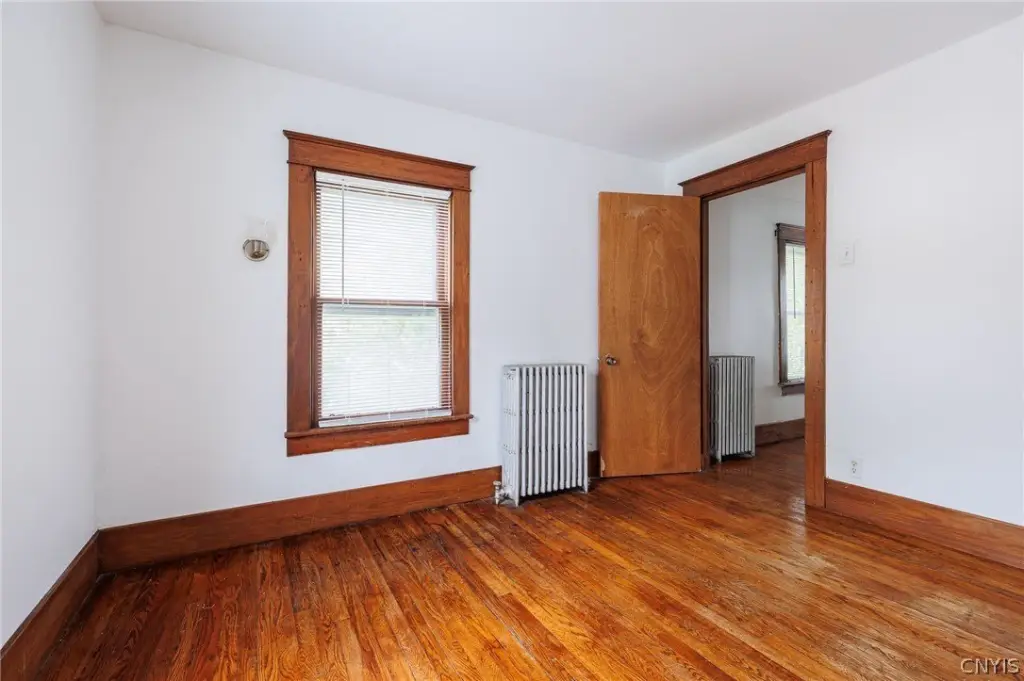
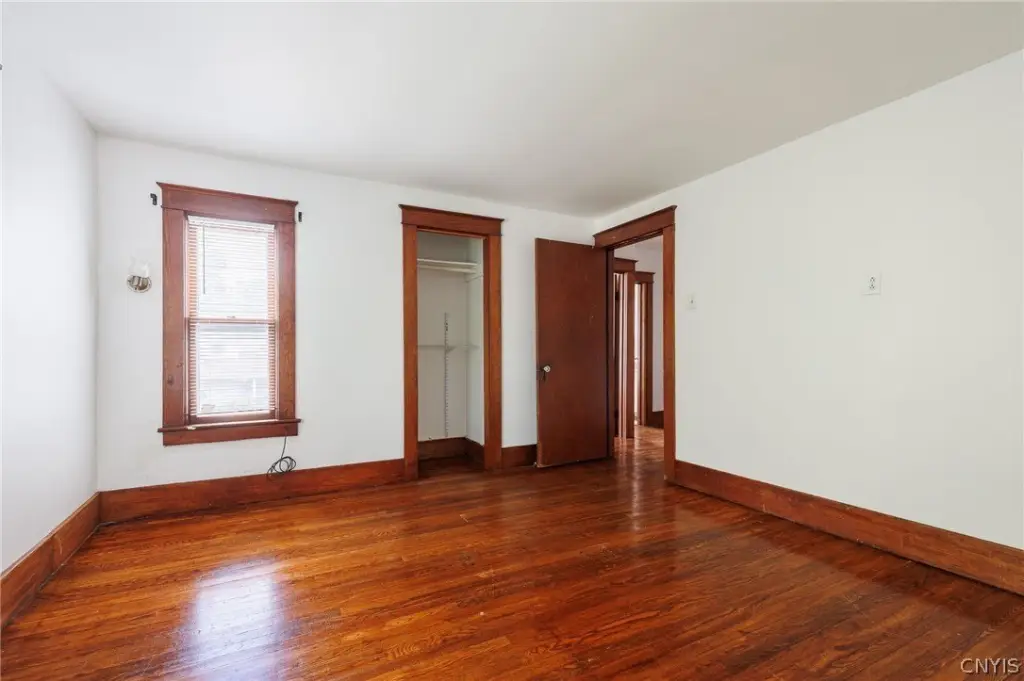
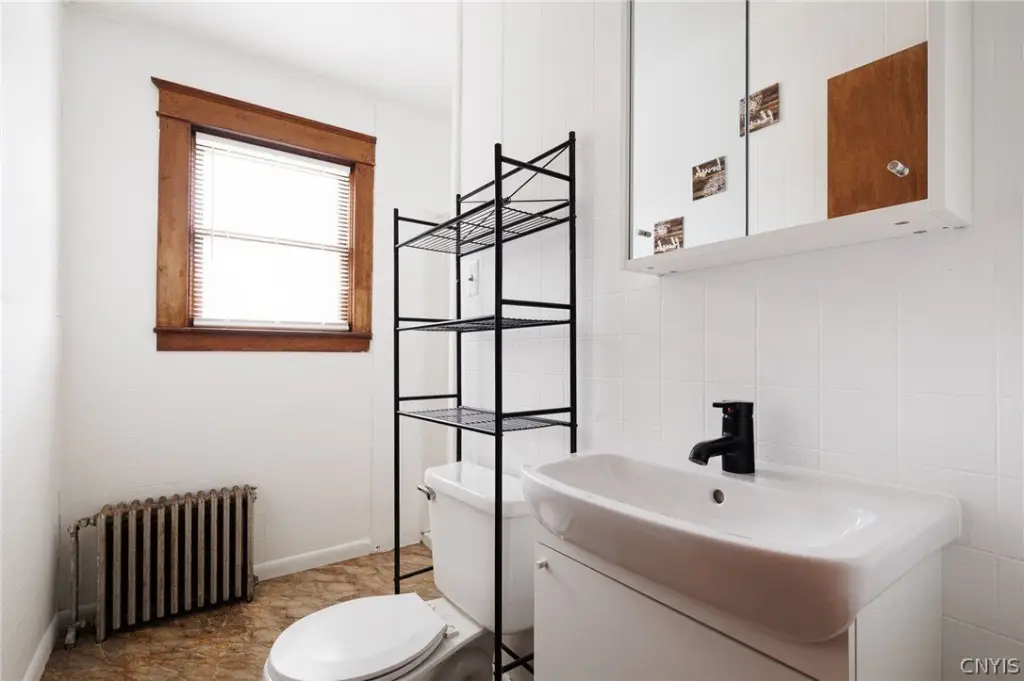
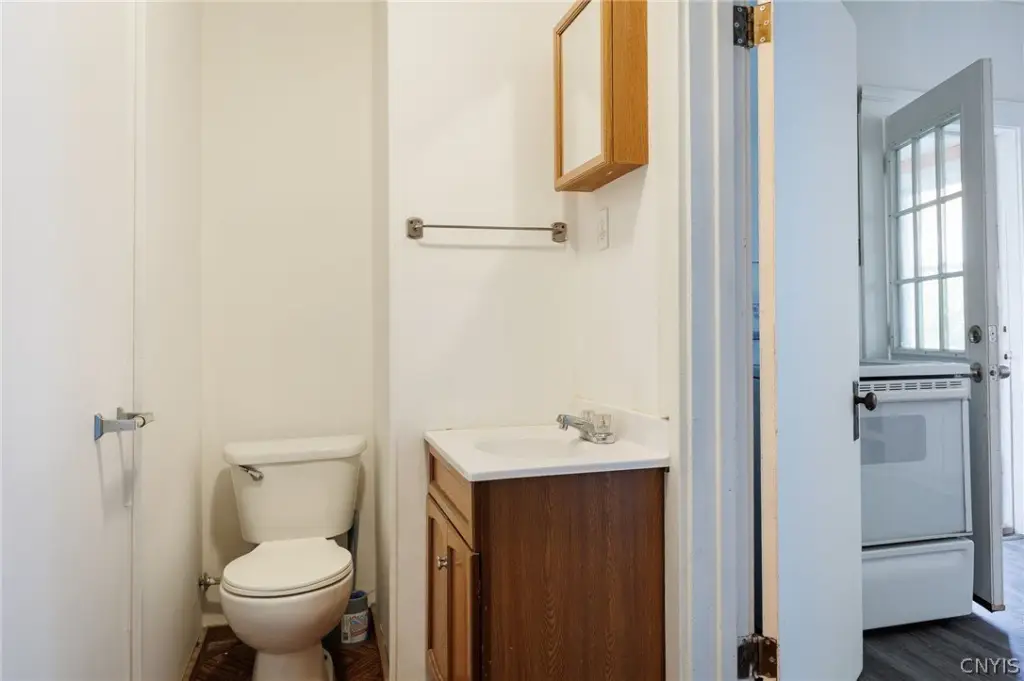
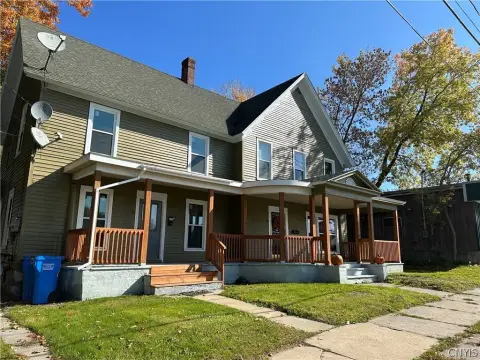
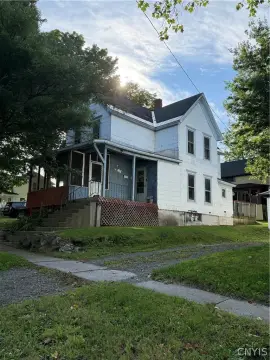
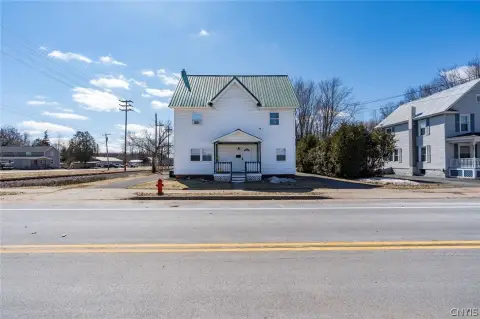
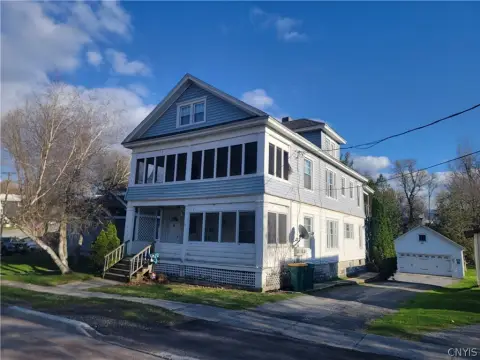
This 2,402-square-foot duplex, built in 1880, contains two two-story apartments with matching layouts. Each unit includes three bedrooms, one full bathroom, a half bath, kitchen, dining room, living room, entry closet, and front and rear porches. Original hardwood flooring and woodwork remain throughout, complemented by vinyl flooring in selected areas. One apartment has a bathroom renovated approximately two years ago; the other has fresh paint and a new vanity.
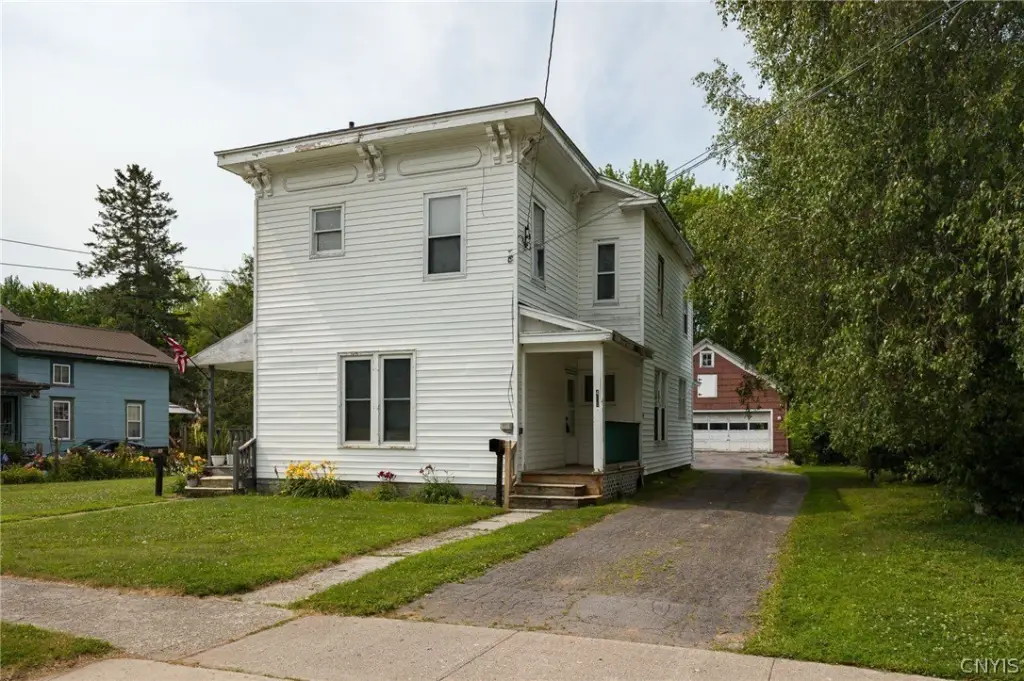
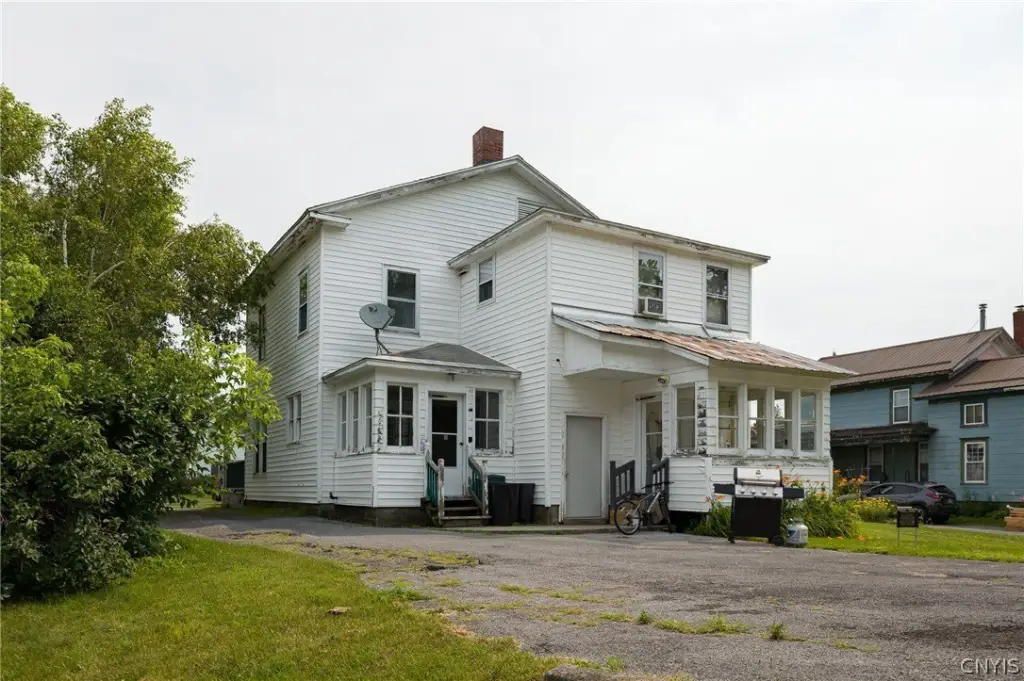
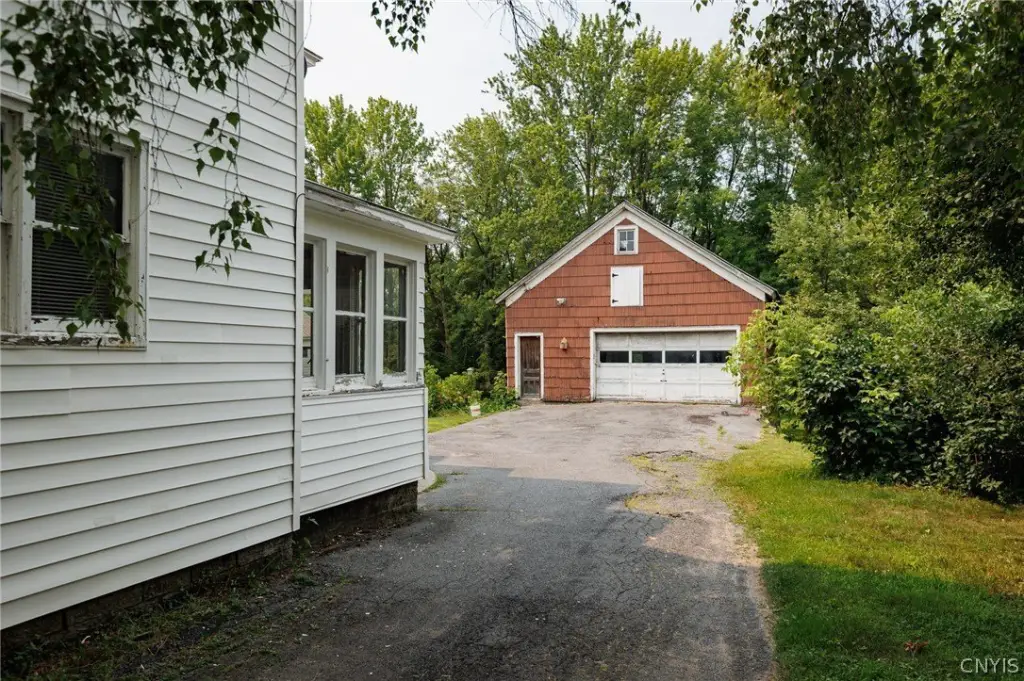
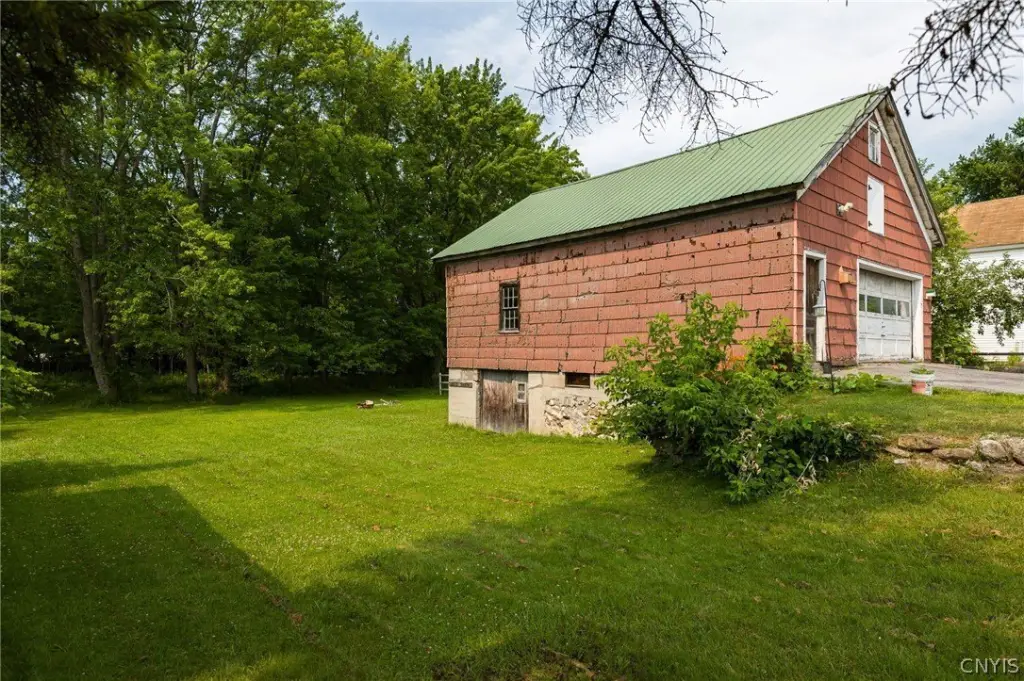
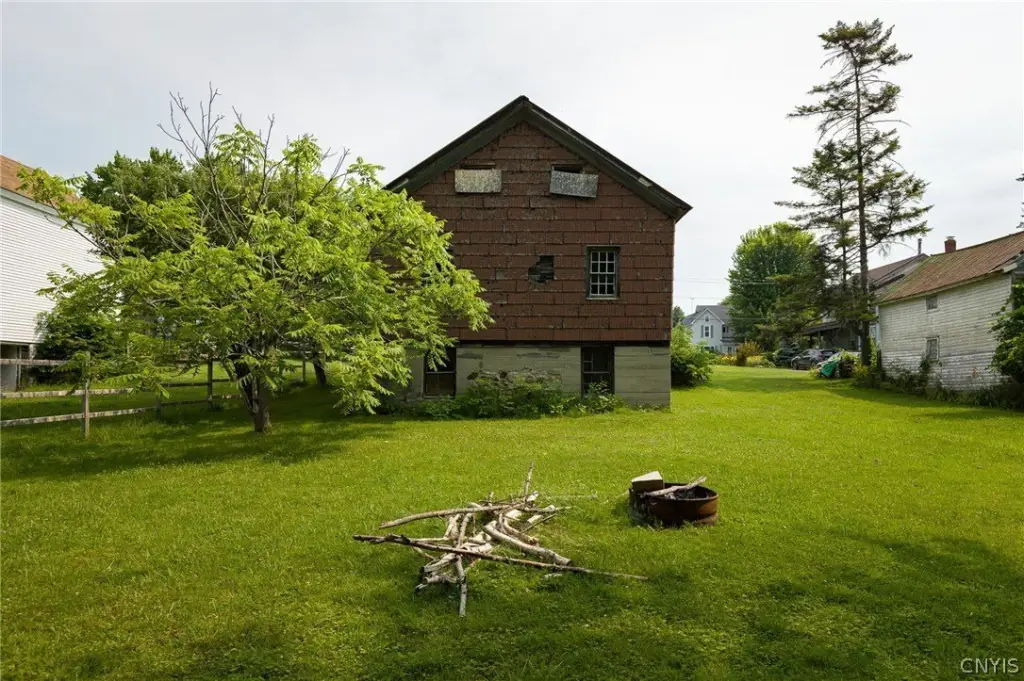
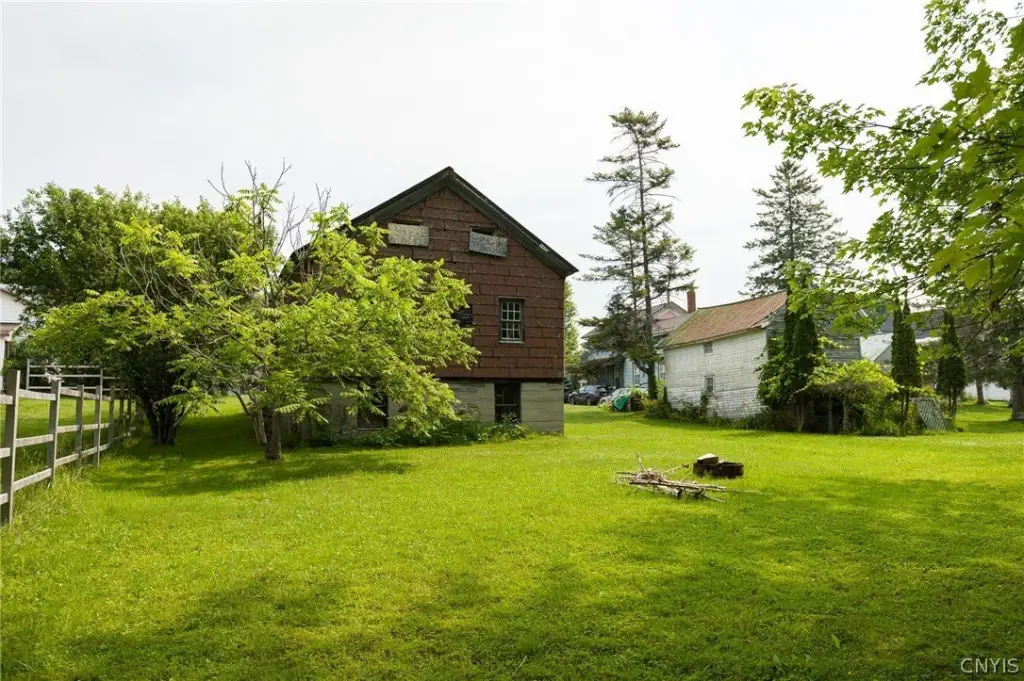
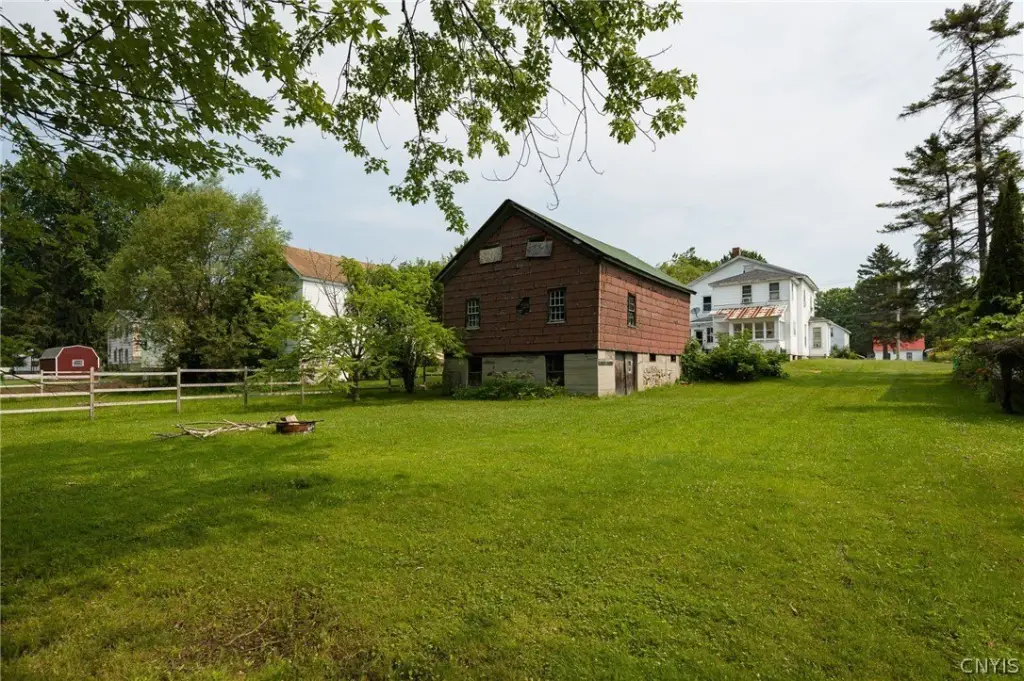
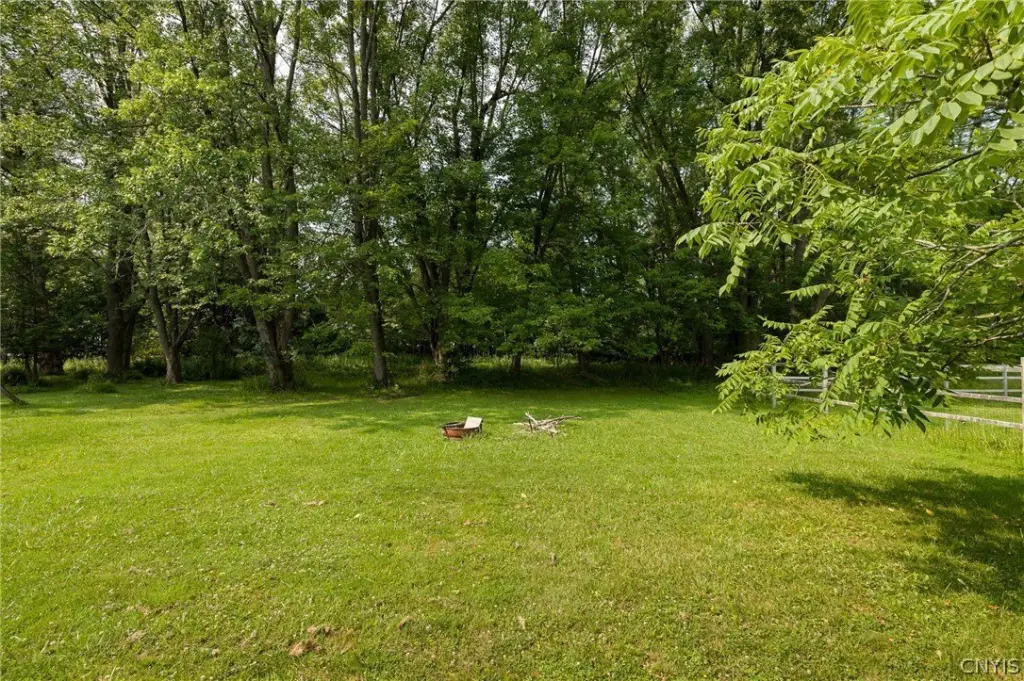
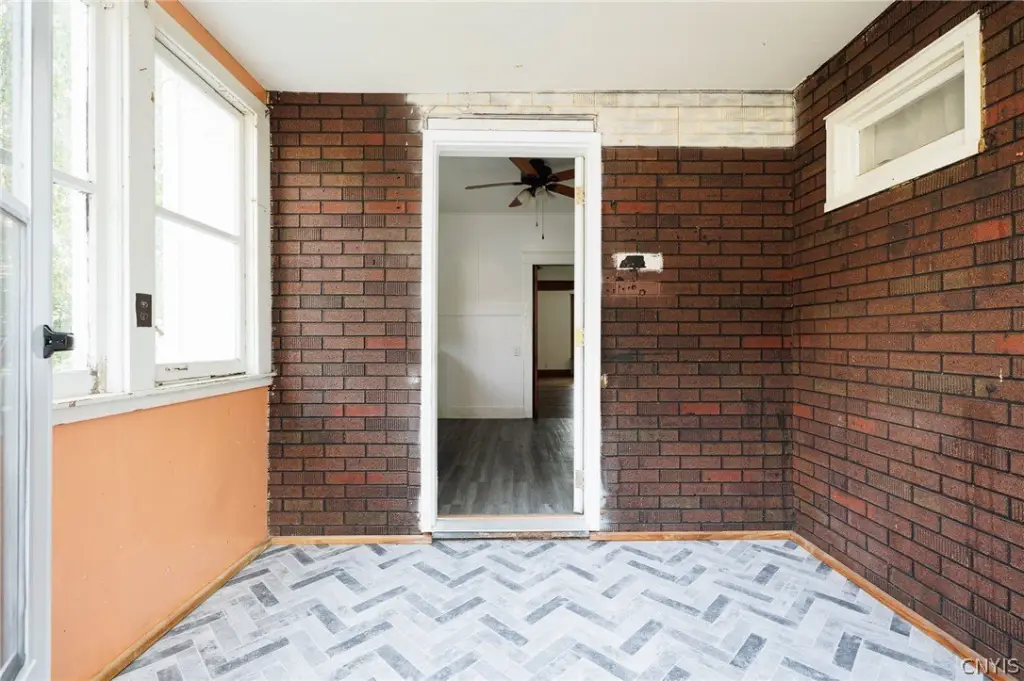
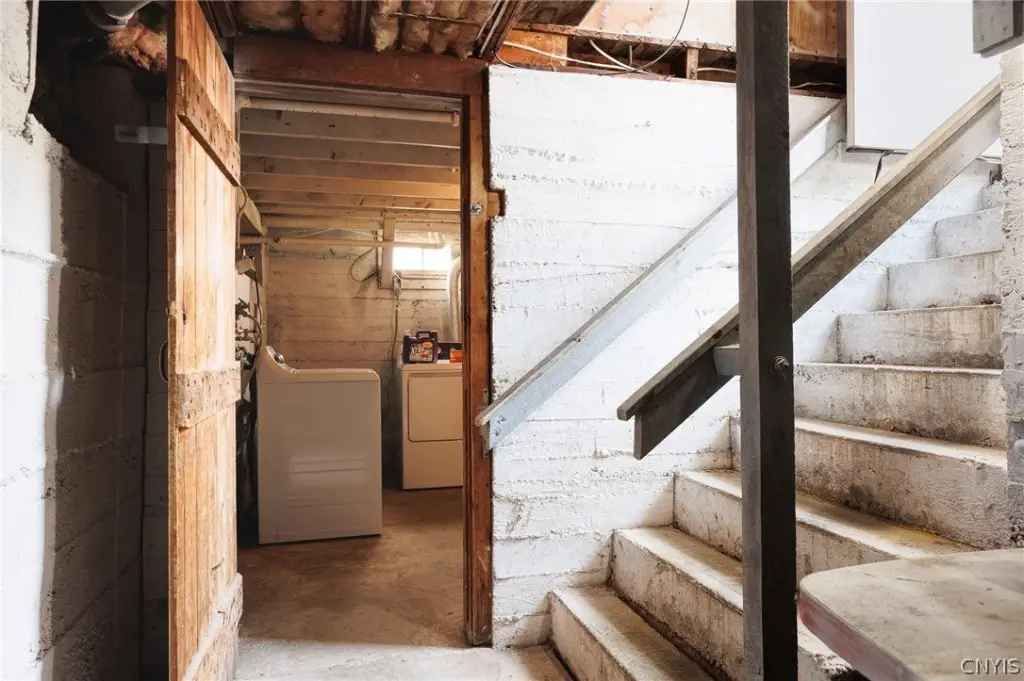
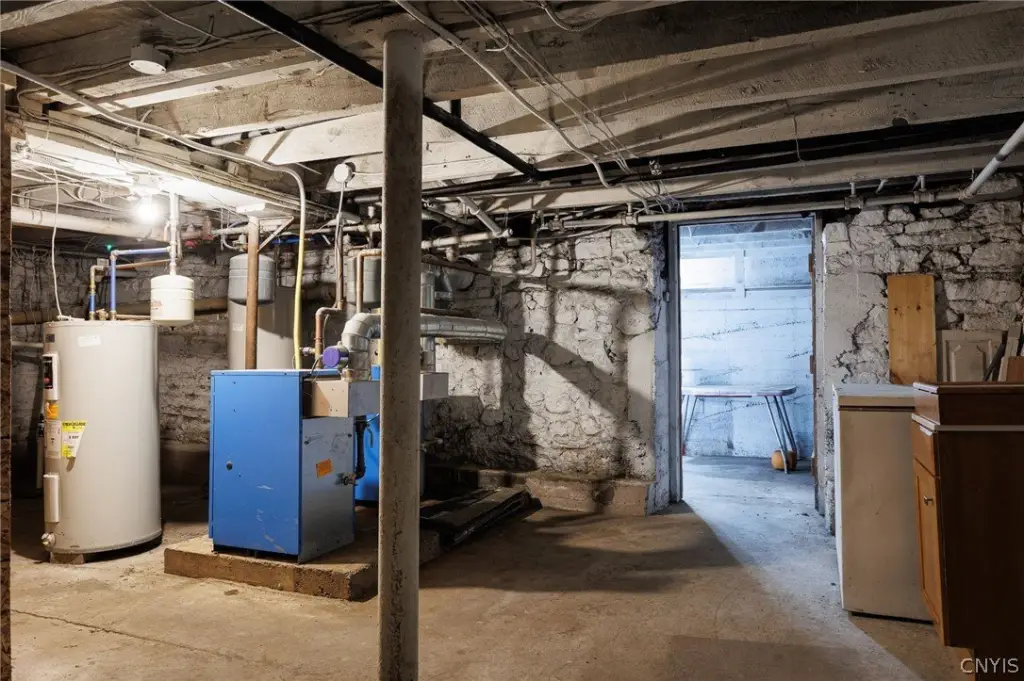
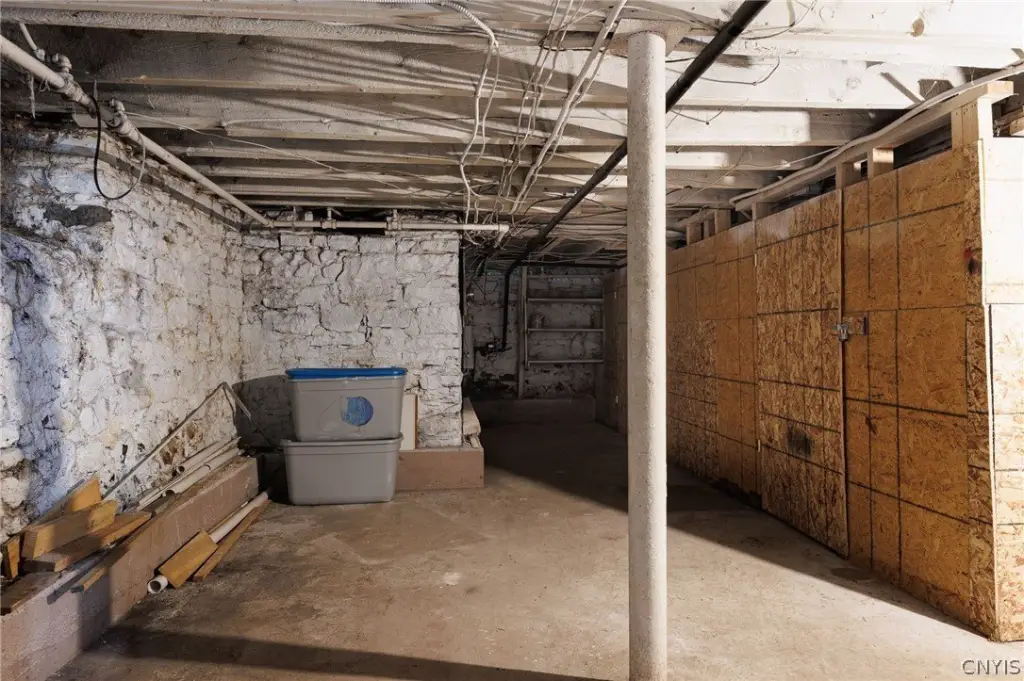
The property occupies 0.4 acres at 416 S James Street in Carthage, NY. Exterior improvements include a blacktop driveway, carriage house-style garage, enclosed porch features, and a spacious yard. The basement provides shared laundry, dedicated storage for each apartment, hot water boiler furnaces, and separate electric hot water tanks. Natural gas and electric service are separately metered by unit, while water is owner-paid. Fort Drum’s Route 26 Gate is less than 20 minutes away.
The property occupies 0.4 acres at 416 S James Street in Carthage, NY. Exterior improvements include a blacktop driveway, carriage house-style garage, enclosed porch features, and a spacious yard. The basement provides shared laundry, dedicated storage for each apartment, hot water boiler furnaces, and separate electric hot water tanks. Natural gas and electric service are separately metered by unit, while water is owner-paid. Fort Drum’s Route 26 Gate is less than 20 minutes away.
Key Highlights
- Two apartments, each with 3 bedrooms, 1.5 bathrooms, and a two‑story layout
- 2,402 square feet on a 0.4‑acre lot
- Separate natural gas and electric utilities for each unit
Financial Insights
Estimated NOI and Cap Rate
NOI / Yr
$19,777
Cap Rate
9.20%
Suggested Prices Based on Cap Rates
Cap Rate 5%
$395,540
$395.5K
Cap Rate 7%
$282,529
$282.5K
Cap Rate 9%
$219,744
$219.7K
Market Conditions
NOI Build-Up for 2,402 SF
Gross rent
$30.3K $12.60/SF
− Vacancy
−$2.0K −$0.84/SF
EGI
$28.3K $11.76/SF
− OpEx
−$8.5K −$3.53/SF
NOI
$19.8K $8.23/SF
Area
Jefferson County, NY
Vacancy
6.65%
Lease Rate
$12.60 /SF/Yr
Expense Ratio
30.00%
Simulate Cap Rate and NOI
Suggested Prices Based on Cap Rates
Cap Rate 5%
$395,540
Cap Rate 7%
$282,529
Cap Rate 9%
$219,744
Alternative Uses
Best Use
Multifamily LT 5
$282.5K
$247.2K – $329.6K
NOI $19,777 @ 7.0% cap · market cap 9.20%
Second Best
Apartment 5plus
$252.7K
$221.2K – $294.9K
NOI $17,692 @ 7.0% cap · market cap 8.23%
Theoretical Best
Office A
$662.1K
$579.4K – $772.5K
NOI $46,349 @ 7.0% cap · market cap 21.57%
Zoning and permitted uses should be independently verified with authorities.
How Realmo checks its estimates
Property Analytics
Who owns this building?
See the owner, sales and loan history
Open Analytics
Lease Details
2
Residential units
Yes
Paved road access
Yes
Utilities to site
Location Intelligence
Trade Area within ½ mile
234
Businesses Nearby
Explore this area
Business Placement
Demographics for 13619, NY
10,600
Population
4,649
Households
2.3
Avg Household Size
38
Median Age
19%
College-Educated
87%
High-School Grad
112.7 sq mi
ZIP Area
94
Density / Sq Mi
$63,549
Median Household Income
$44,792
Median Earnings
$984
Median Rent
$171,700
Median Home Value
Check the figures for this property
Cap Rate, Value Estimation, Potential NOI and more
View Realmo Analytics
Market
Vacancy Rate% for Multifamily in Northeast region


Frequently Asked Questions
What type of property is this?
Duplex - Well-maintained income property with separate utilities, shared laundry, storage, and a carriage house-style garage.
Where is this duplex located?
The property is located at 416 S James Street Carthage, NY.
What is the asking price?
The asking price for this property is $214,900.
What are key features of this property?
This property features: Two apartments, each with 3 bedrooms, 1.5 bathrooms, and a two‑story layout; 2,402 square feet on a 0.4‑acre lot; Separate natural gas and electric utilities for each unit