Historic Two-Story Restaurant
For Sale
Contact for pricing
414 W Main St, Waxahachie, TX 75165
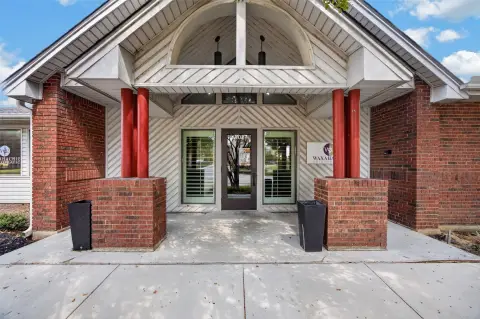
Two-story historic building operating as a cafe, offering flexible interior space, outdoor areas, and on-site parking with EV charging.
Property Size5,177 SF
Price / SF$231.79
Days on Market180
Property Features for 414 W Main St
General Information
Standard status
Active
Size
5,177 SF
Total Parking Spaces
28
Property subtype
Retail, Office
Zoning
General Retail
Investment Type
Owner/User
Additional Details
Business Included
Yes
Building Details
Year Built
1887
Year Renovated
2018
Buildings
1
Stories
2
Listing Agency:
Tero
Listed By:
Dustin Jordan · License #0661824
(972) 777-4141
Source:
Crexi
Added: Apr 25
Changed: Oct 6
Last Checked: Oct 20 at 6:42PM
Displayed information is deemed reliable but is not guaranteed and should be independently verified. All listing content including descriptions, pricing, images are the copyrighted material of Tero

Ask AI about this property
Review the available facts, identify missing information and prepare questions for the agent.
Investment Insights
Based on property information with market context.
Built c. 1887, this charming historic two-story building at 414 W Main St in Waxahachie, TX, currently operates as the White Rhino Cafe. The property has approximately 5,165 sq. ft. of flexible interior space with high ceilings and abundant natural light, plus multiple rooms and nooks that can support seating or workspace needs. Outdoor areas add additional utility, and the open layout includes existing plumbing and electrical infrastructure from the current restaurant operations, supporting tenant flexibility.
The building sits on a prominent corner along West Main Street in Waxahachie’s historic district, providing strong visibility and foot traffic. On-site parking is available, including EV charging, and the property is positioned close to downtown amenities.
With its historic character and adaptable interior configuration, the building offers conversion potential for professional office uses while preserving the original architectural appeal.
The building sits on a prominent corner along West Main Street in Waxahachie’s historic district, providing strong visibility and foot traffic. On-site parking is available, including EV charging, and the property is positioned close to downtown amenities.
With its historic character and adaptable interior configuration, the building offers conversion potential for professional office uses while preserving the original architectural appeal.
Key Highlights
- Historic two‑story commercial building at 414 W. Main St., Waxahachie, built in 1887
- Approximately 5,165 sq. ft. of flexible interior space with high ceilings and abundant natural light
- Currently operating as the White Rhino Cafe with existing plumbing and electrical infrastructure
Financial Insights
Estimated NOI and Cap Rate
NOI / Yr
$92,552
Cap Rate
7.71%
Suggested Prices Based on Cap Rates
Cap Rate 5%
$1,851,040
$1.9M
Cap Rate 7%
$1,322,171
$1.3M
Cap Rate 9%
$1,028,356
$1.0M
Market Conditions
NOI Build-Up for 5,177 SF
Gross rent
$129.2K $24.96/SF
− Vacancy
−$5.8K −$1.12/SF
EGI
$123.4K $23.84/SF
− OpEx
−$30.9K −$5.96/SF
NOI
$92.6K $17.88/SF
Area
Ellis County, TX
Vacancy
4.50%
Lease Rate
$24.96 /SF/Yr
Expense Ratio
25.00%
Simulate Cap Rate and NOI
Suggested Prices Based on Cap Rates
Cap Rate 5%
$1,851,040
Cap Rate 7%
$1,322,171
Cap Rate 9%
$1,028,356
Alternative Uses
Best Use
Specialty Retail
$1.32M
$1.16M – $1.54M
NOI $92,552 @ 7.0% cap · market cap 7.71%
Second Best
Office B
$1.24M
$1.08M – $1.44M
NOI $86,596 @ 7.0% cap · market cap 7.22%
Theoretical Best
Multifamily LT 5
$56.49M
$49.43M – $65.90M
NOI $3,954,272 @ 7.0% cap · market cap 329.52%
Zoning and permitted uses should be independently verified with authorities.
How Realmo checks its estimates
Property Analytics
Unlock full access to Insights
Subscribe to Realmo Intelligence
Open Analytics
Current Use
Lease Details
Turnkey business
Opportunity
Location Intelligence
Trade Area within ½ mile
1,176
Businesses Nearby
Well-served
Demand for This Use
Explore this area
Business Placement
Demographics for 75165, TX
49,805
Population
18,940
Households
2.6
Avg Household Size
36
Median Age
28%
College-Educated
90%
High-School Grad
118.0 sq mi
ZIP Area
422
Density / Sq Mi
$84,780
Median Household Income
$45,677
Median Earnings
$1,473
Median Rent
$308,100
Median Home Value
Check the figures for this property
Cap Rate, Value Estimation, Potential NOI and more
View Realmo Analytics
Market
Vacancy Rate% for Office in South region


Similar Off Market Nearby
- Mount Lebanon Deacon Robert Reed Fellowship Hall — Waxahachie, TX 75165
- Fresh Market Coffee — 501 S Rogers St, Waxahachie, TX 75165
- Hachie Nutrition Waxahachie — 315 W Main St Suite 15, Waxahachie, TX 75165
- Prickly Boba Waxahachie — 108 E Franklin St, Waxahachie, TX 75165
- Vita Coffee House — 210 N Monroe St Suite 103, Waxahachie, TX 75165
Frequently Asked Questions
What type of property is this?
Coffee shop - Two-story historic building operating as a cafe, offering flexible interior space, outdoor areas, and on-site parking with EV charging.
Where is this coffee shop located?
The property is located at 414 W Main St Waxahachie, TX.
What is the asking price?
The asking price for this property is $1,200,000.
What are key features of this property?
This property features: Historic two‑story commercial building at 414 W. Main St., Waxahachie, built in 1887; Approximately 5,165 sq. ft. of flexible interior space with high ceilings and abundant natural light; Currently operating as the White Rhino Cafe with existing plumbing and electrical infrastructure


