Remodeled Fourplex with Covered
For Sale
$1,199,000
412 E VAN NESS Pl S, Salt Lake City, UT 84111
Residential, Salt Lake City, UT
Property Size3,426 SF
Lot Size0.08 Acres
Price / SF$349.97
Days on Market70
Property Features for 412 E VAN NESS Pl S
General Information
Property type
Residential Multi Family
Property subtype
Quadruplex
Zoning
Multi-Family
Bedrooms
8
Bathrooms
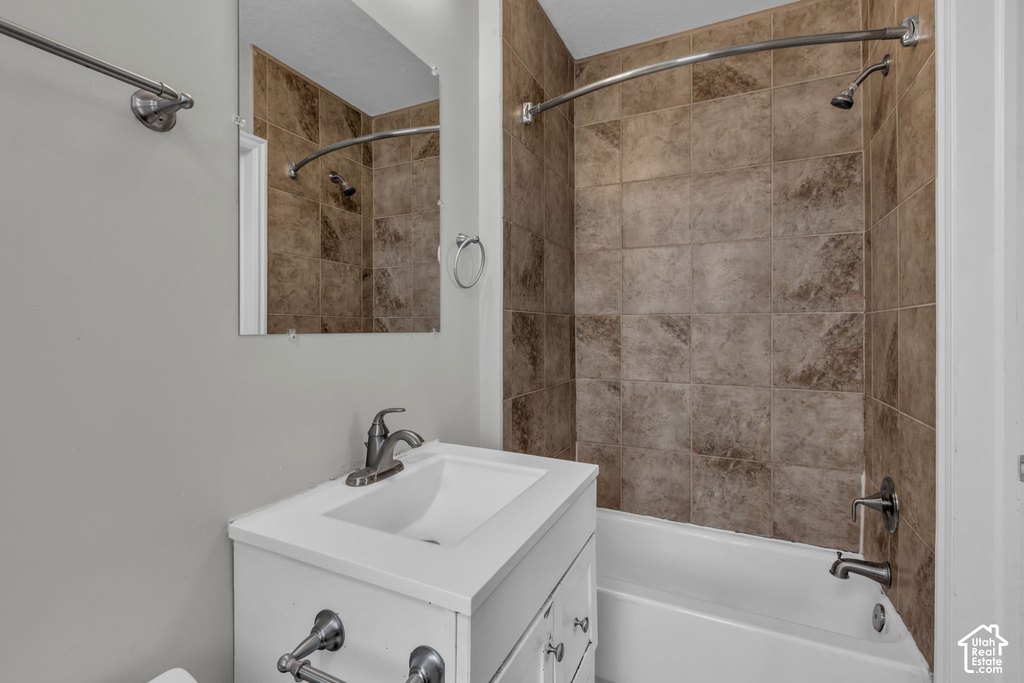
4
Full bathrooms
4
Rooms
Bedroom 7, Bedroom 4, Bedroom 5, Bedroom 1, Bathroom 3, Bathroom 2, Bedroom 8, Bedroom 6, Bedroom 2, Bathroom 1, Bedroom 3, Bathroom 4
Parking
4
Parking features
Covered
Window features
Blinds
Patio and Porch features
Porch
Interior features
Oven: Gas
Exterior features
Porch: Open, Skylights
Lot features
Fenced: Full, Road: Paved
Elementary school
Lincoln
Middle school
Bryant
High school
Highland
Elementary school district
Salt Lake
Middle school district
Salt Lake
High school district
Salt Lake
Subdivision
Salt Lake City; So. Salt Lake
Standard status
Active
APN
16-07-255-006
Size
3,426 SF
Lot size
0.08 Acres
Taxes and HOA fees
Tax Annual Amount
4300
Utilities
Sewer type
Public Sewer
Heating system
Electric (Heating)
Building Details
Year built
1906
Number of units
4
Flooring type
Laminate, Tile
Building materials
Brick
Roof type
Rubber
Architectural style
Other
Listing Agency:
Jordan Real Estate LLC
(877) 990-0550
Listed By:
Taylor Kayli Vernon
(866) 512-9020
Added: Aug 5
Changed: Oct 11
Last Checked: Oct 13 at 6:06AM
MLS# 2180674
Copyright © 2026 UtahRealEstate.com. All rights reserved. All information provided by the listing agent/broker is deemed reliable but is not guaranteed and should be independently verified.
Investment Insights
Based on property information with market context.
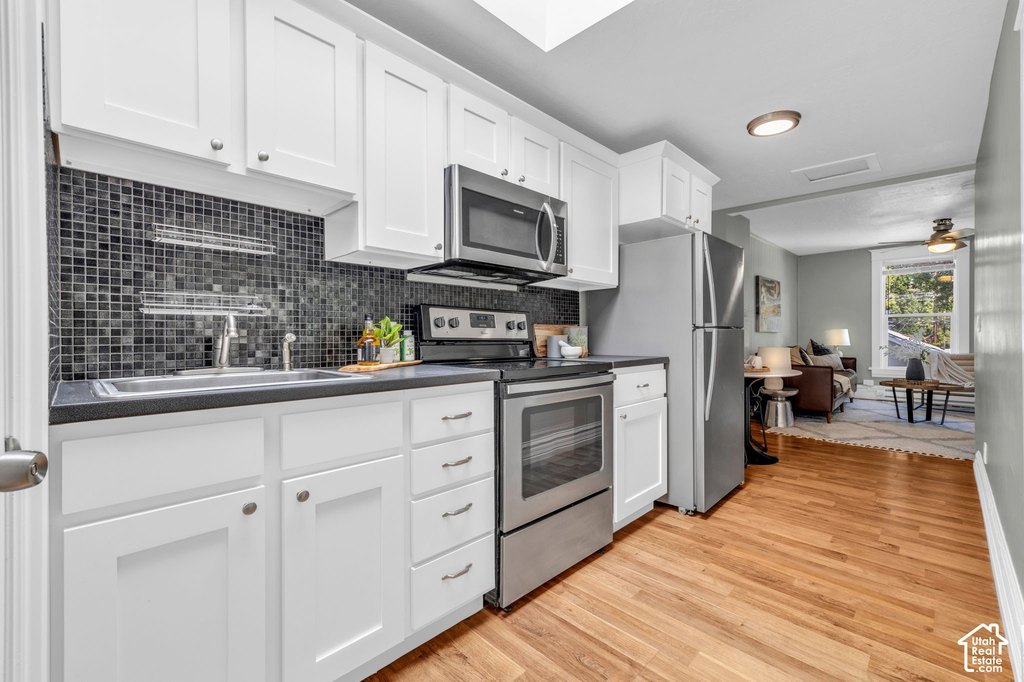
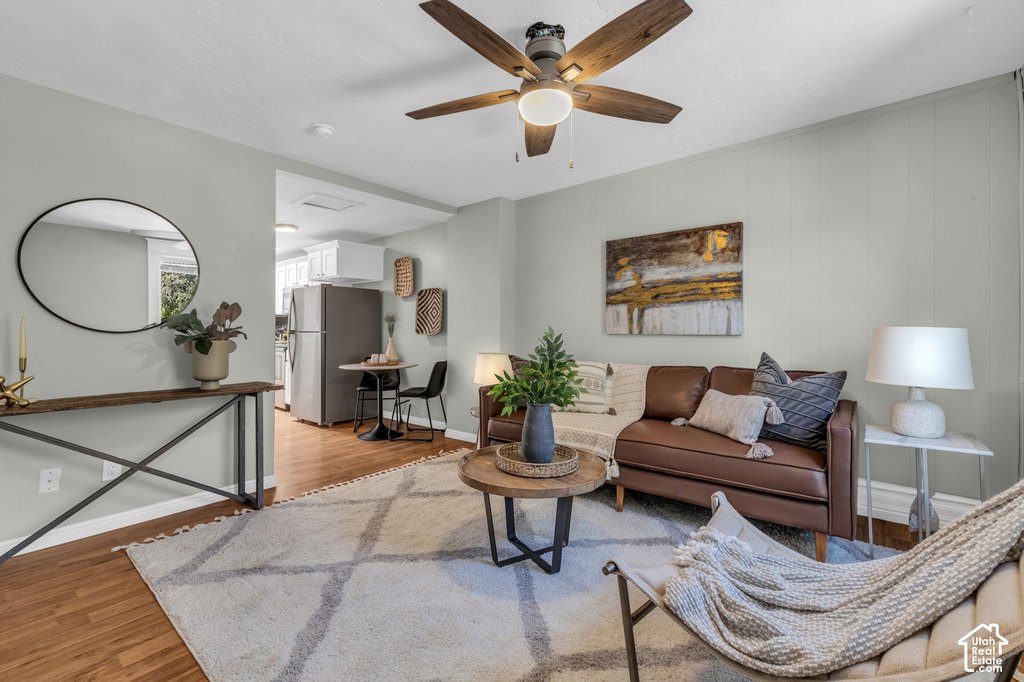
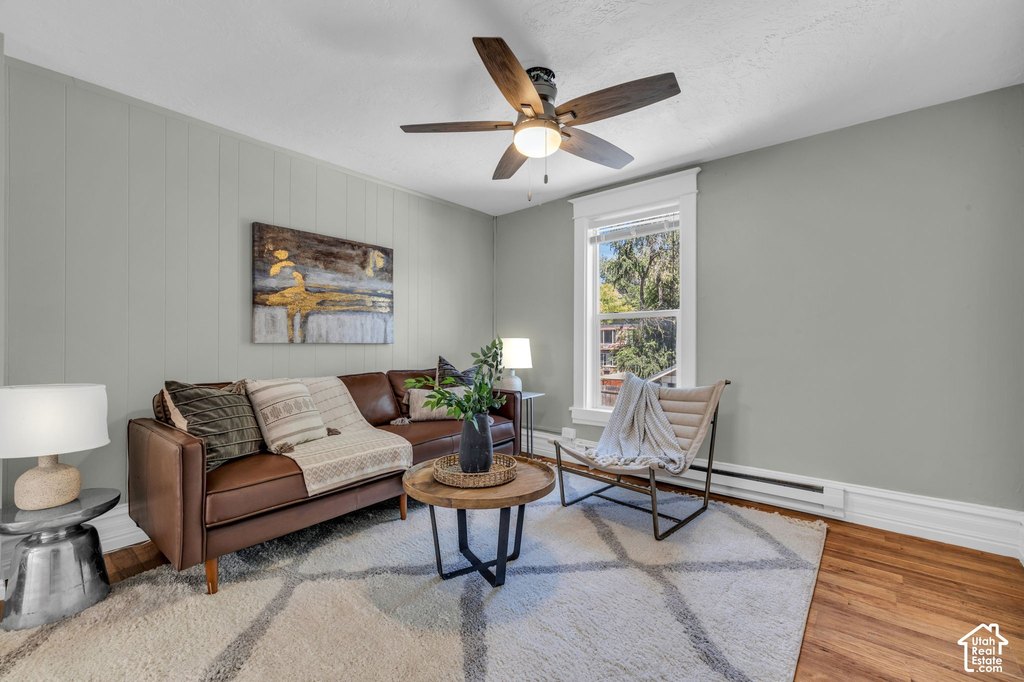
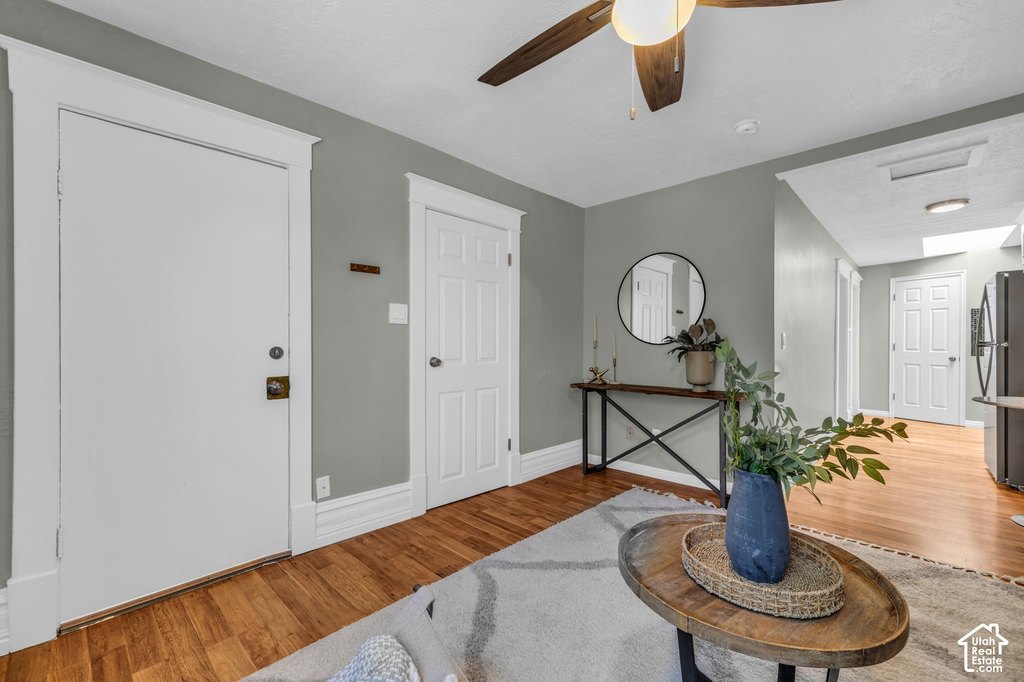
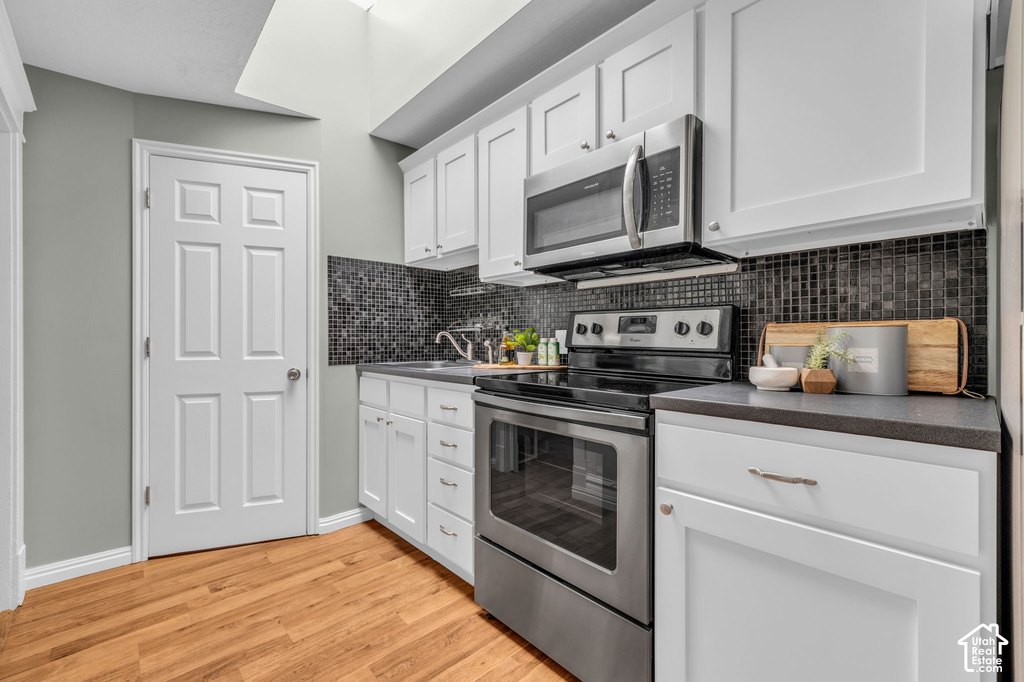
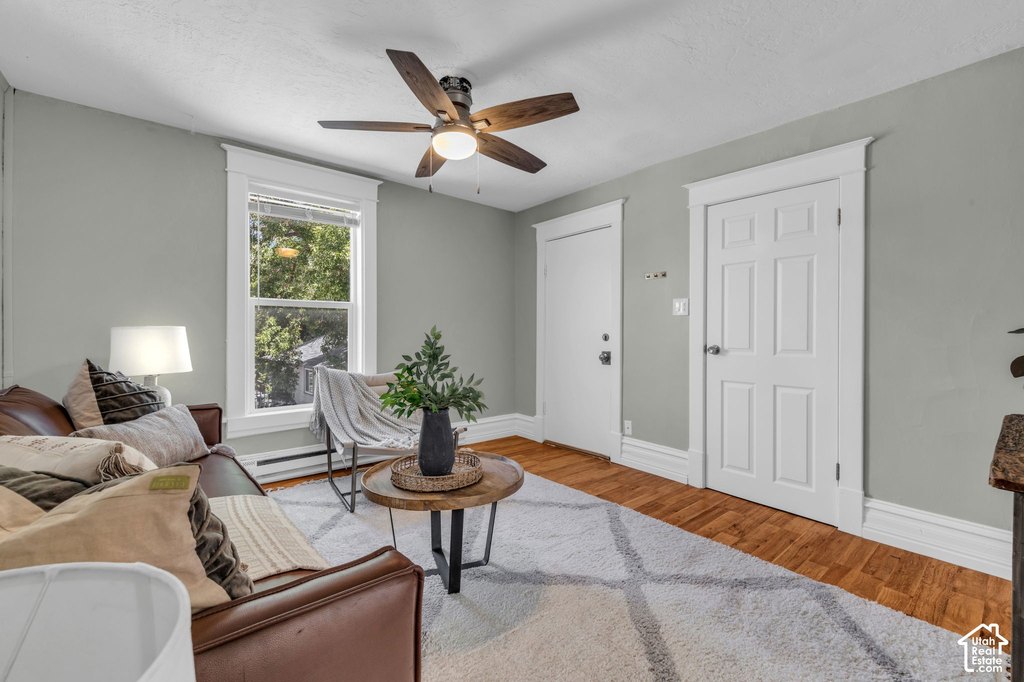
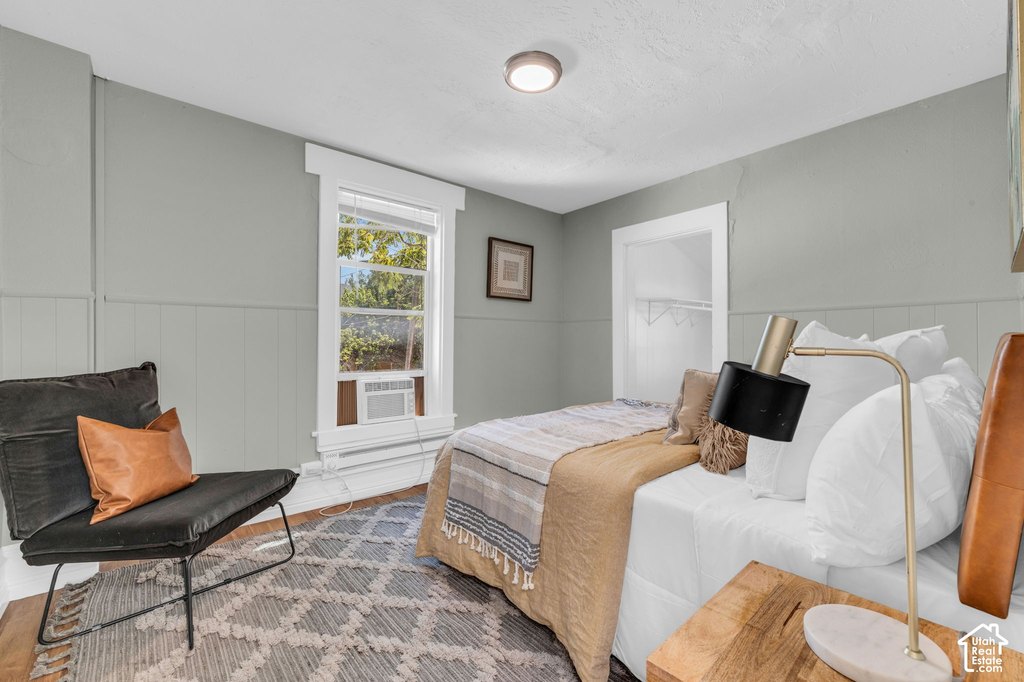
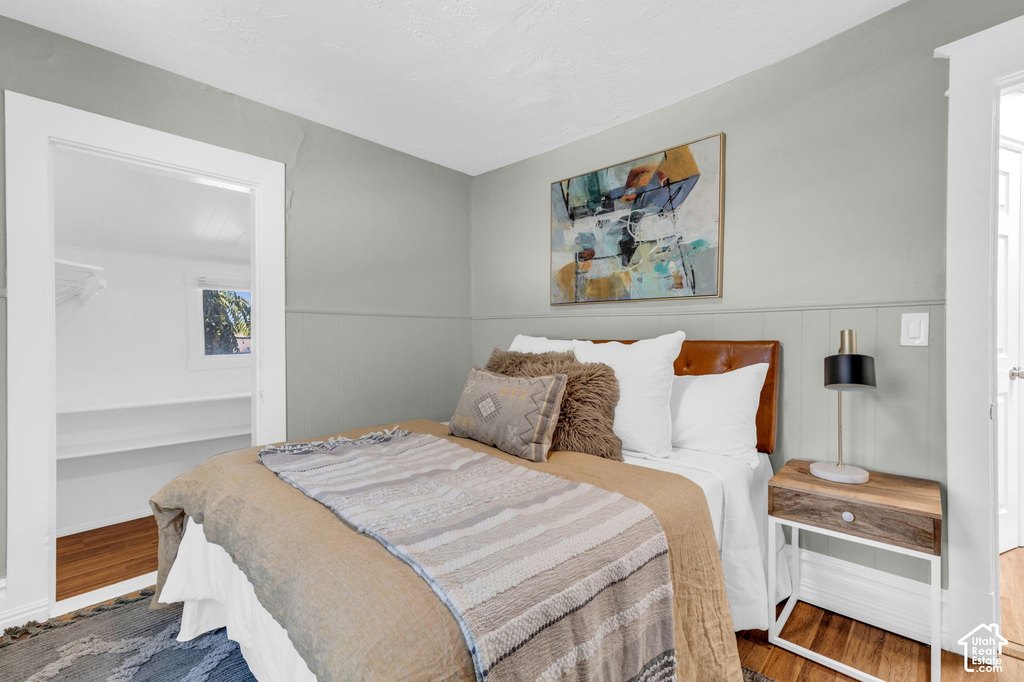
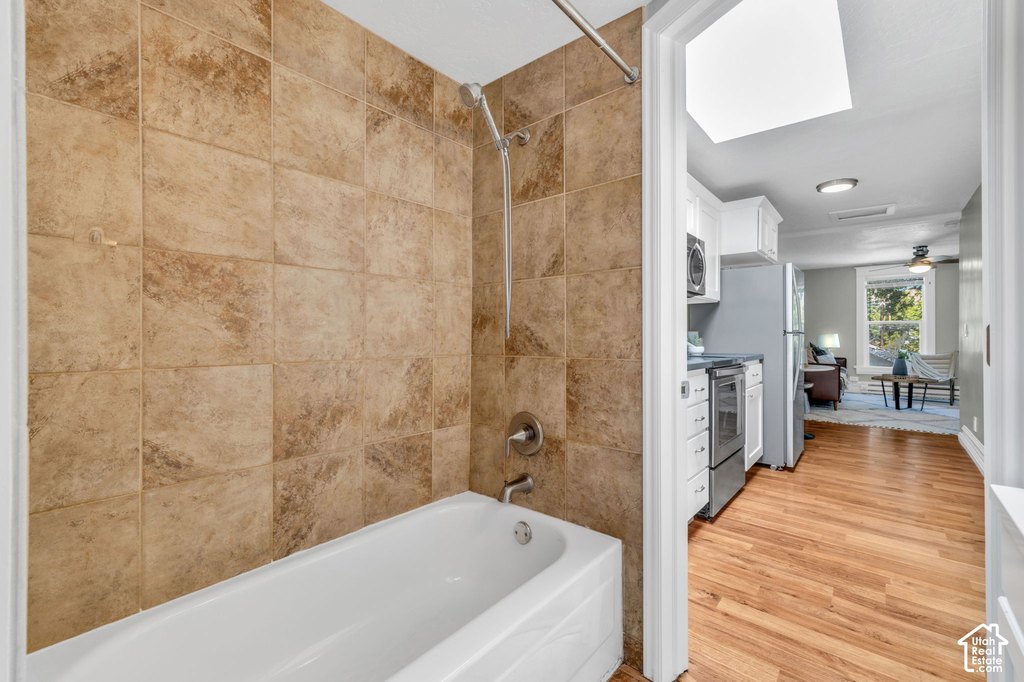
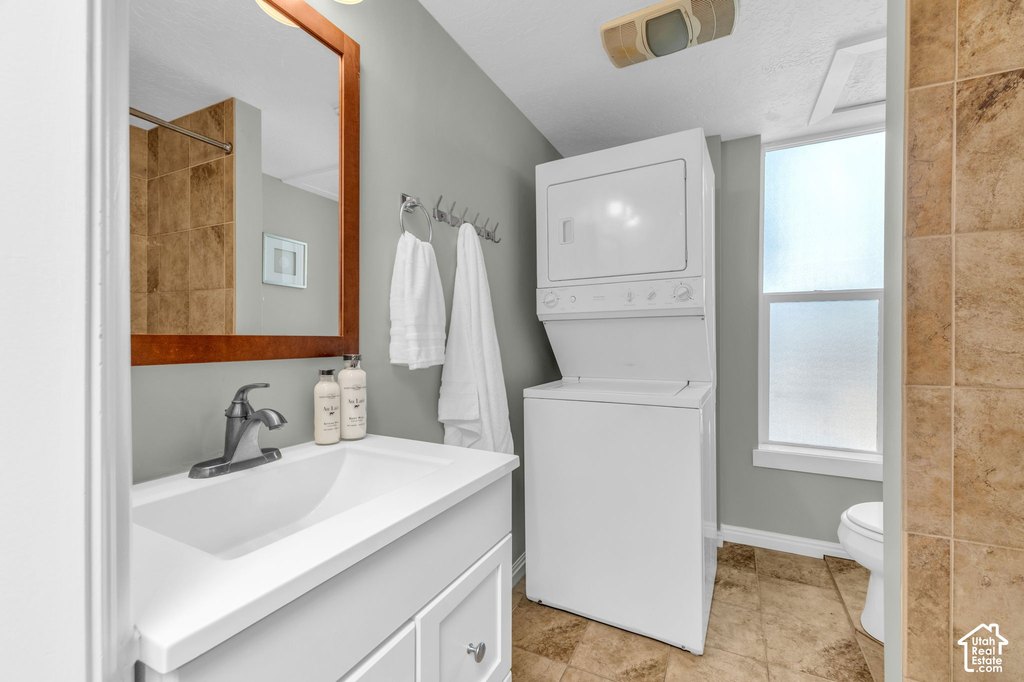
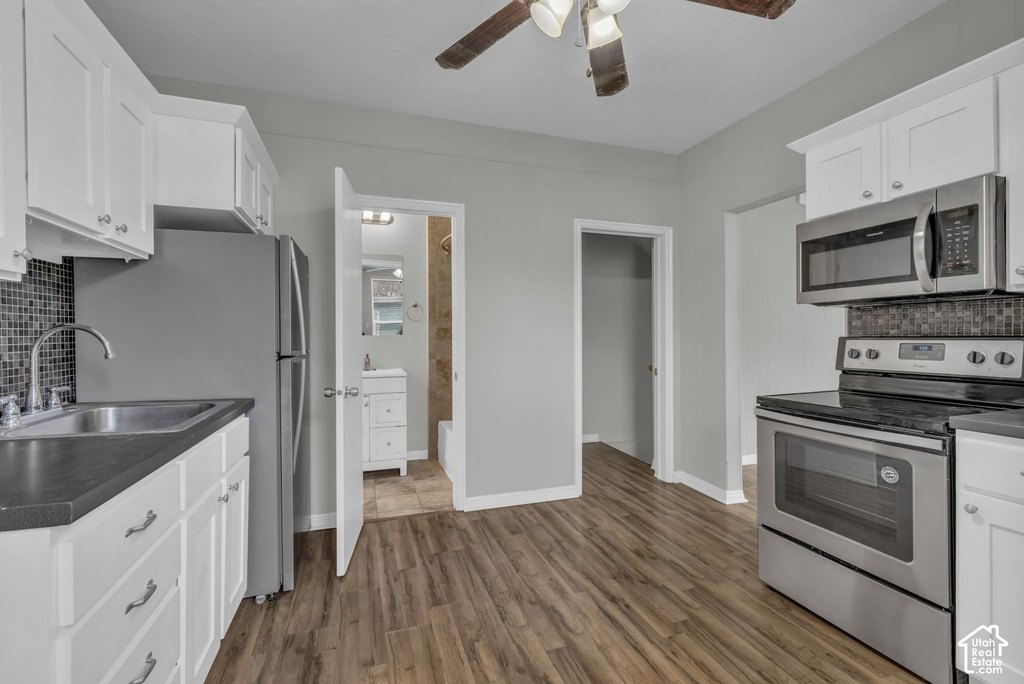
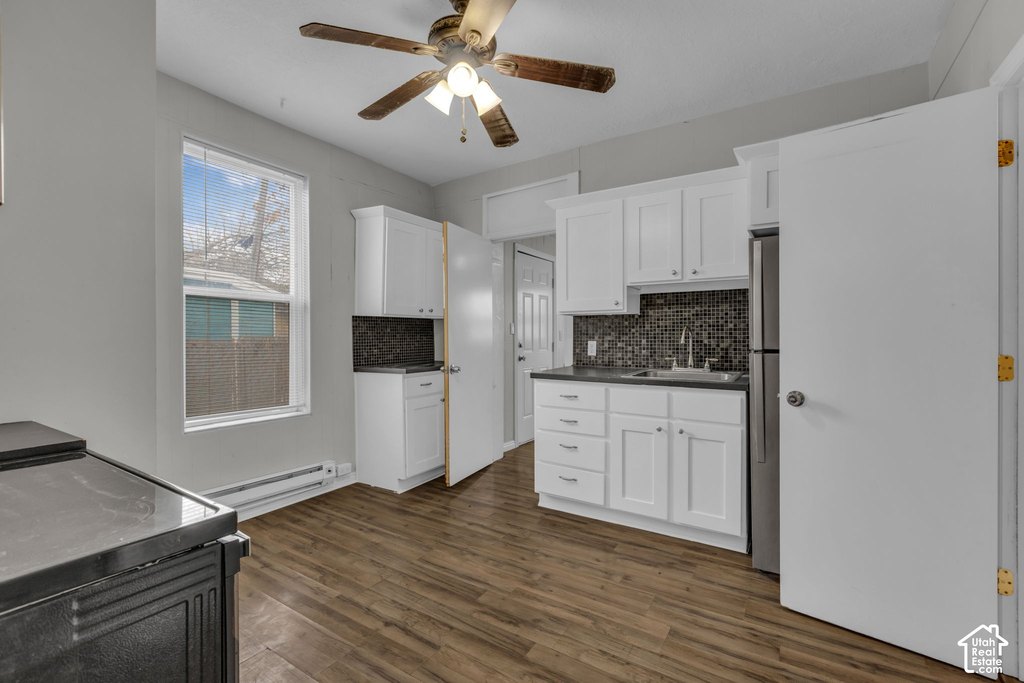
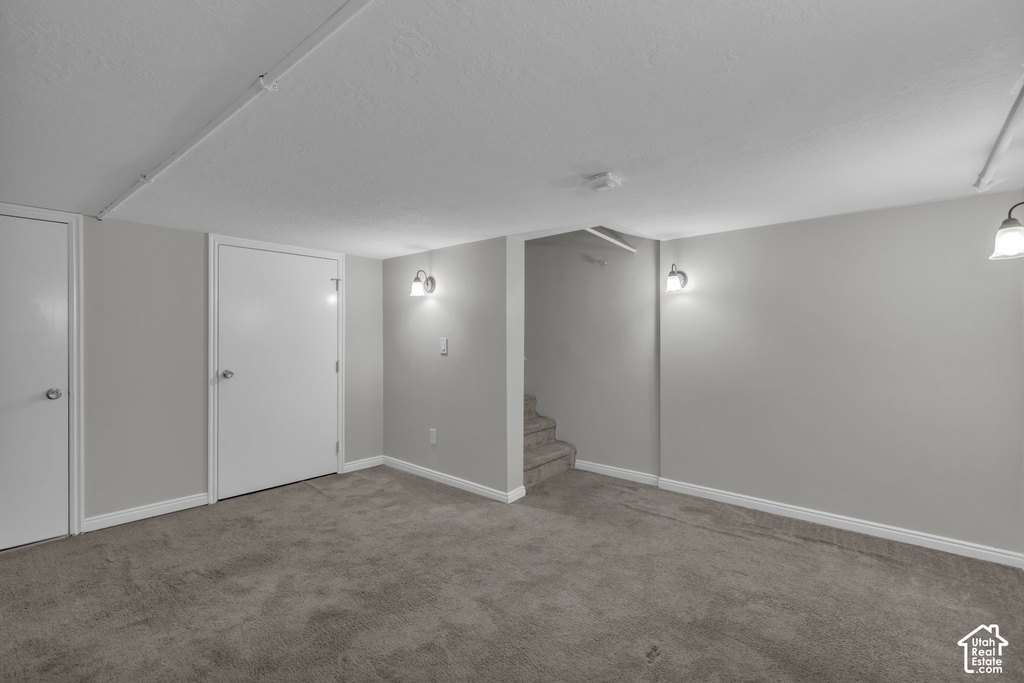
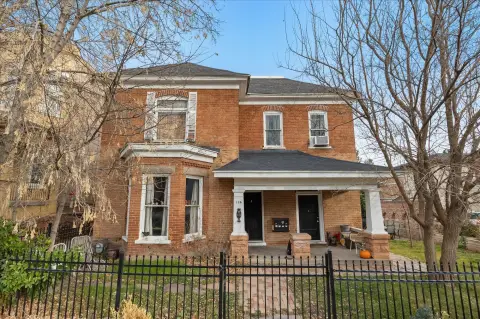
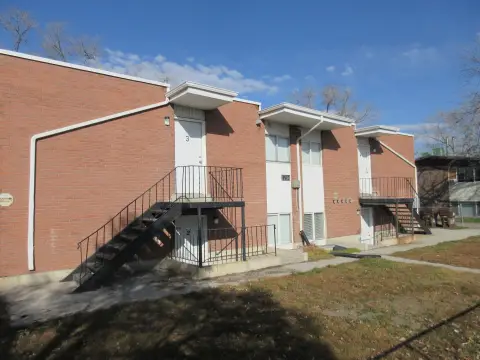
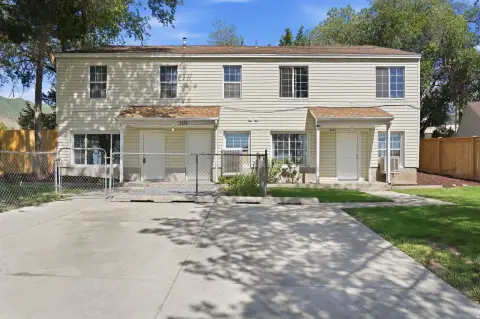
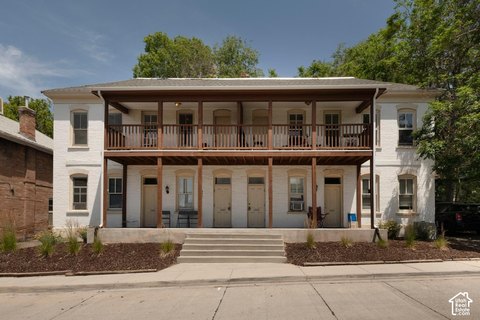
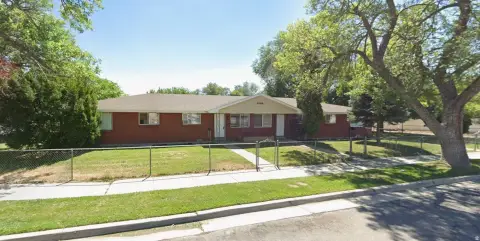
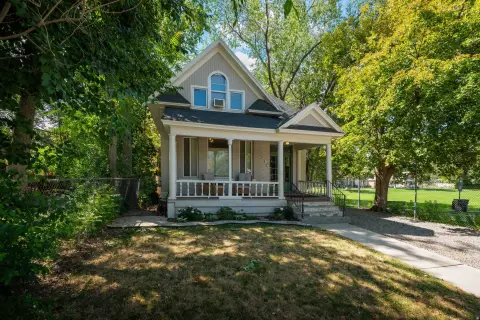
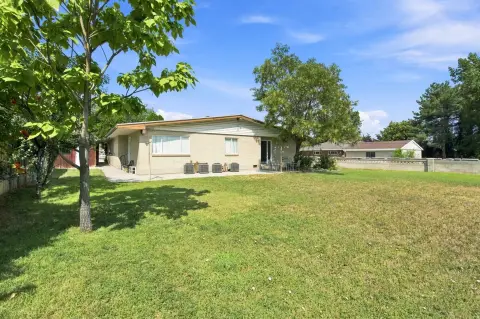
This four-unit multifamily property in Salt Lake City contains 3,426 square feet on a 0.08-acre lot and is zoned Multi-Family. The brick building dates to 1906 and includes four units that underwent comprehensive remodeling in 2012, with electrical and roof improvements completed as part of that work. Each unit received additional updates between 2022 and 2025.
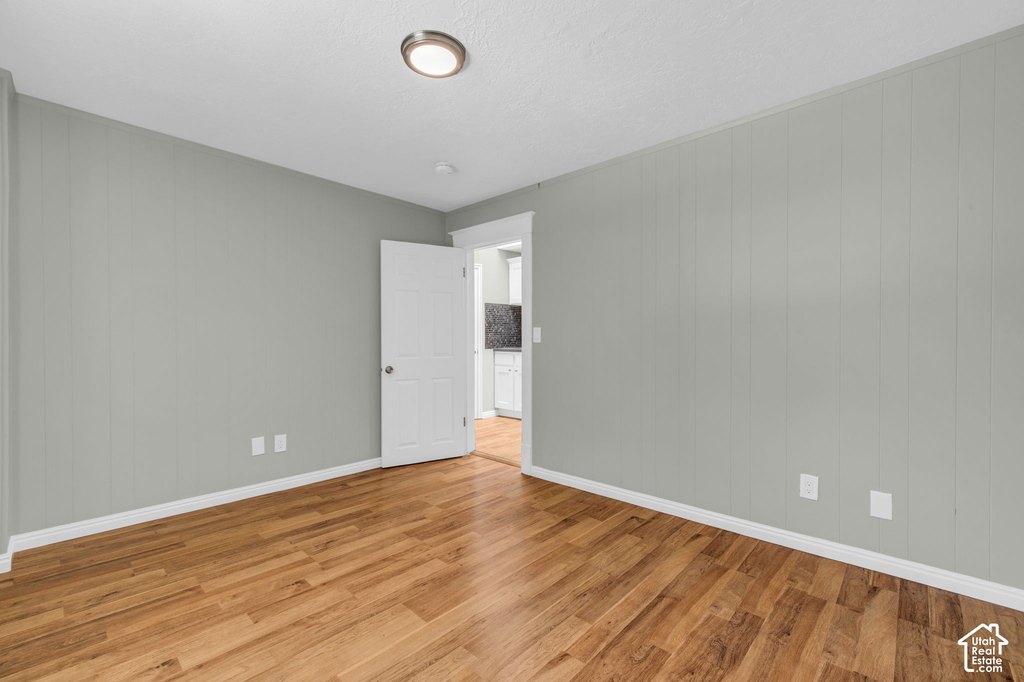
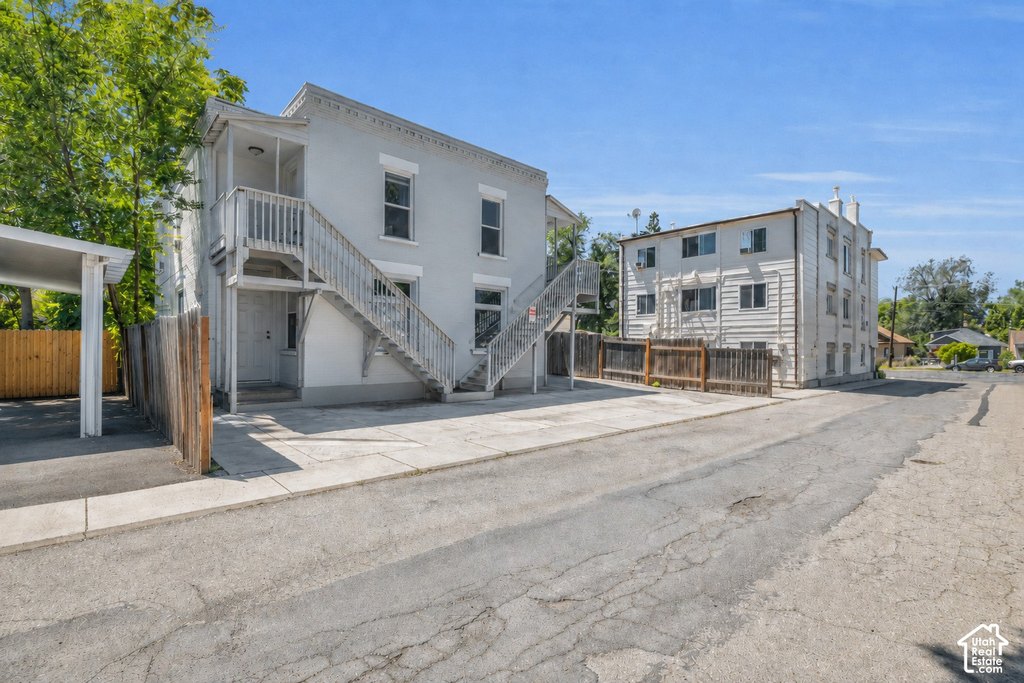
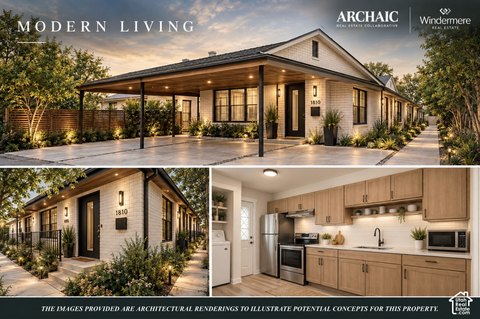
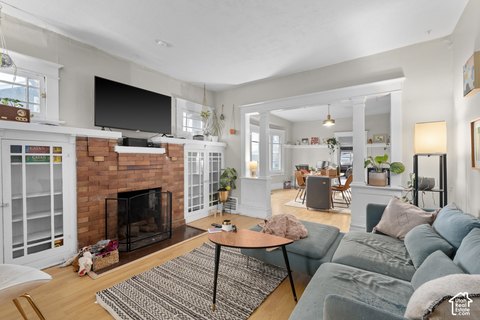
The property is near Liberty Park and the University of Utah. Exterior features include an open porch, skylights, and covered parking. Interior finishes include laminate and tile flooring, while heating is electric. The property is served by public sewer, and tenants are responsible for all utilities.
The property is near Liberty Park and the University of Utah. Exterior features include an open porch, skylights, and covered parking. Interior finishes include laminate and tile flooring, while heating is electric. The property is served by public sewer, and tenants are responsible for all utilities.
Key Highlights
- Four‑unit multifamily property with 3,426 square feet on 0.08 acres
- Zoned Multi‑Family in Salt Lake City
- All four units remodeled in 2012 with electrical and roof upgrades
Financial Insights
Estimated NOI and Cap Rate
NOI / Yr
$45,689
Cap Rate
3.81%
Suggested Prices Based on Cap Rates
Cap Rate 5%
$913,780
$913.8K
Cap Rate 7%
$652,700
$652.7K
Cap Rate 9%
$507,656
$507.7K
Market Conditions
NOI Build-Up for 3,426 SF
Gross rent
$69.1K $20.16/SF
− Vacancy
−$3.8K −$1.11/SF
EGI
$65.3K $19.05/SF
− OpEx
−$19.6K −$5.72/SF
NOI
$45.7K $13.34/SF
Area
Salt Lake City, UT
Vacancy
5.50%
Lease Rate
$20.16 /SF/Yr
Expense Ratio
30.00%
Simulate Cap Rate and NOI
Suggested Prices Based on Cap Rates
Cap Rate 5%
$913,780
Cap Rate 7%
$652,700
Cap Rate 9%
$507,656
Alternative Uses
Best Use
Multifamily LT 5
$652.7K
$571.1K – $761.5K
NOI $45,689 @ 7.0% cap · market cap 3.81%
Second Best
Apartment 5plus
$606.3K
$530.5K – $707.4K
NOI $42,443 @ 7.0% cap · market cap 3.54%
Theoretical Best
Office A
$923.0K
$807.6K – $1.08M
NOI $64,611 @ 7.0% cap · market cap 5.39%
Zoning and permitted uses should be independently verified with authorities.
How Realmo checks its estimates
Property Analytics
Unlock full access to Insights
Subscribe to Realmo Intelligence
Open Analytics
Current Use
Lease Details
4
Residential units
Location Intelligence
Trade Area within ½ mile
1,785
Businesses Nearby
Explore this area
Business Placement
Demographics for 84111, UT
12,162
Population
8,635
Households
1.4
Avg Household Size
34
Median Age
55%
College-Educated
95%
High-School Grad
1.4 sq mi
ZIP Area
8,687
Density / Sq Mi
$57,188
Median Household Income
$49,490
Median Earnings
$1,294
Median Rent
$423,000
Median Home Value
Check the figures for this property
Cap Rate, Value Estimation, Potential NOI and more
View Realmo Analytics
Market
Vacancy Rate% for Multifamily in West region

Questions? Ask Rey
Realmo’s AI knows this listing — price, zoning, demand, history. Ask anything.


Frequently Asked Questions
What type of property is this?
Quadplex - Multi-family property with four refreshed units, brick construction, open porch, and covered parking.
Where is this quadplex located?
The property is located at 412 E VAN NESS Pl S Salt Lake City, UT.
What is the asking price?
The asking price for this property is $1,199,000.
What are key features of this property?
This property features: Four‑unit multifamily property with 3,426 square feet on 0.08 acres; Zoned Multi‑Family in Salt Lake City; All four units remodeled in 2012 with electrical and roof upgrades


