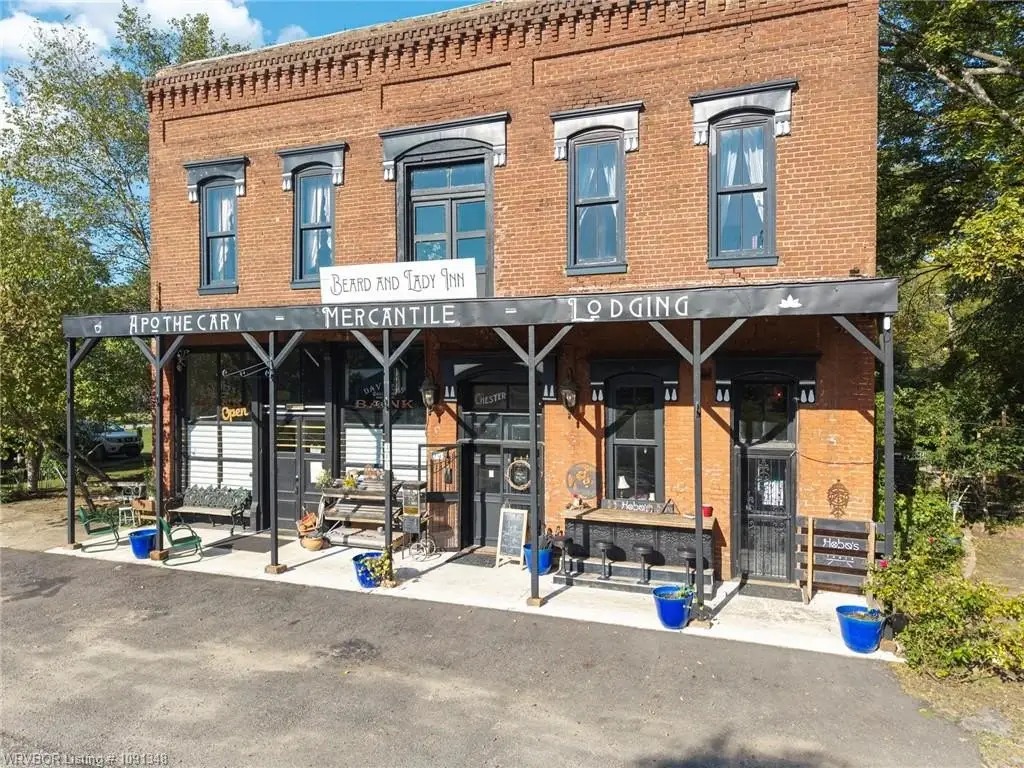
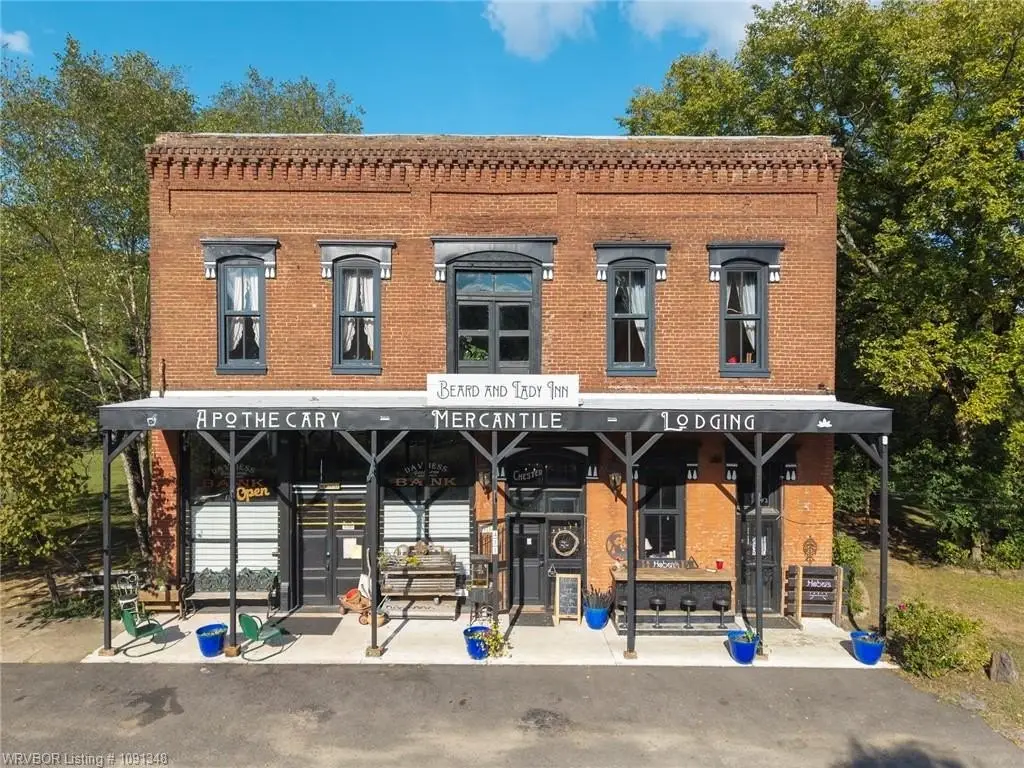
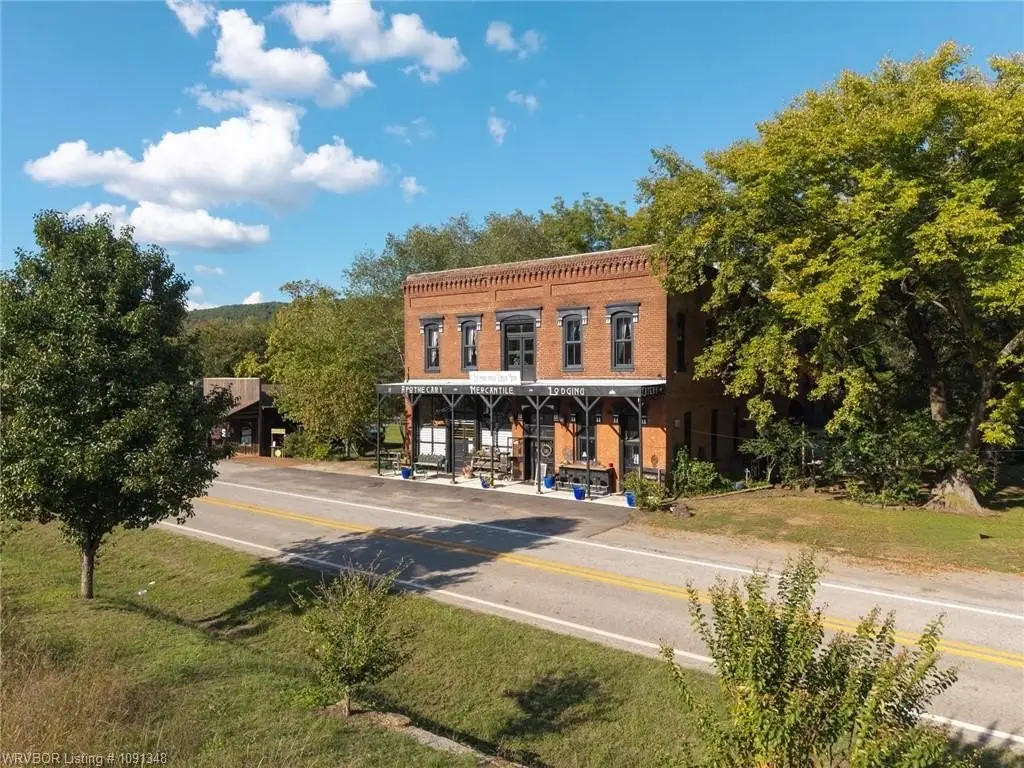
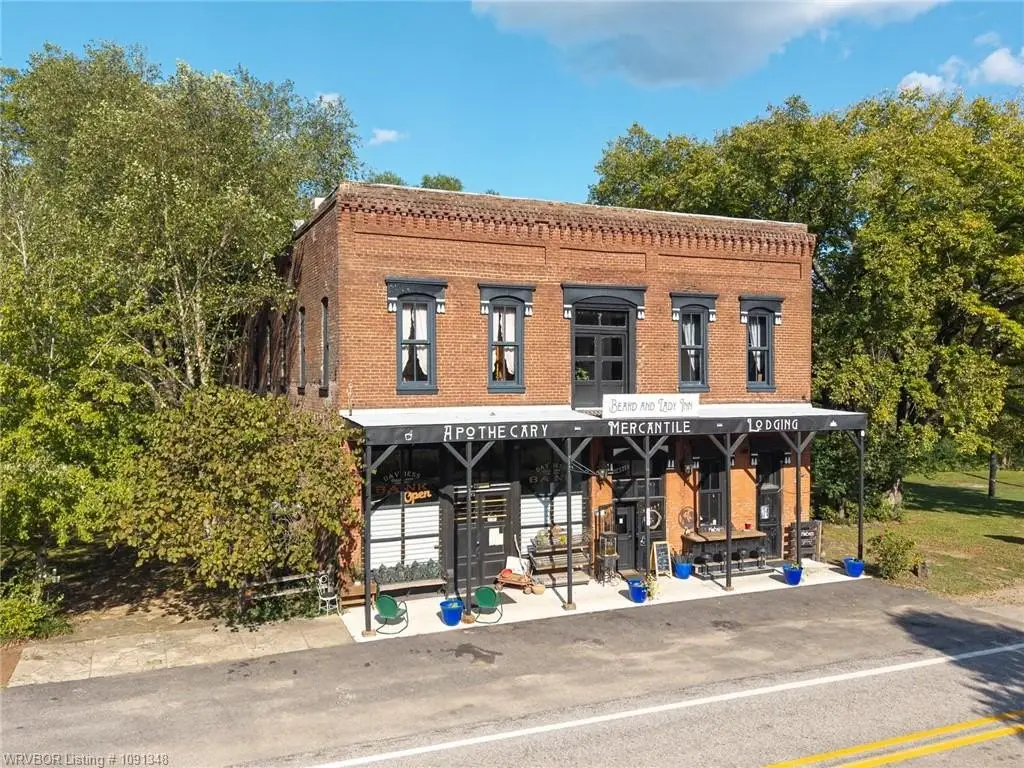
Historic Bed-and-Breakfast with Event
For Sale
$899,000
411 E Front AVE, Chester, AR 72934
Commercial, Chester, AR
Property Size9,600 SF
Lot Size0.31 Acres
Price / SF$93.65
Days on Market50
Property Features for 411 E Front AVE
General Information
Property type
Commercial Sale
Property subtype
Other
Parking features
On Street
Directions
Downtown Chester, From 1-49 0.6 mile on right
Standard status
Active
APN
720-00004-001
Size
9,600 SF
Lot size
0.31 Acres
Taxes and HOA fees
Tax Description
See Extended Legal Attachment
Tax Annual Amount
1908
Legal Description
See Extended Legal Attachment
Utilities
Heating system
Electric (Heating), Central
Cooling system
Electric, Central Air
Building Details
Year built
1887
Number of units
11
Flooring type
Wood, Tile - Ceramic
Roof type
Other
Listing Agency:
Keller Williams Platinum Realty · Keller Williams Realty
(479) 434-3000
Listed By:
Pendergraft Realty Group
(479) 459-7158
Added: Aug 28
Changed: Sep 12
Last Checked: Oct 16 at 8:06AM
MLS# 1091348
Copyright © 2026 Western River Valley Board of REALTORS®. All rights reserved. All information provided by the listing agent/broker is deemed reliable but is not guaranteed and should be independently verified.

Ask AI about this property
Review the available facts, identify missing information and prepare questions for the agent.
Investment Insights
Based on property information with market context.
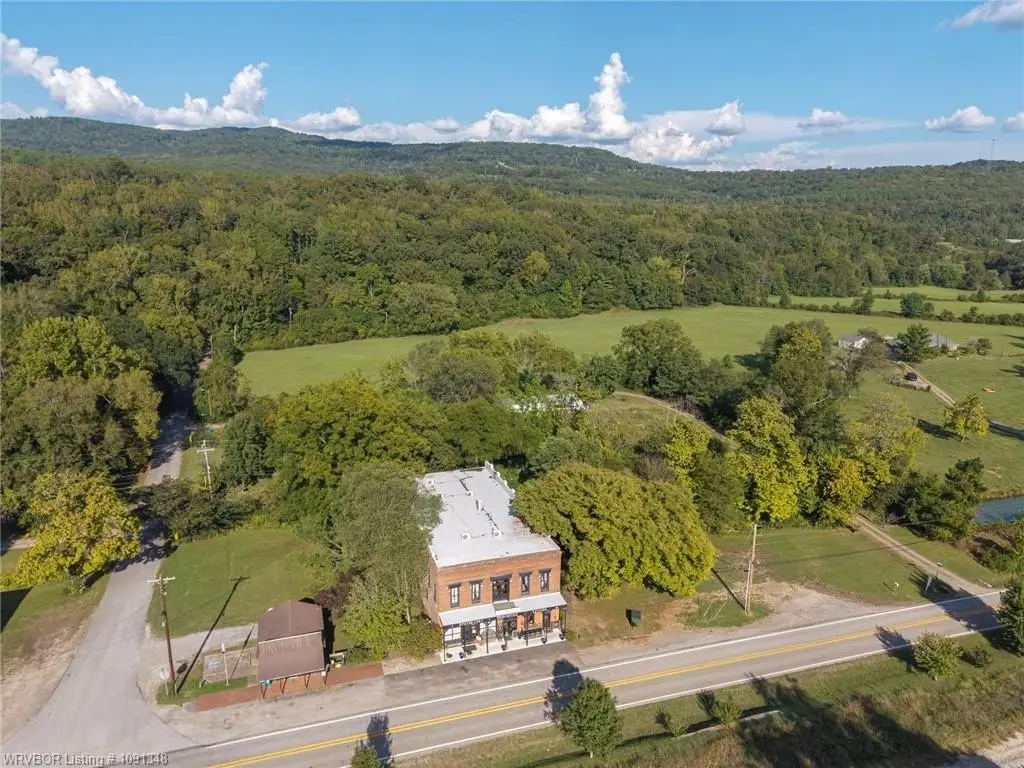
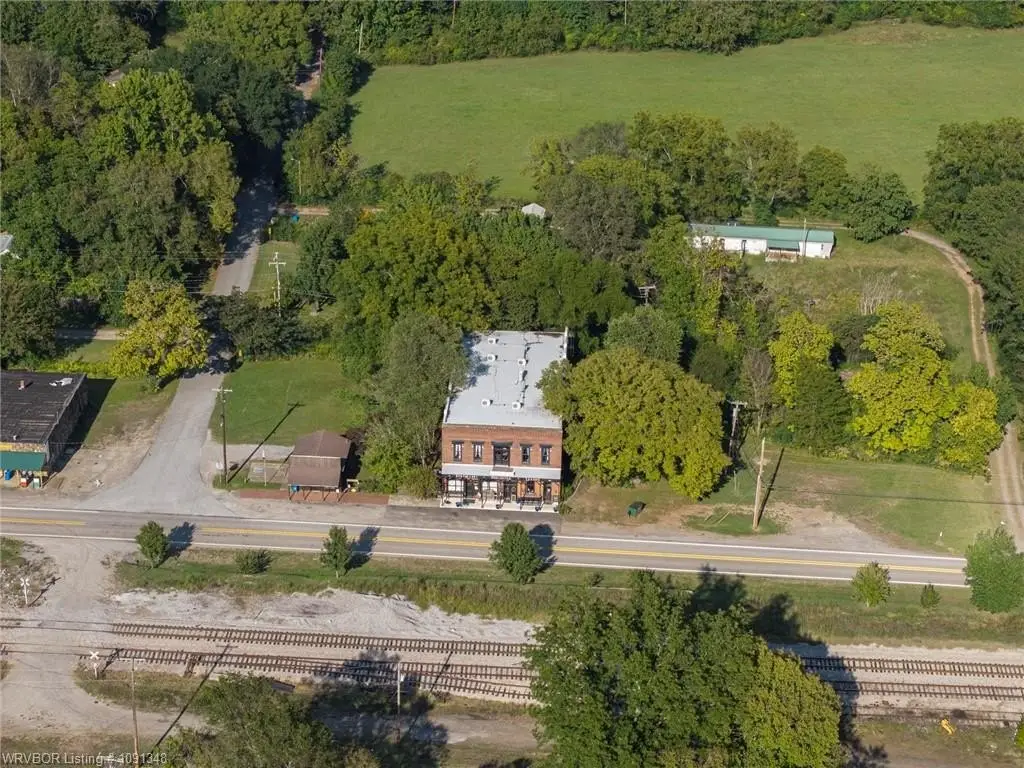
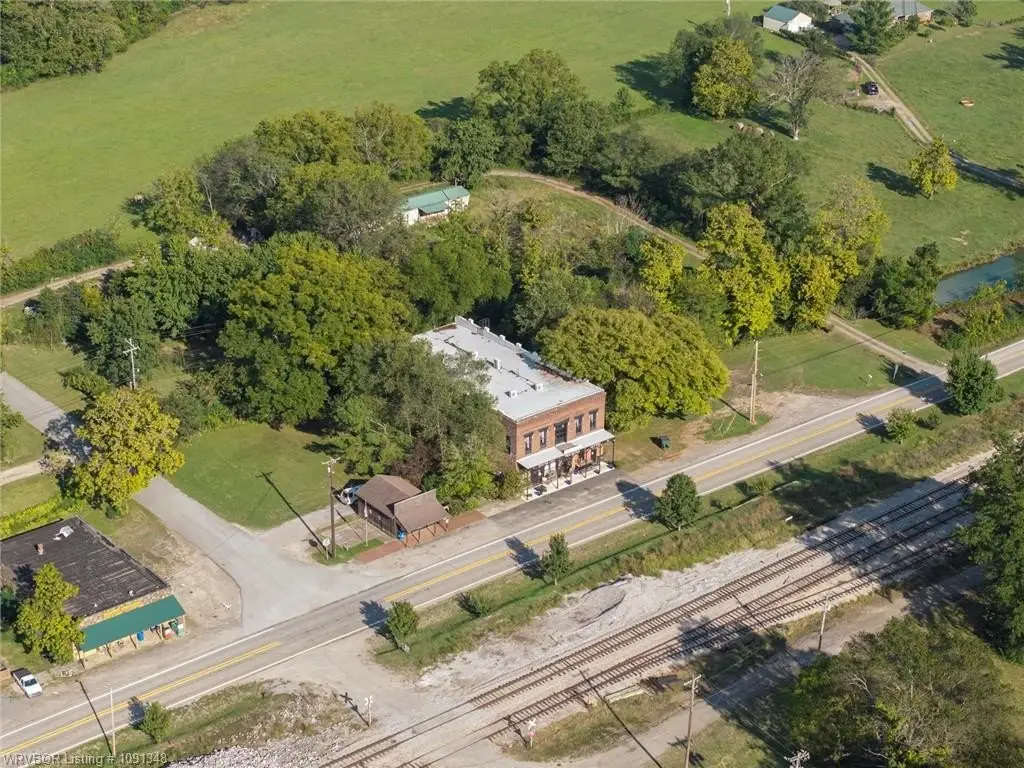
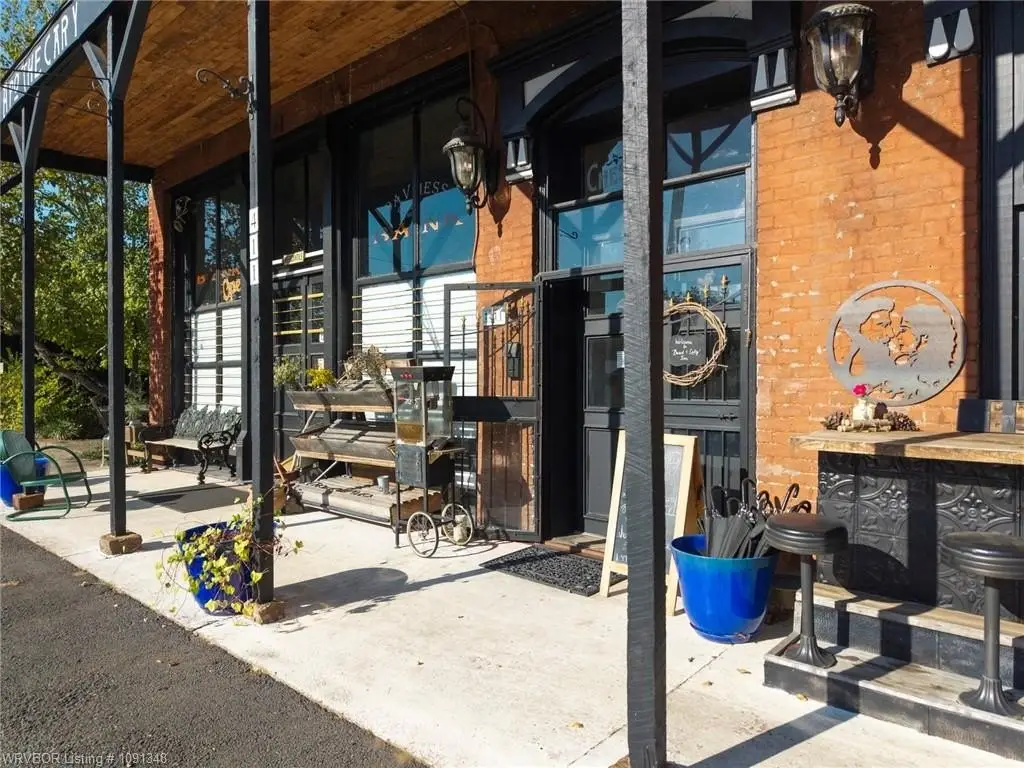
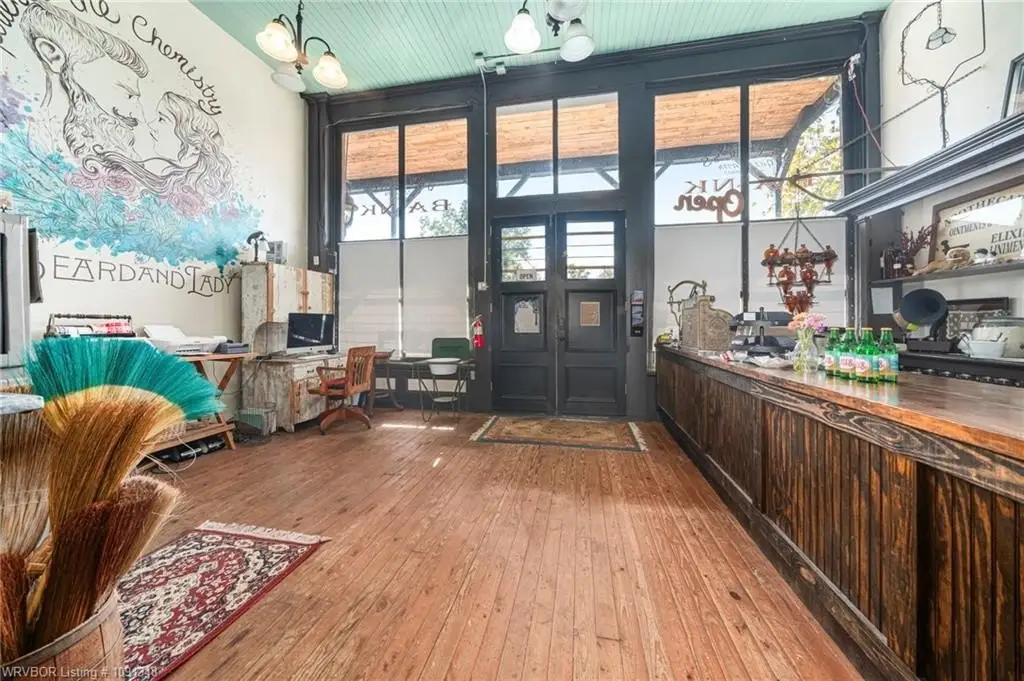
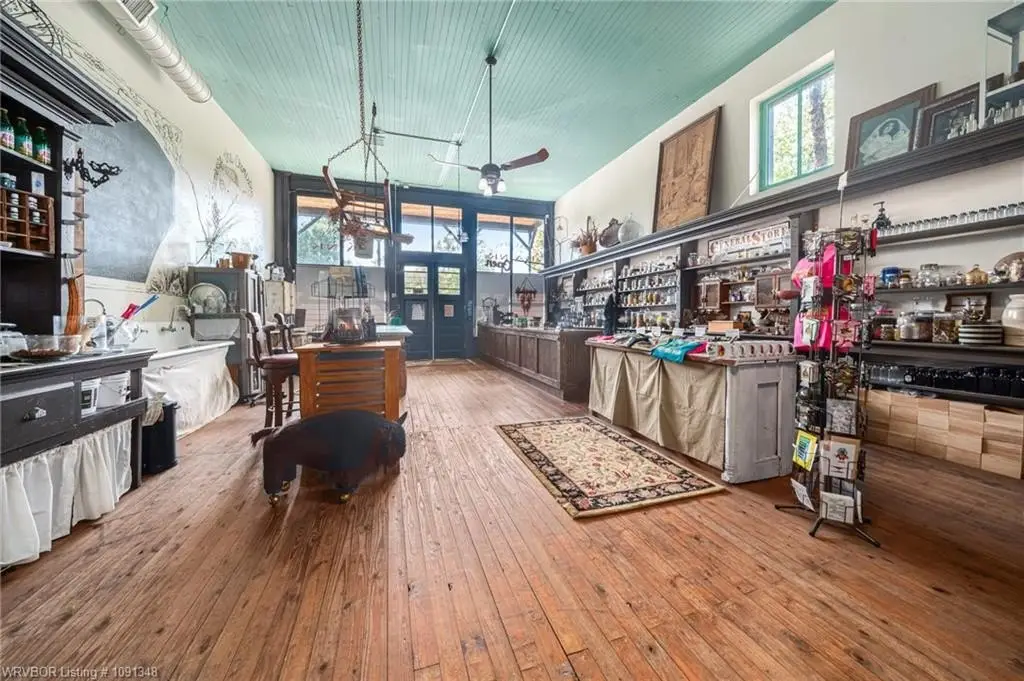
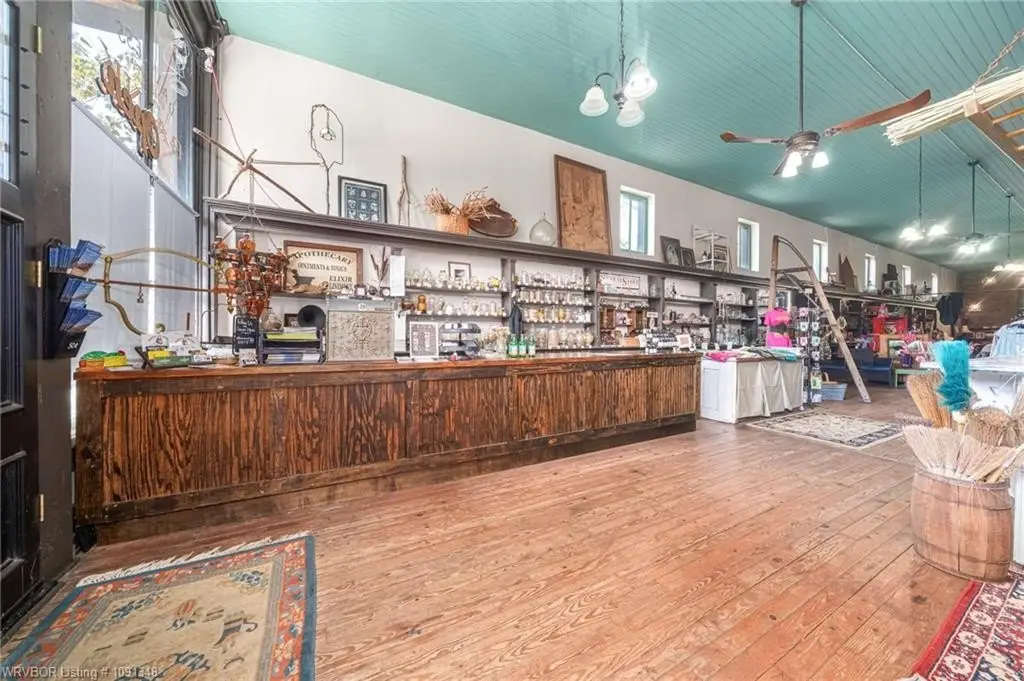
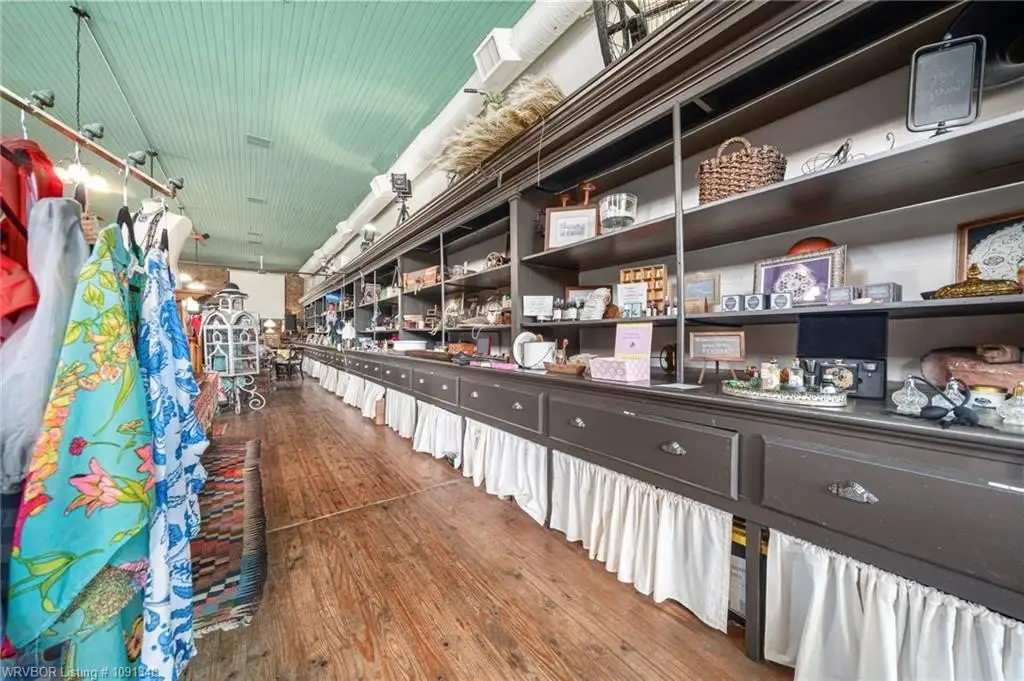
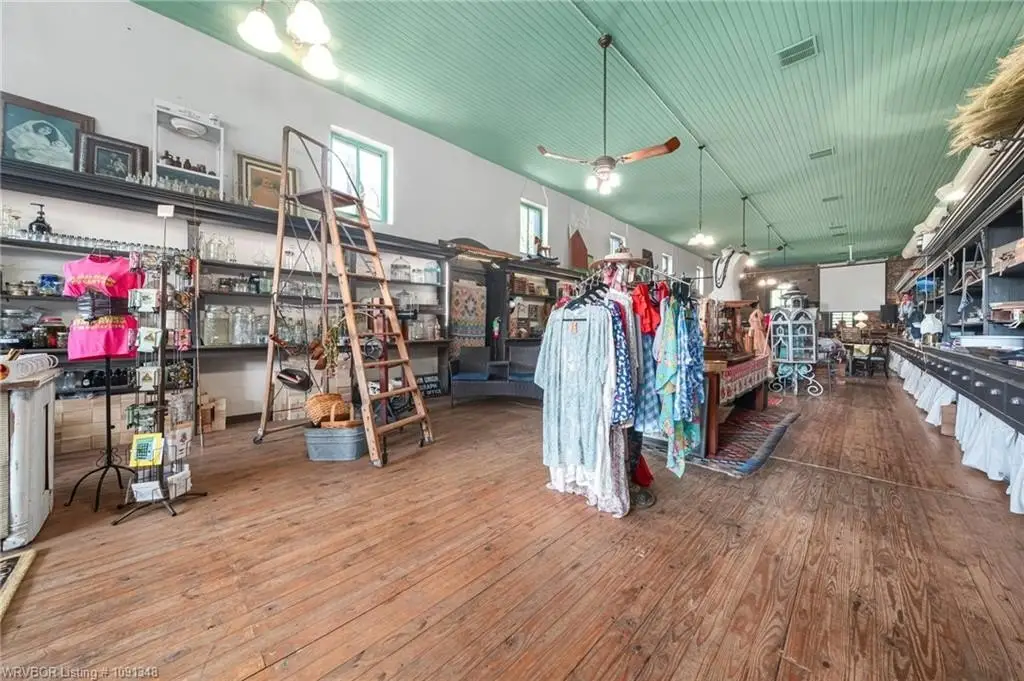
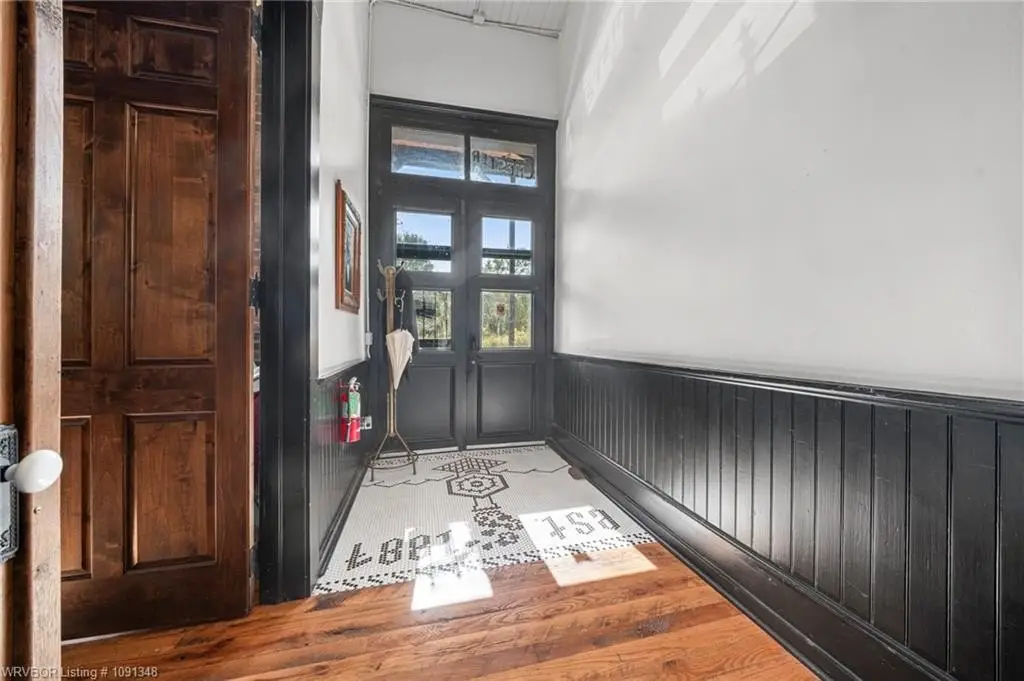
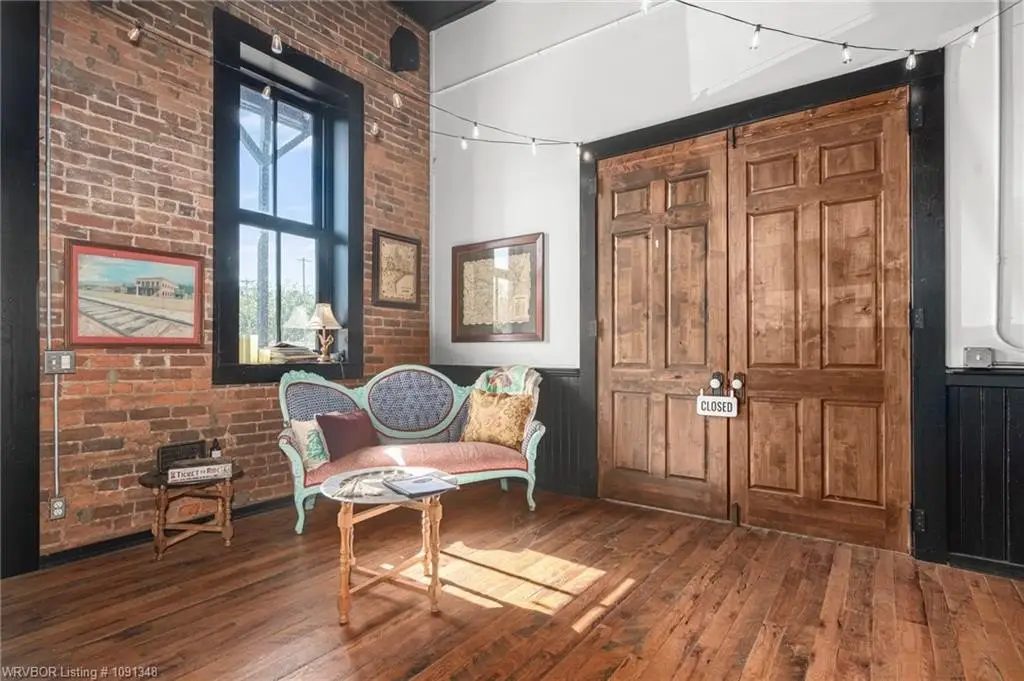
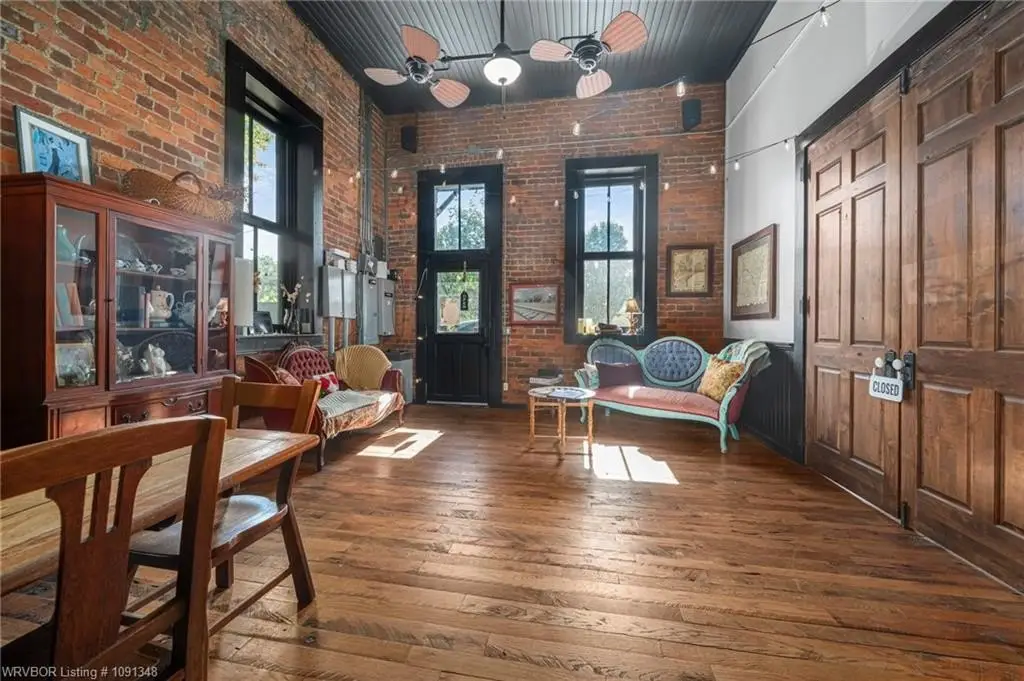
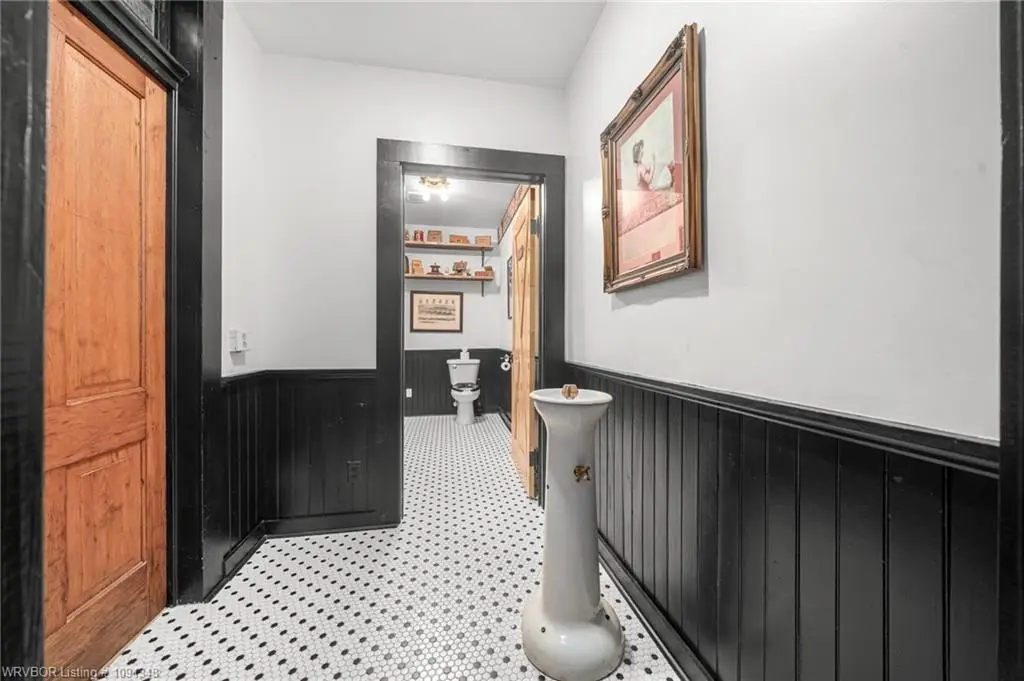
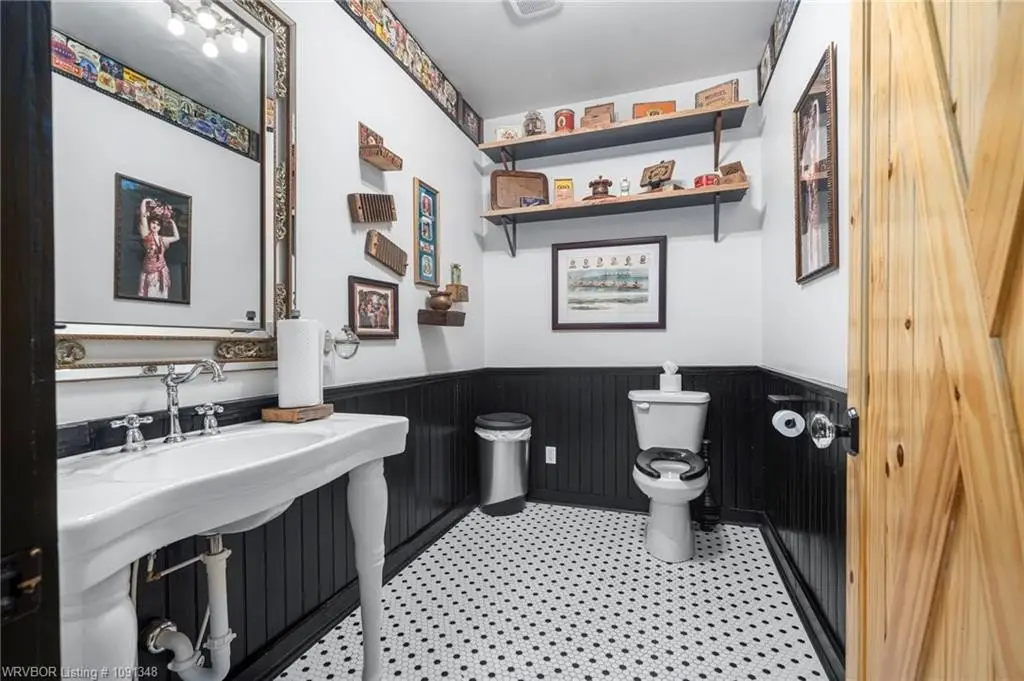
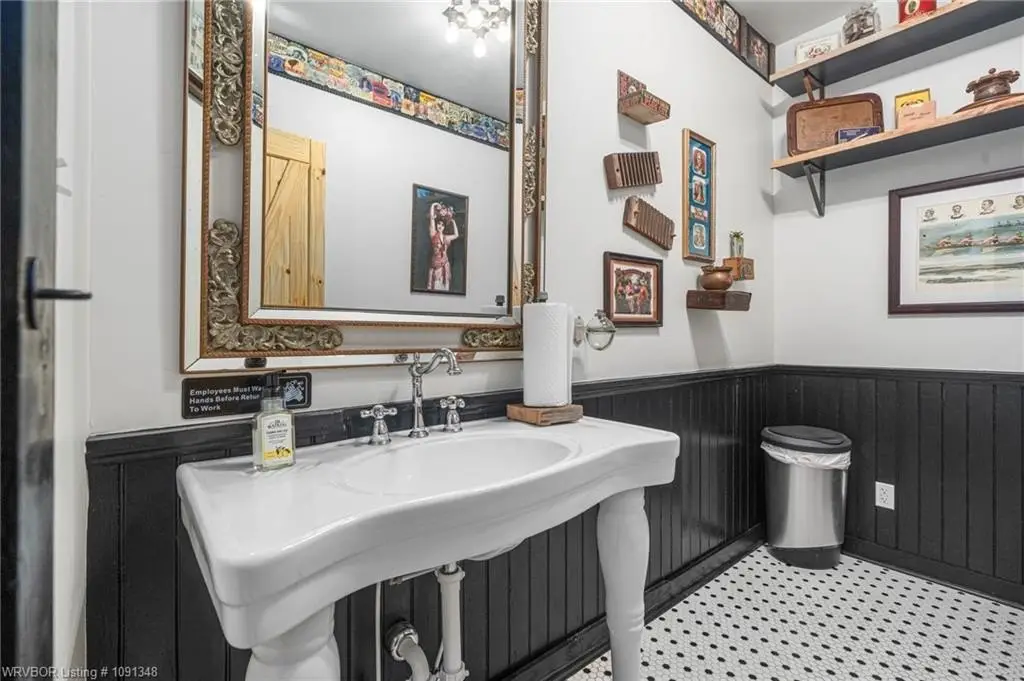
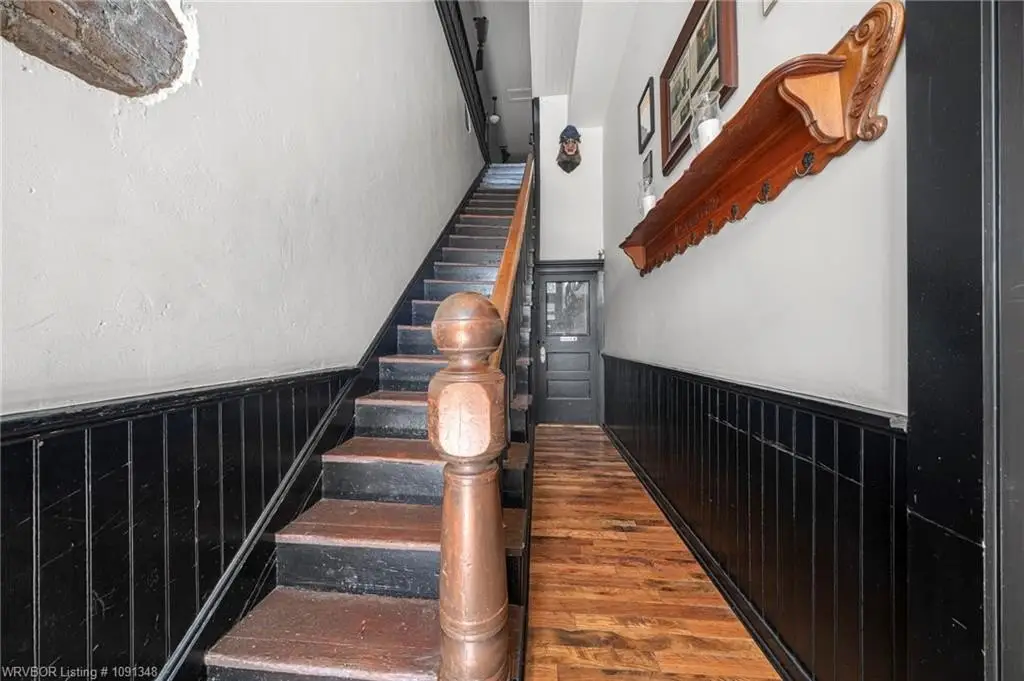
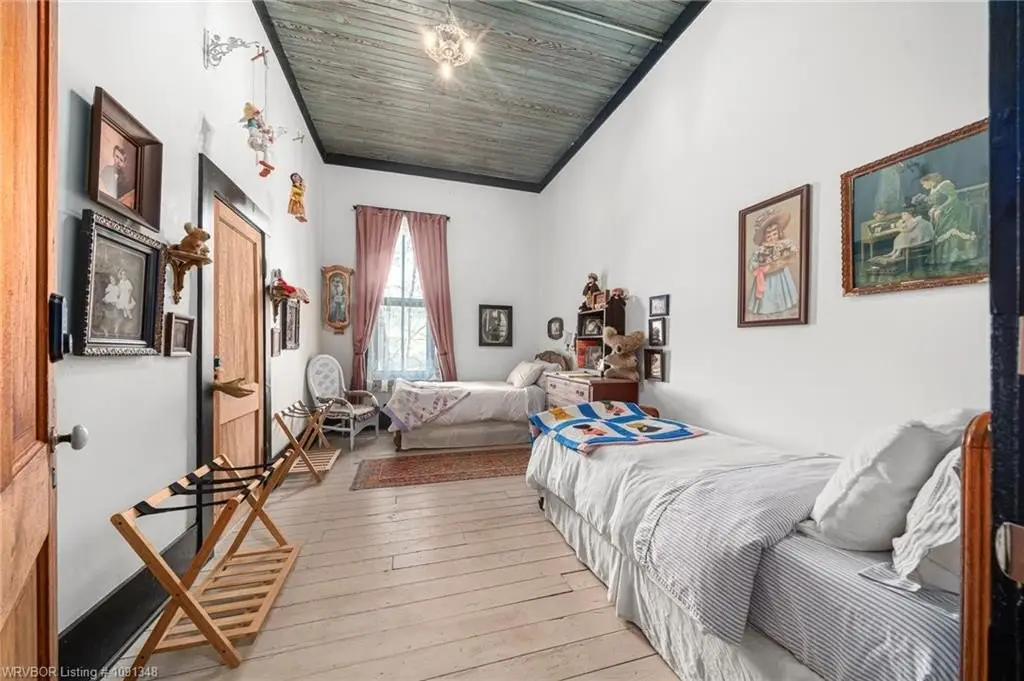
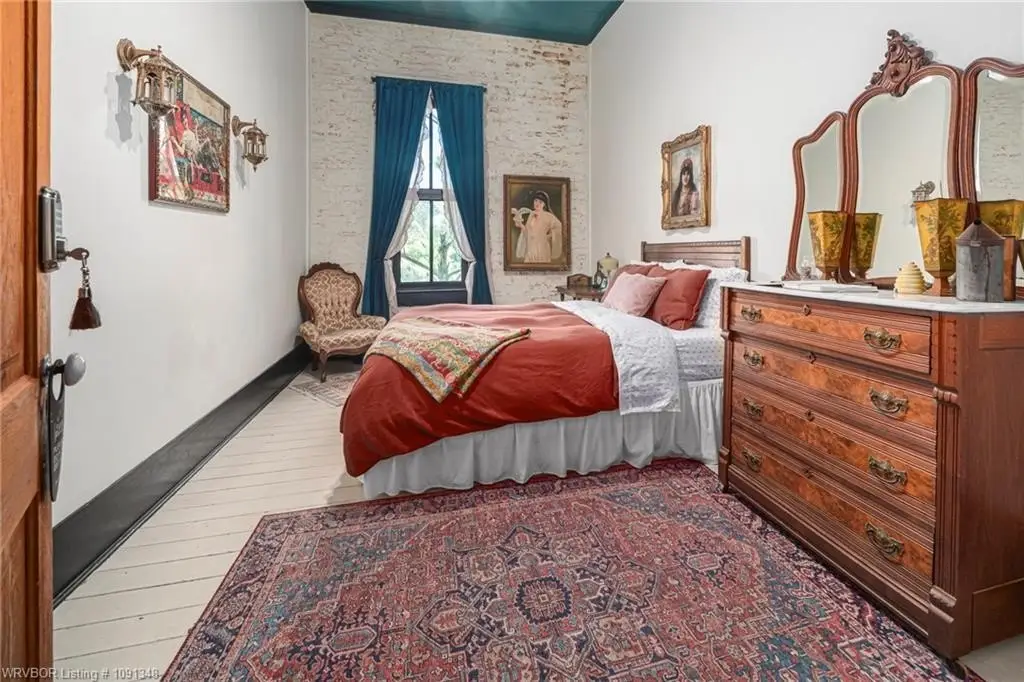
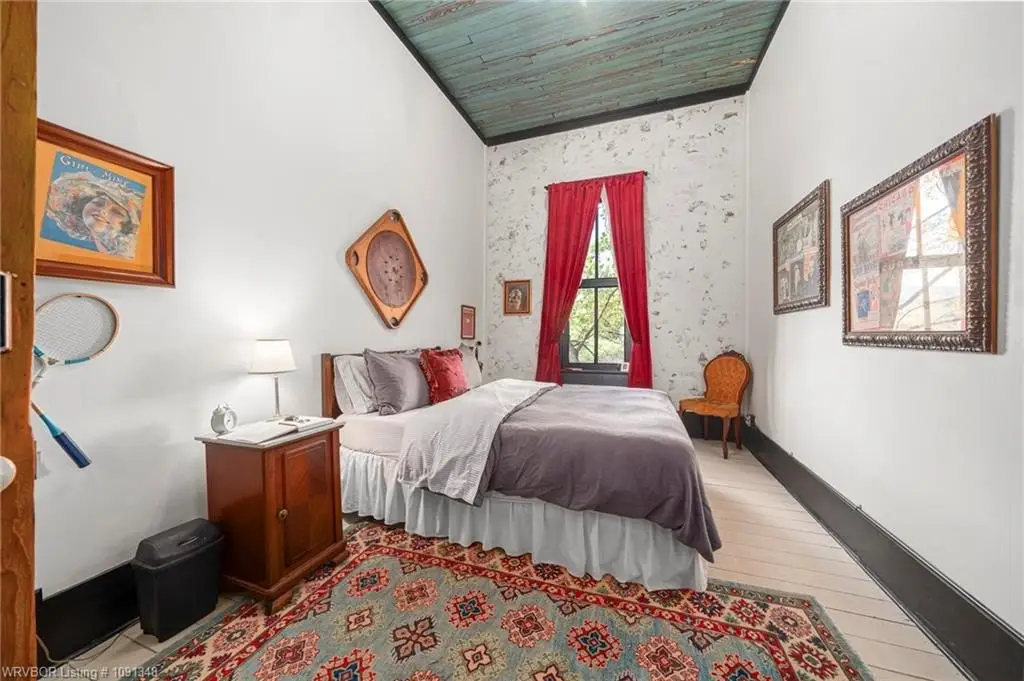
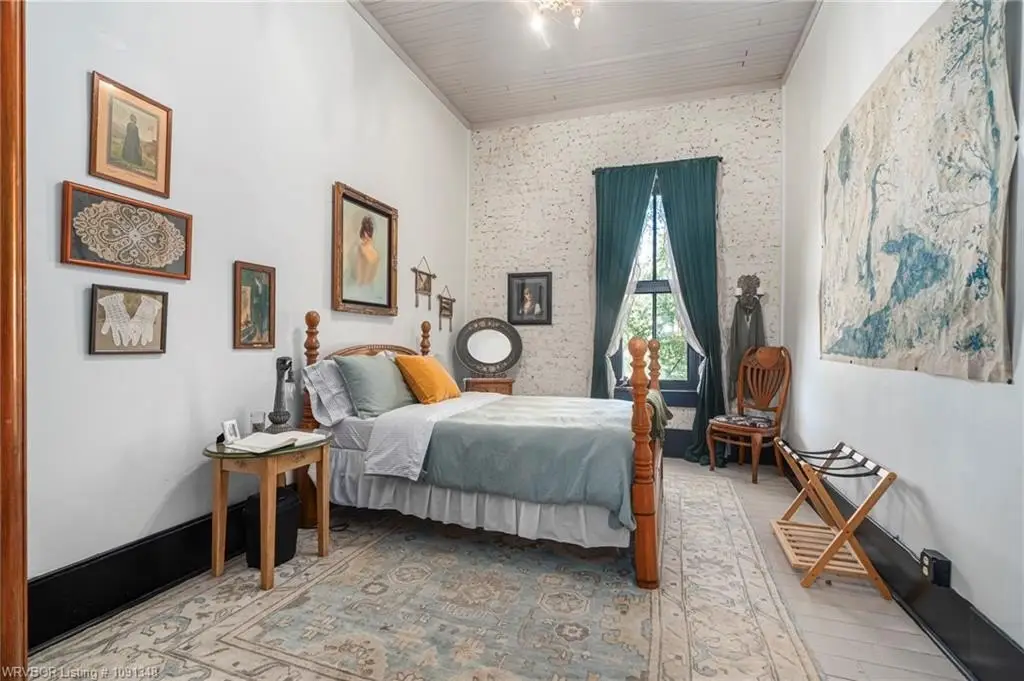
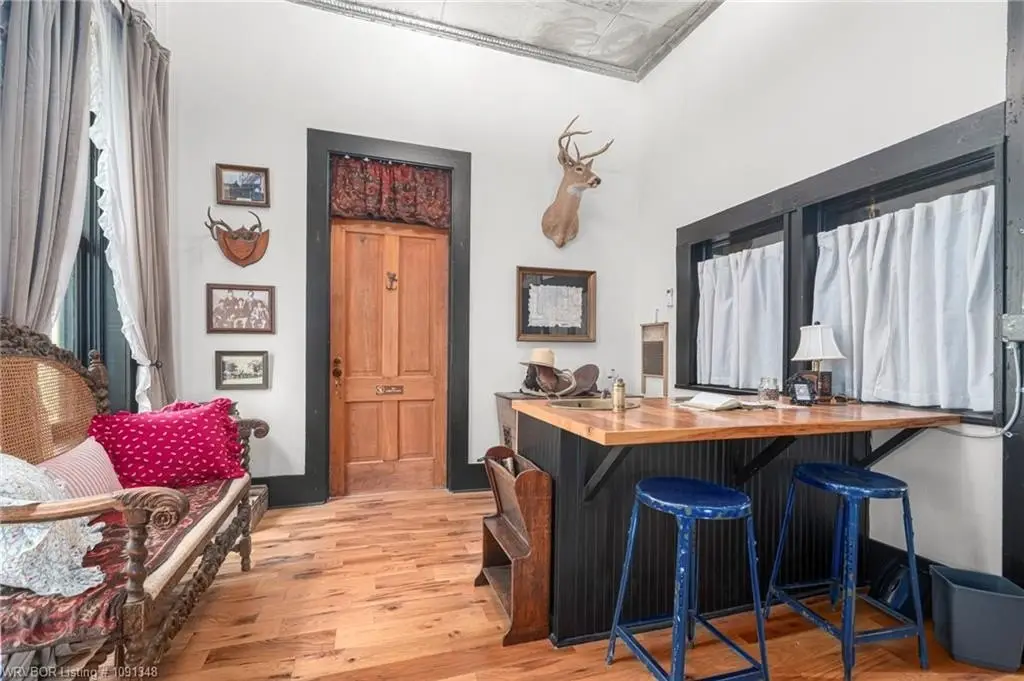
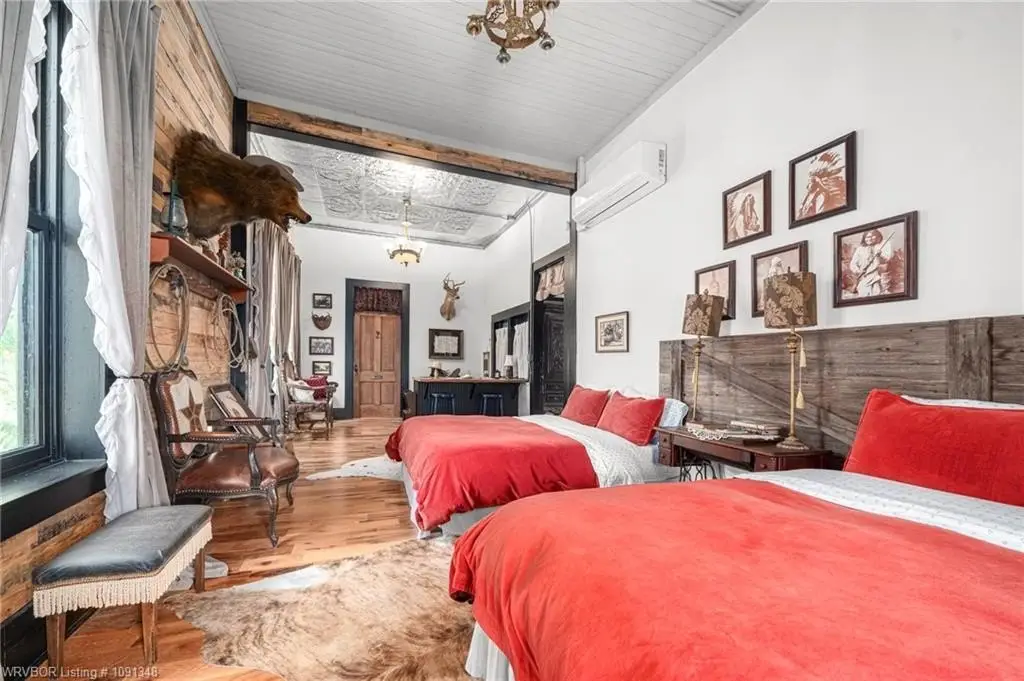
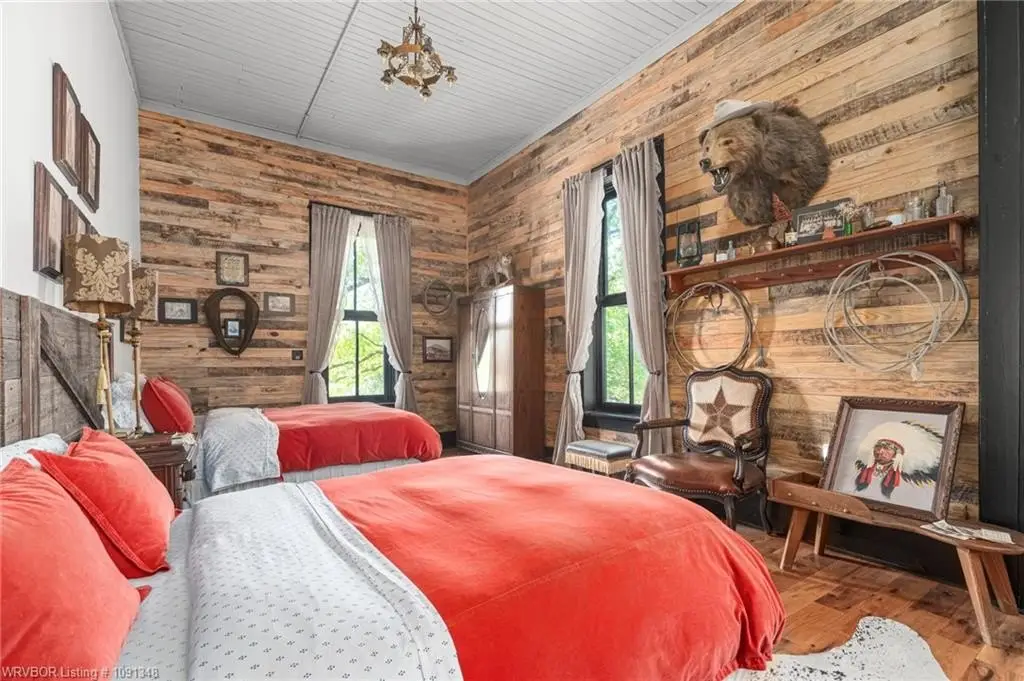
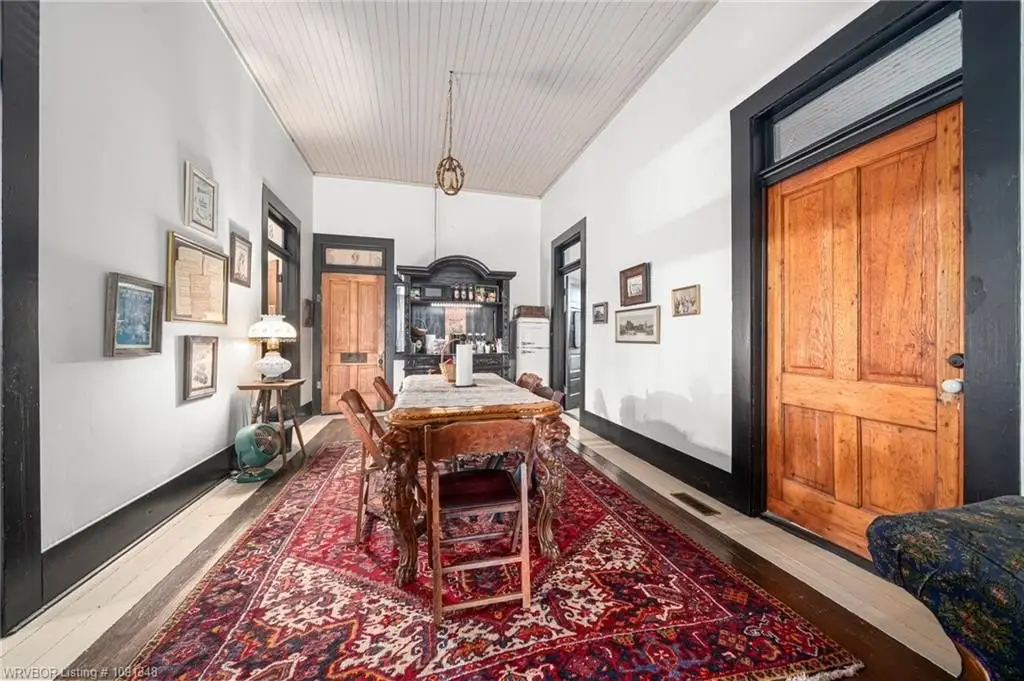
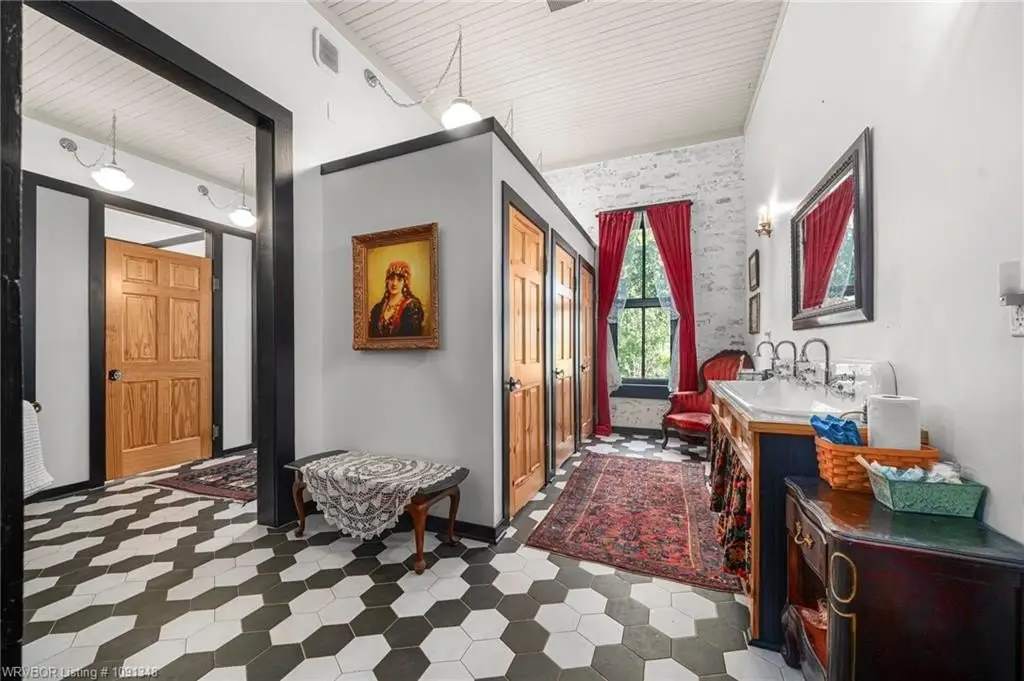
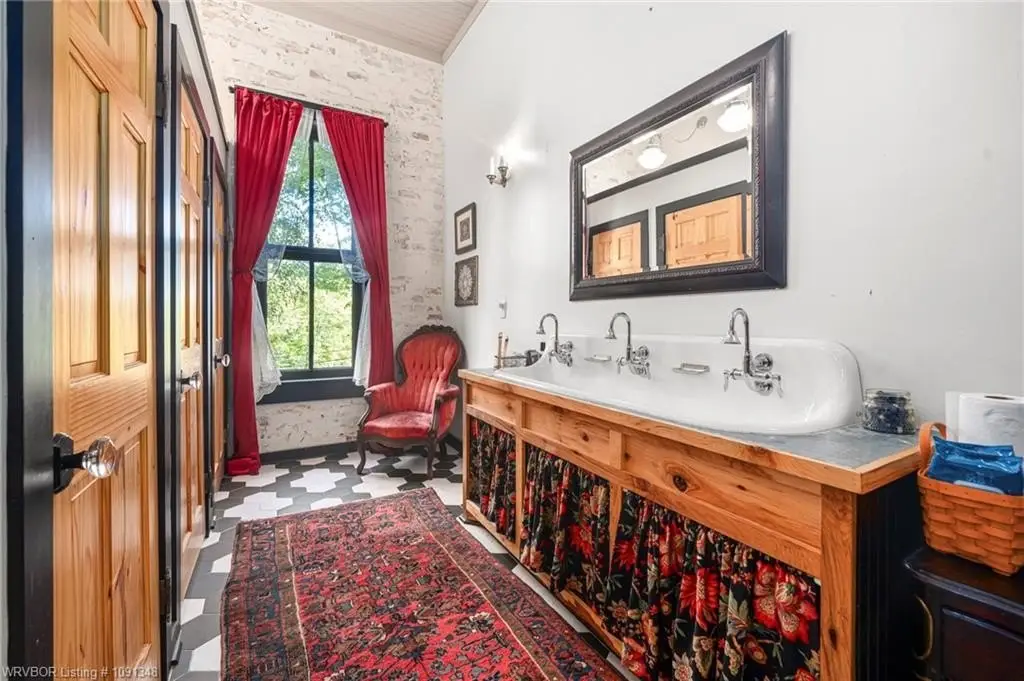
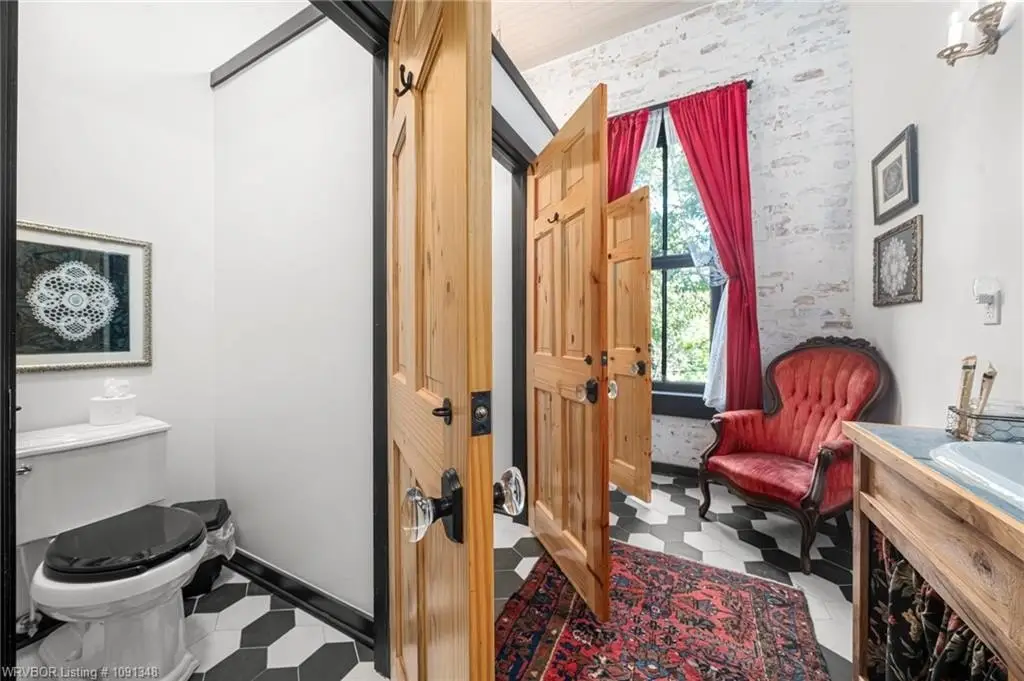
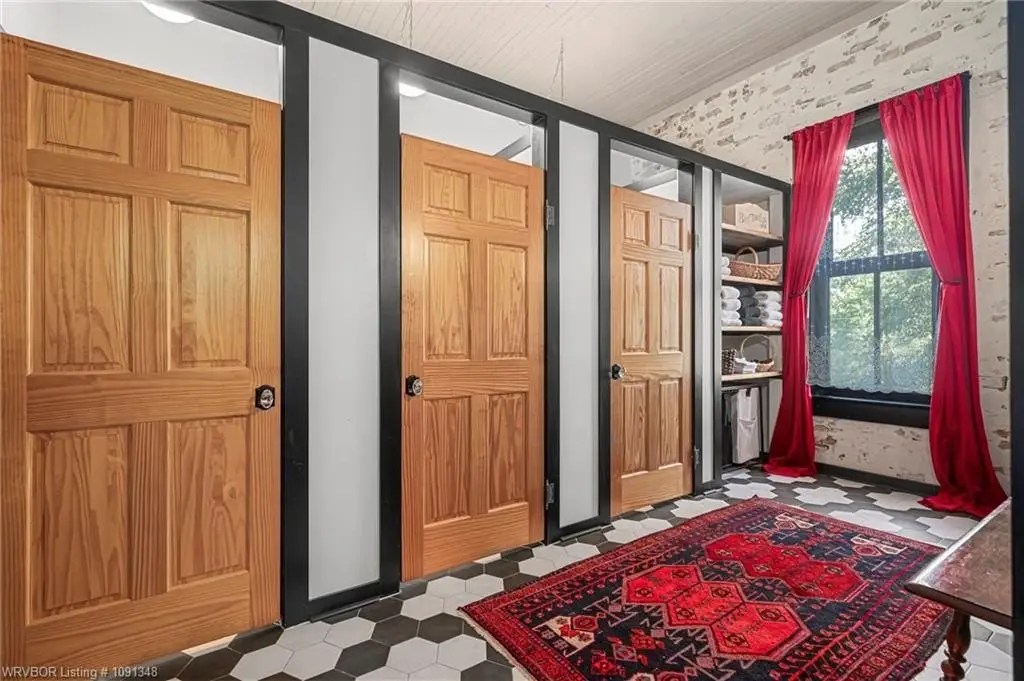
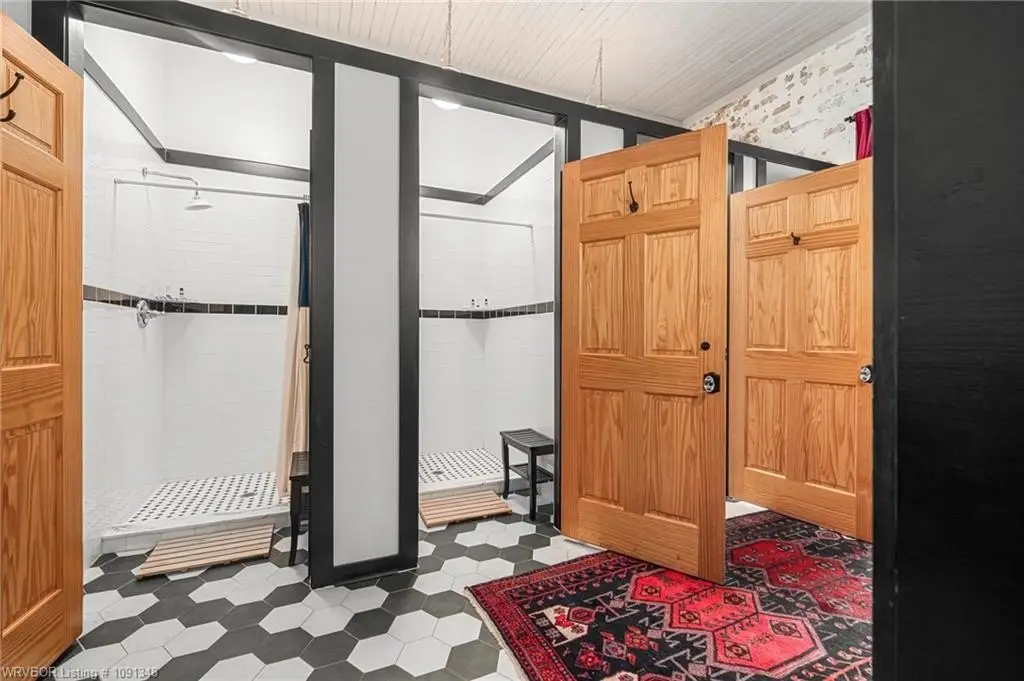
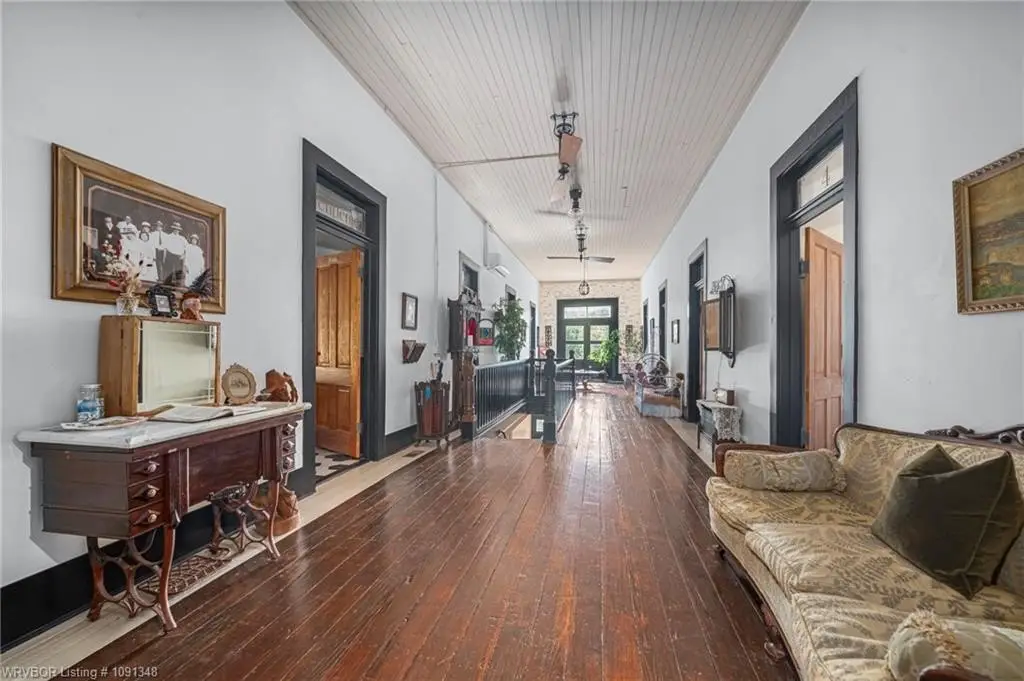
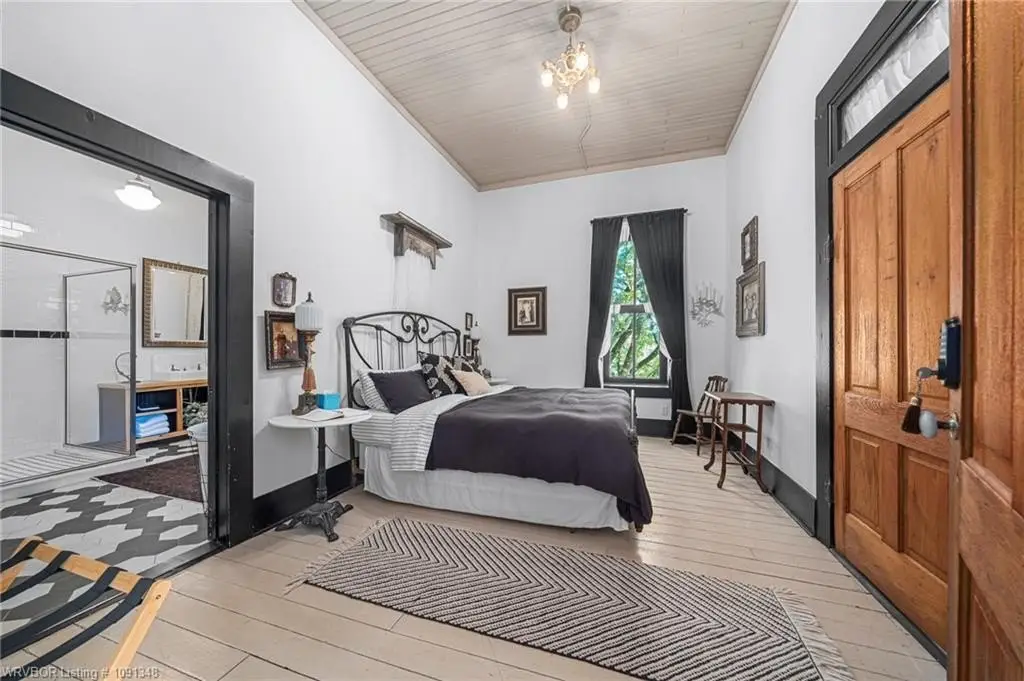
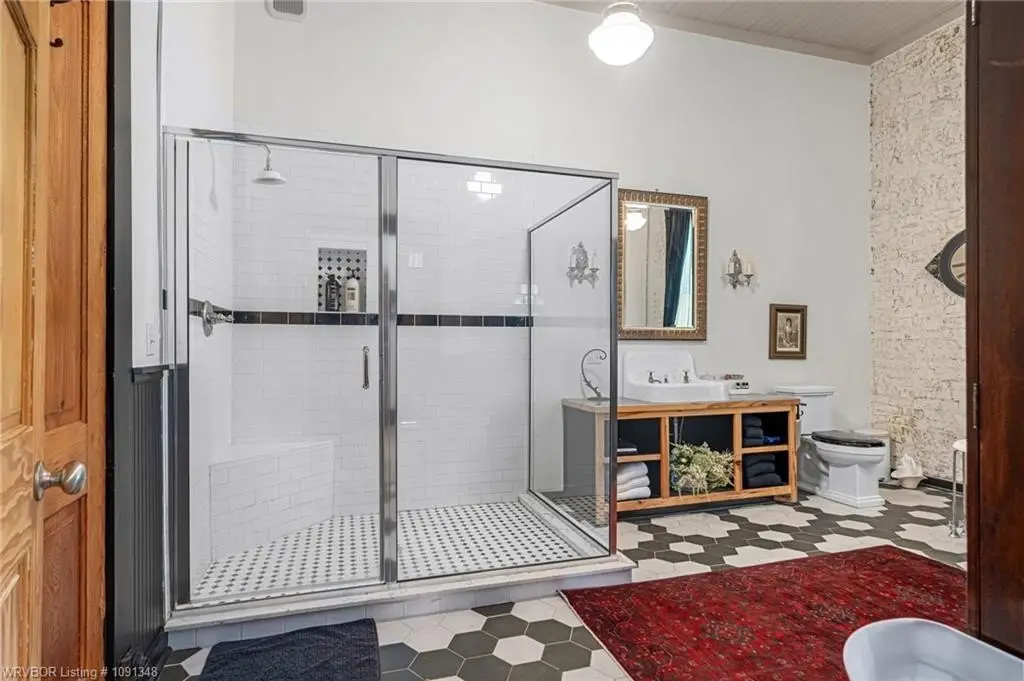
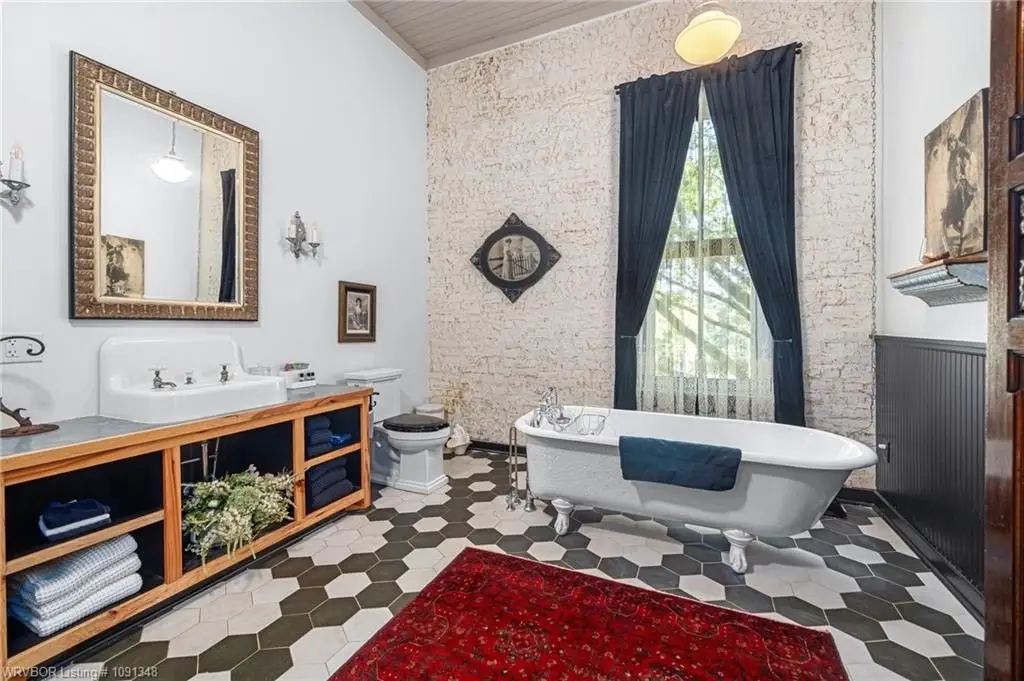
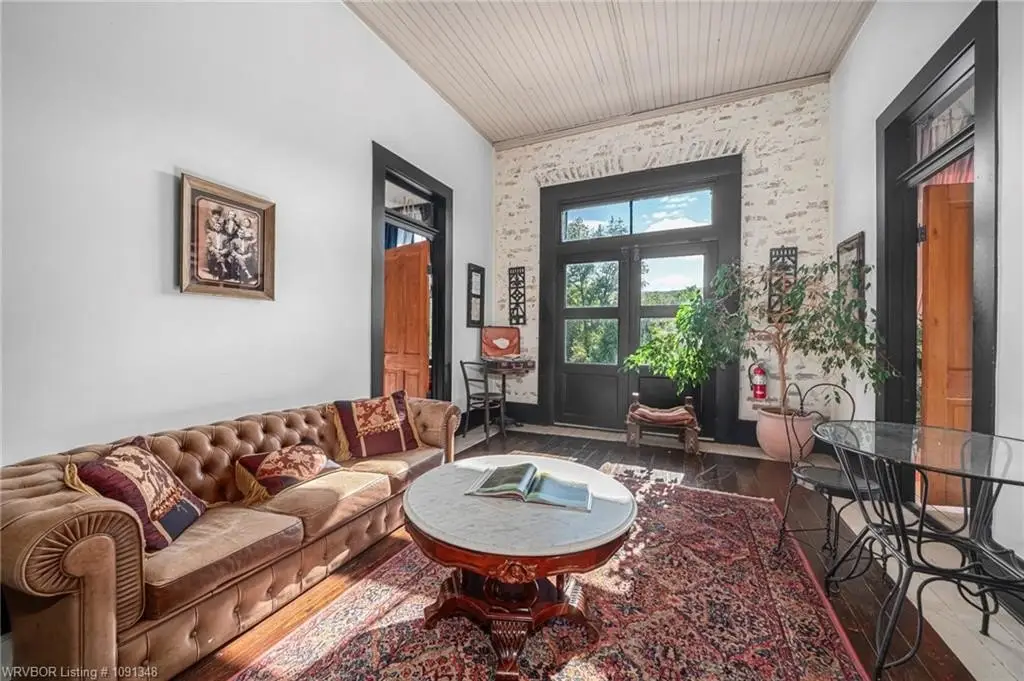
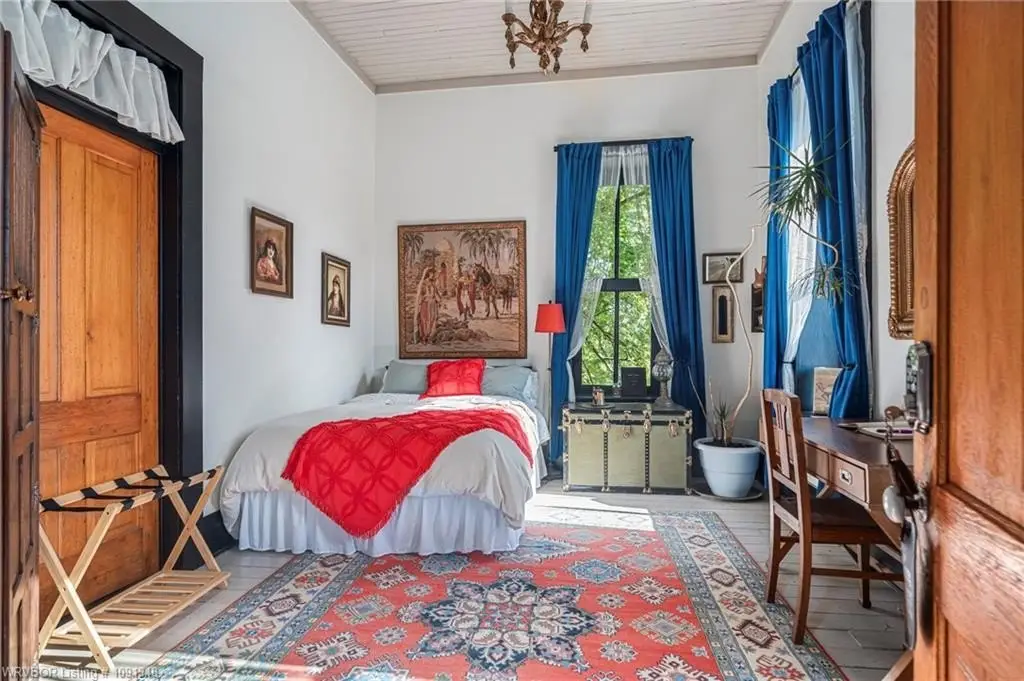
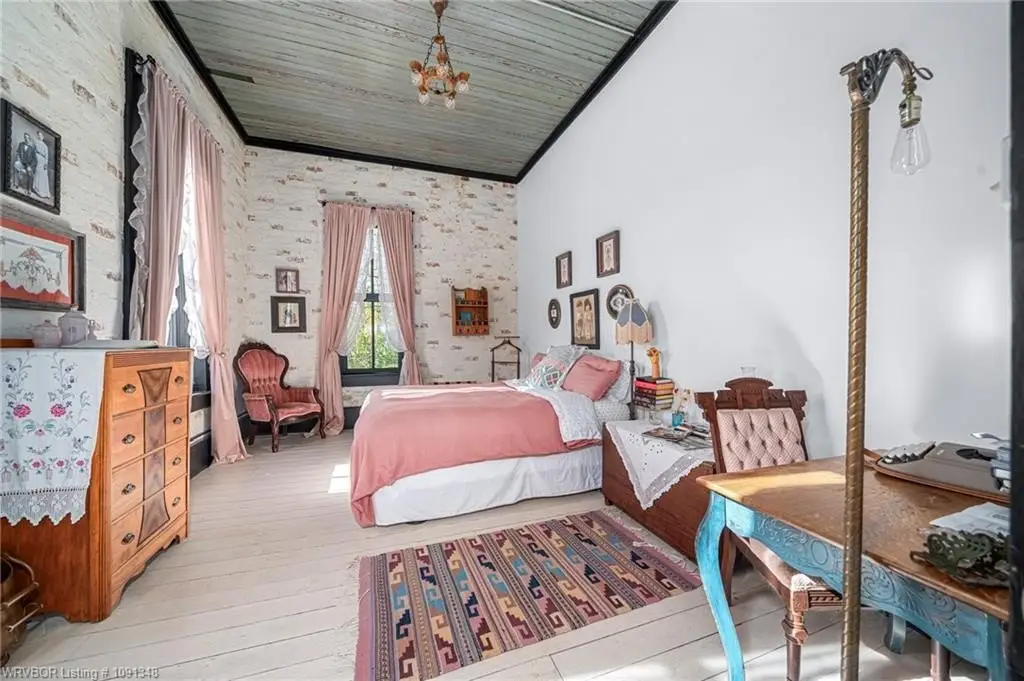
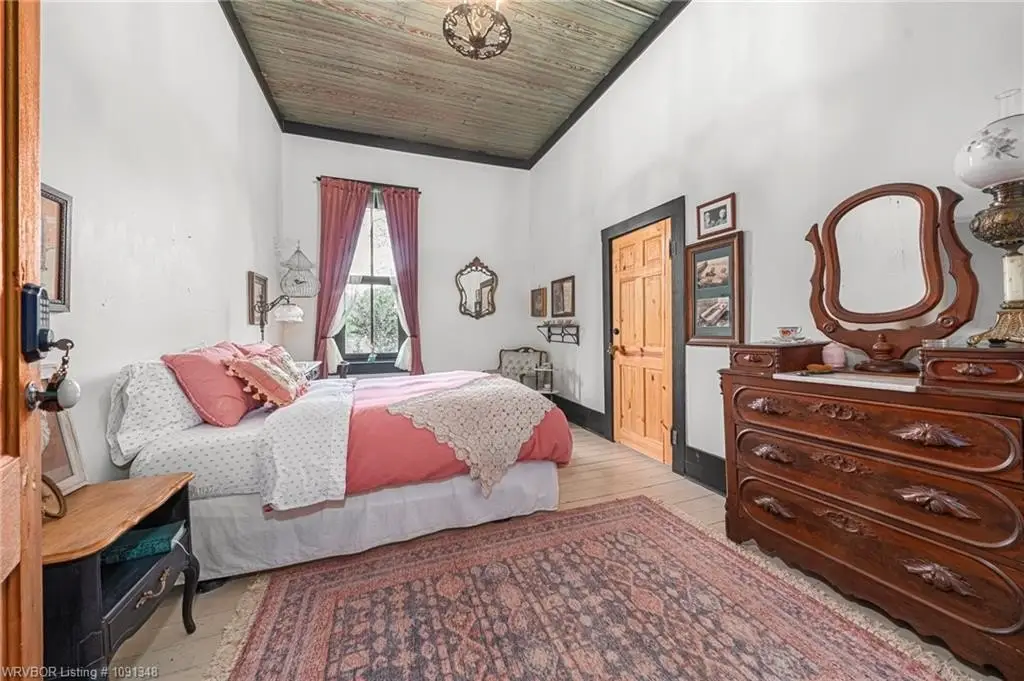
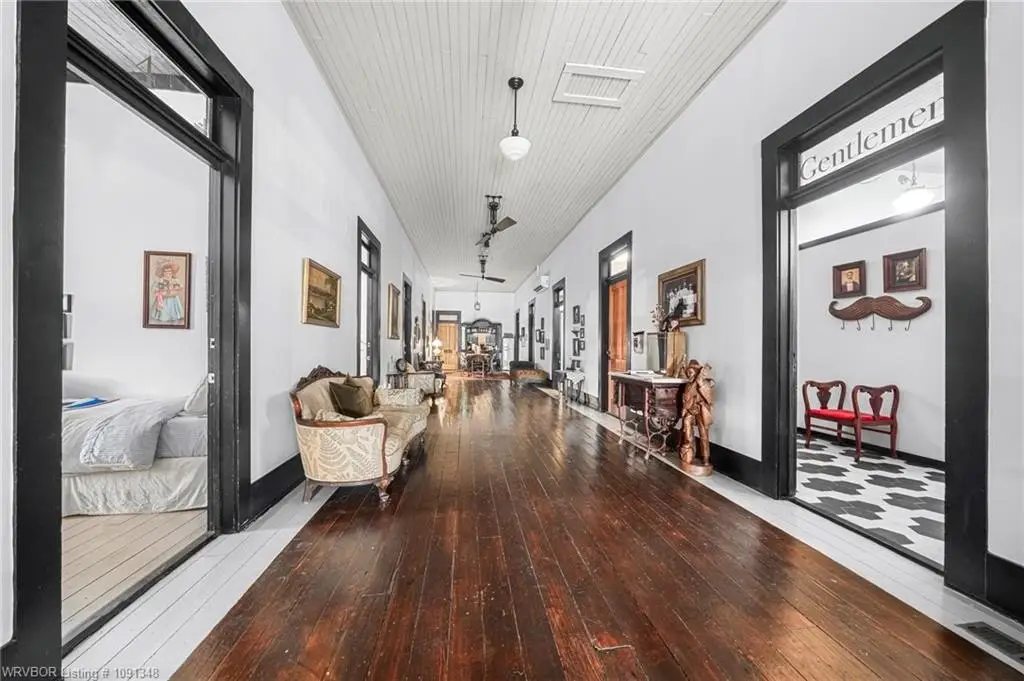
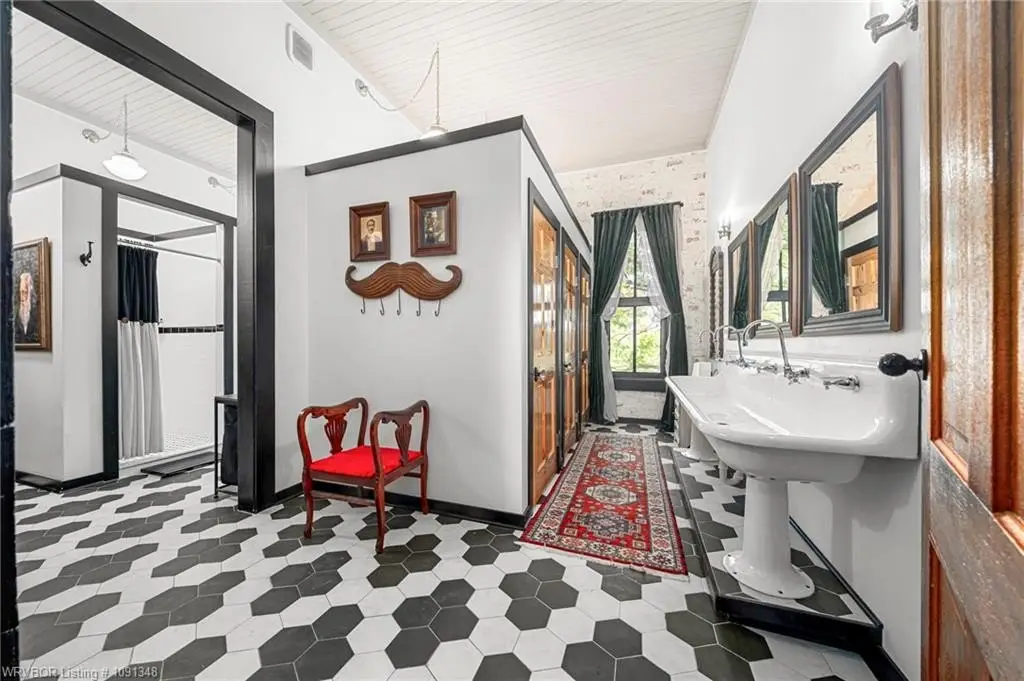
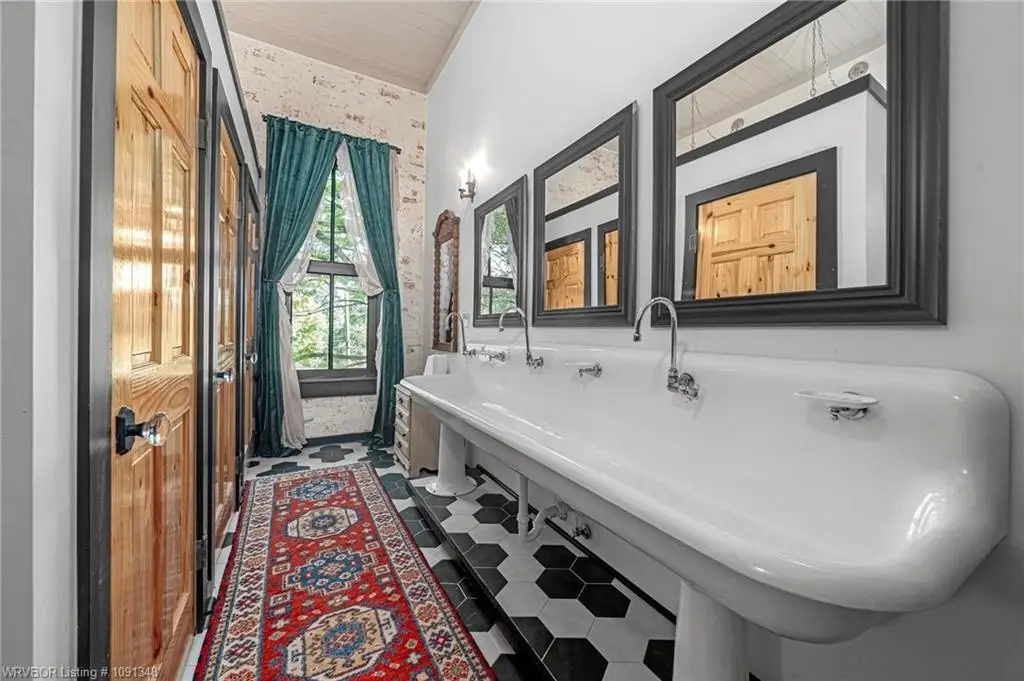
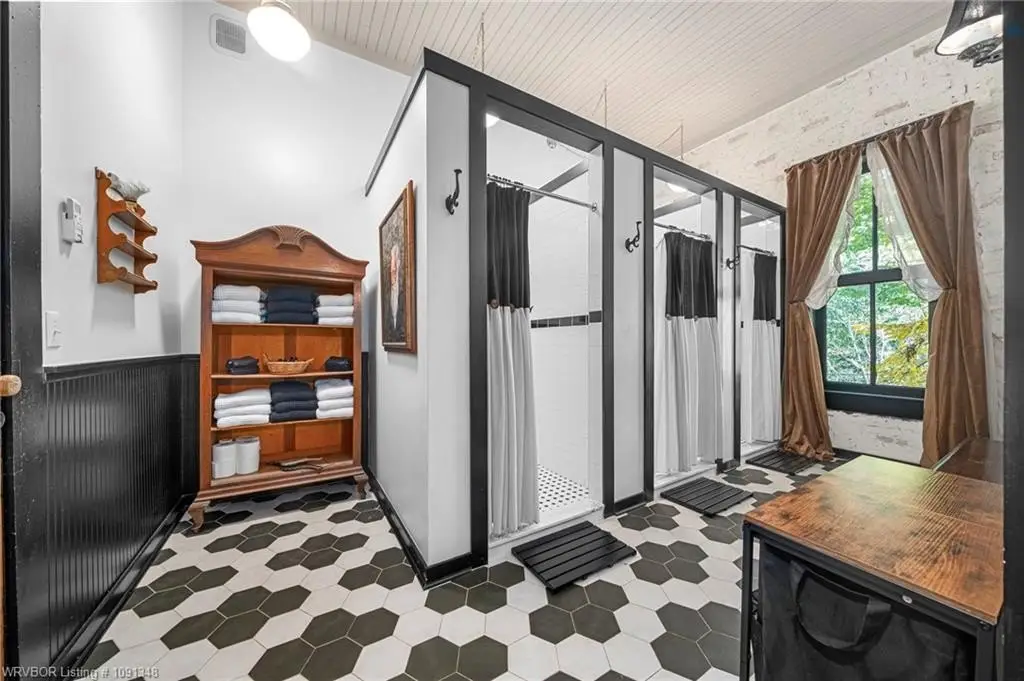
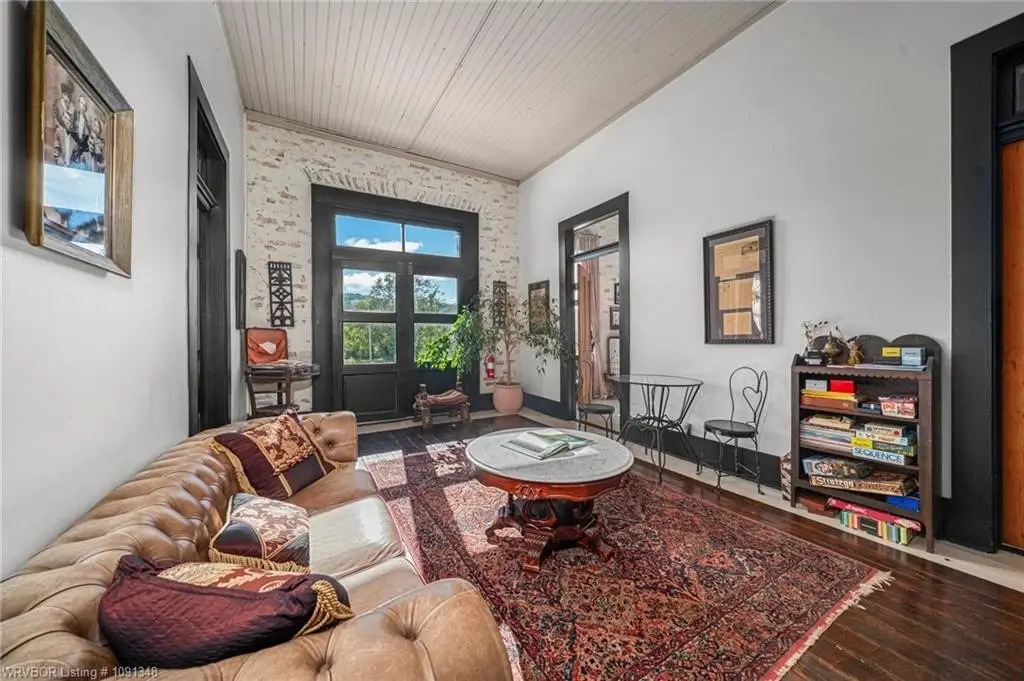
This 9,600-square-foot bed-and-breakfast occupies an 1887 building listed on the National Register of Historic Places since 1974. Five years of restoration retained original architectural elements, including more than forty double-hung sash windows and original merchandise shelving. The property includes eleven individually designed guest rooms, two luxury suites, and a suite with a kitchenette and expanded bath. Seven showers, nine toilets, and two additional bathing fixtures serve the building.
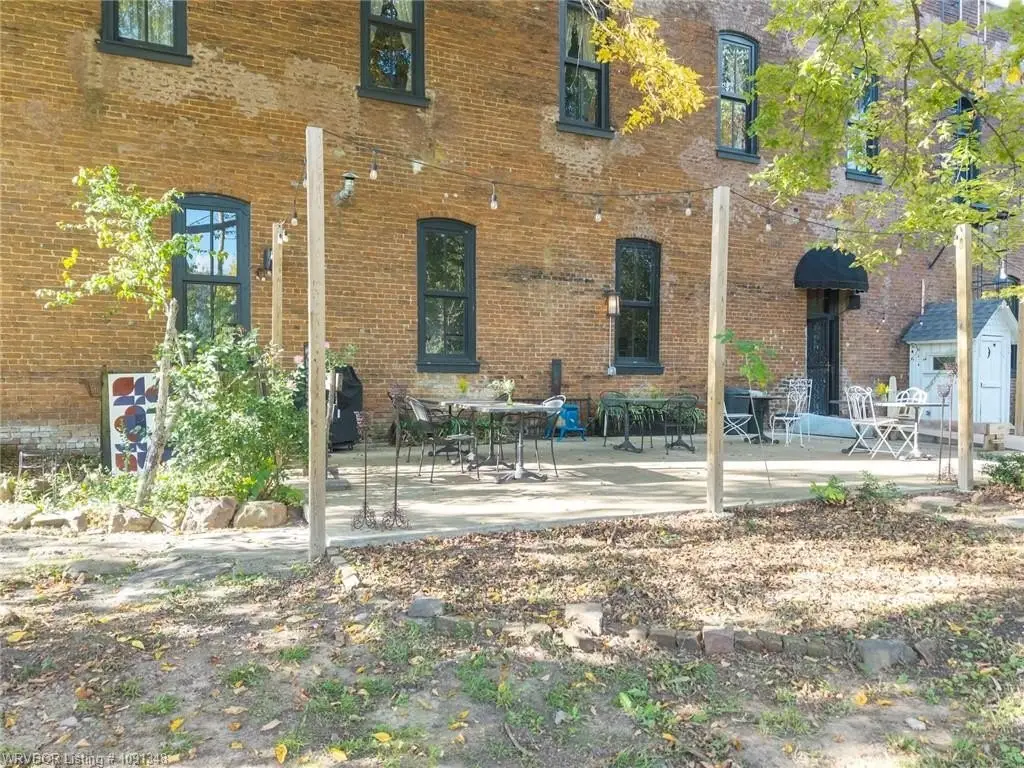
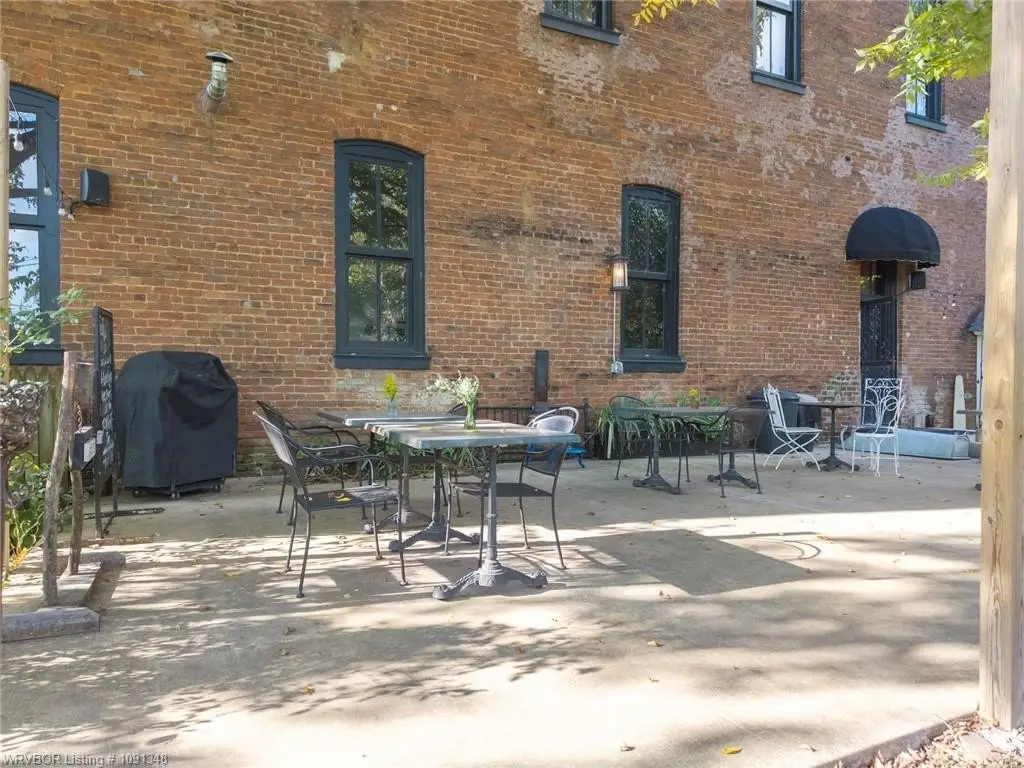
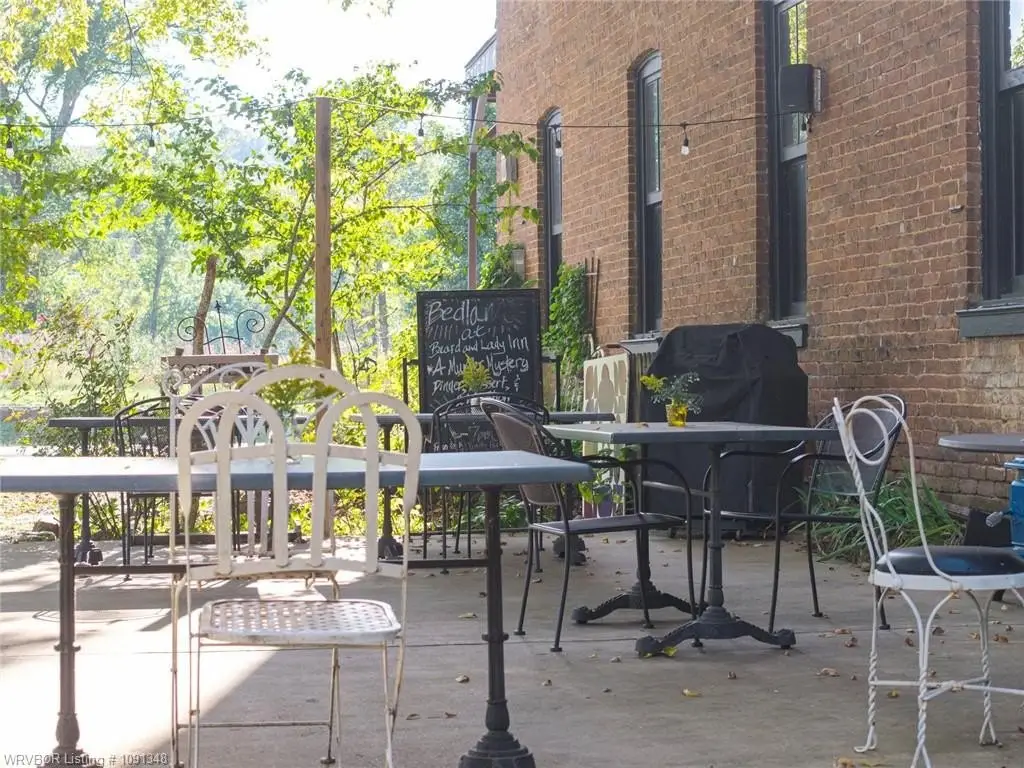
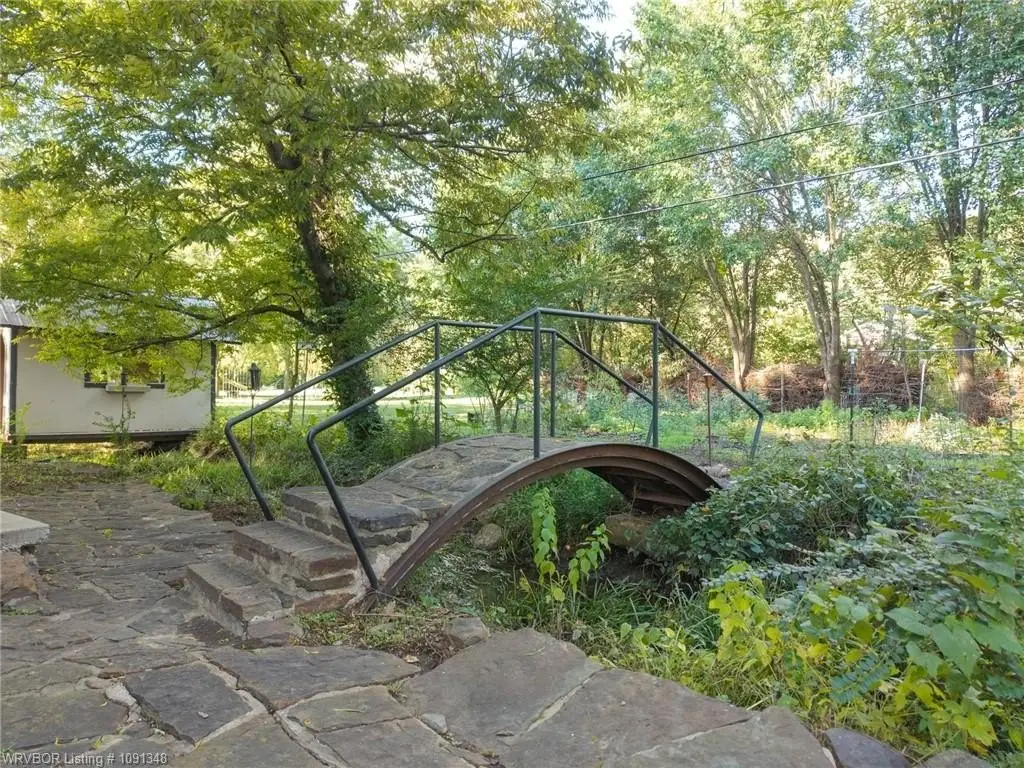
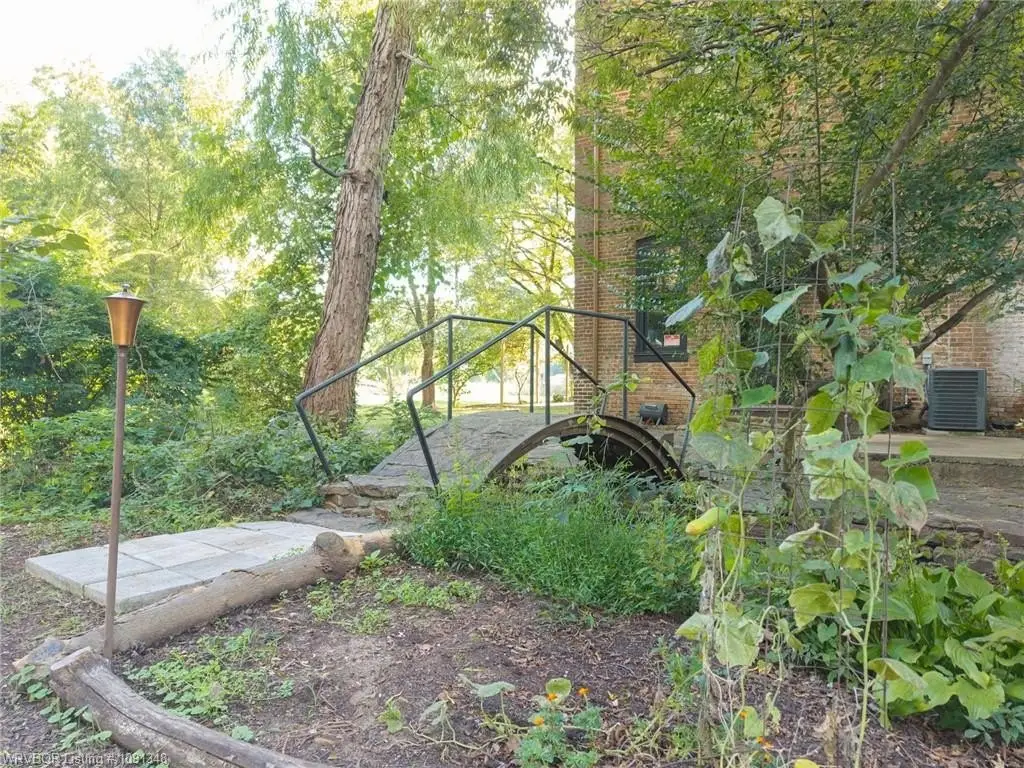
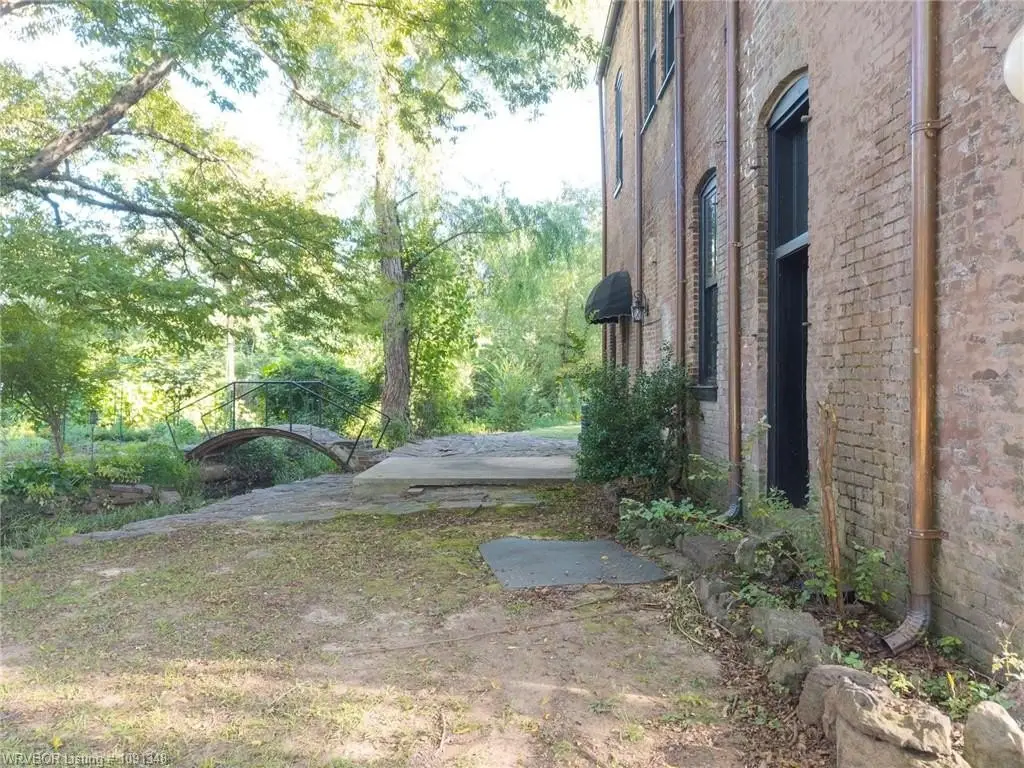
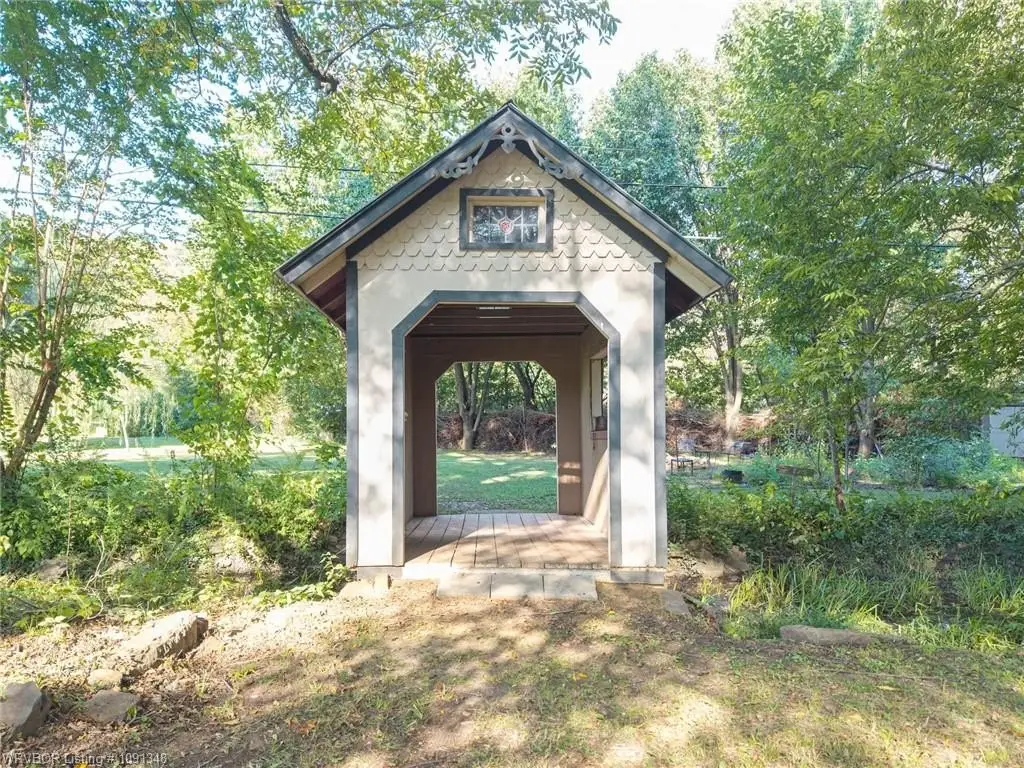
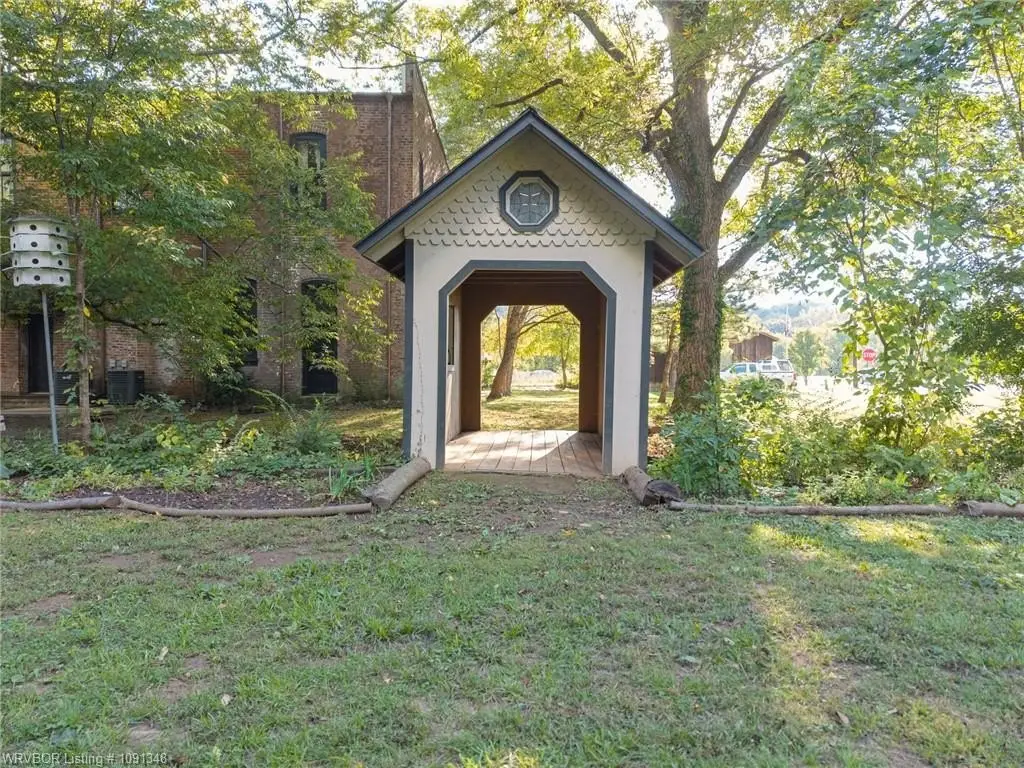
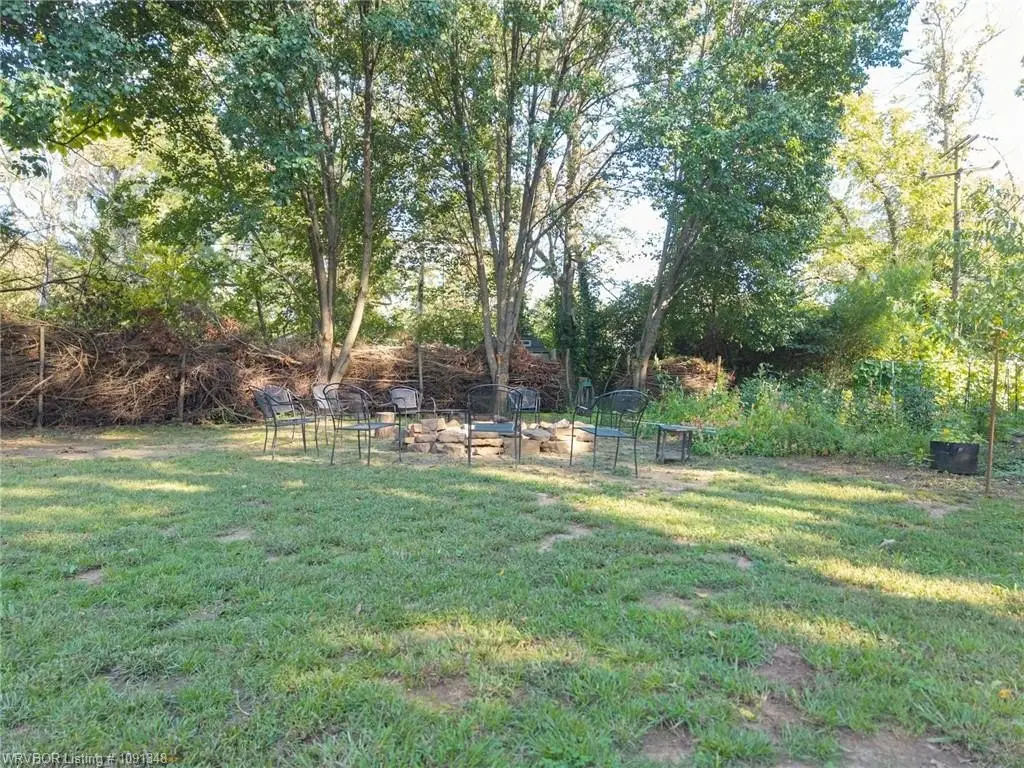
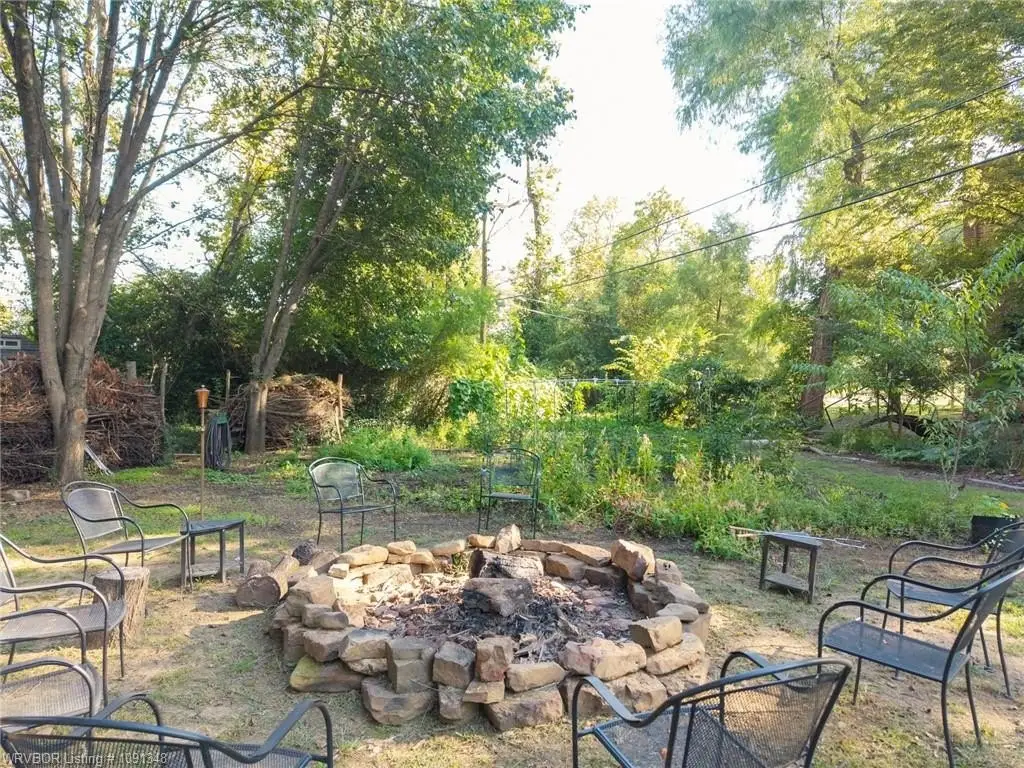
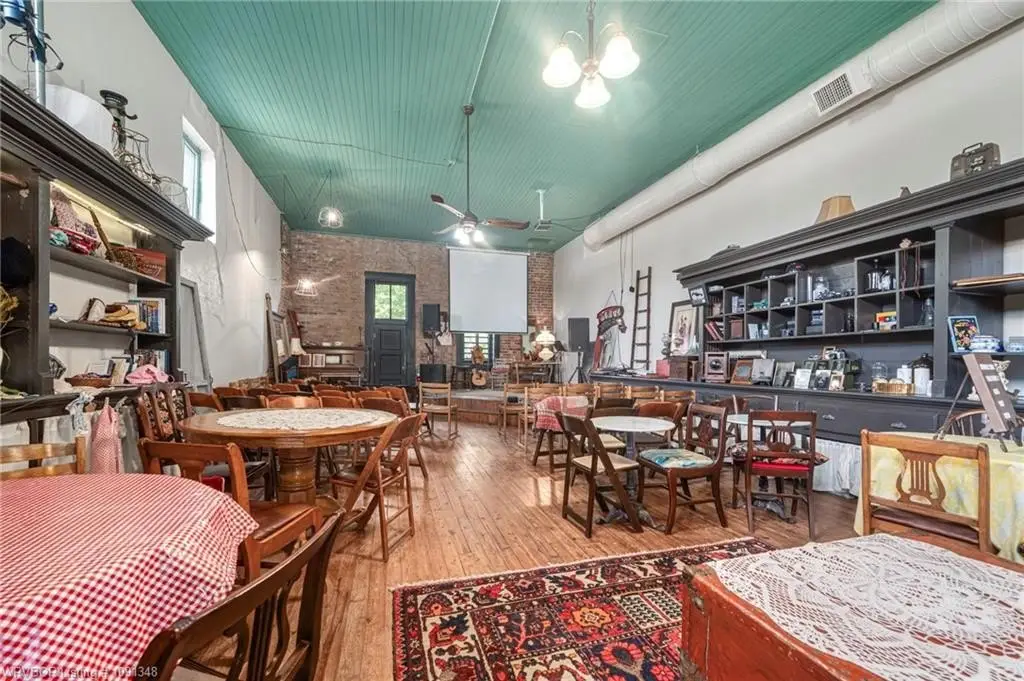
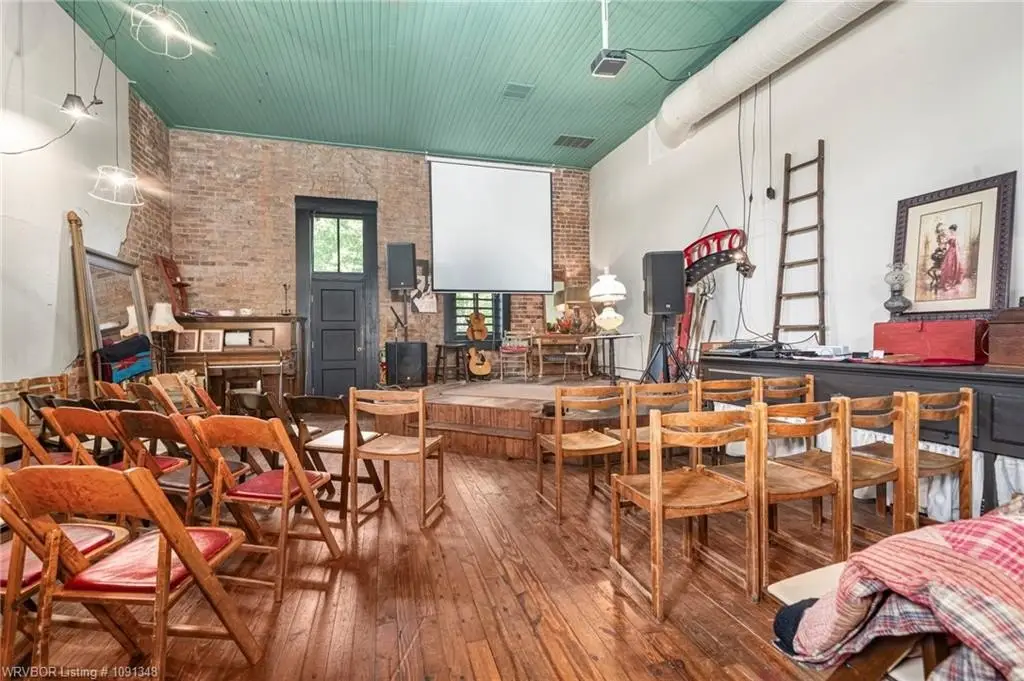
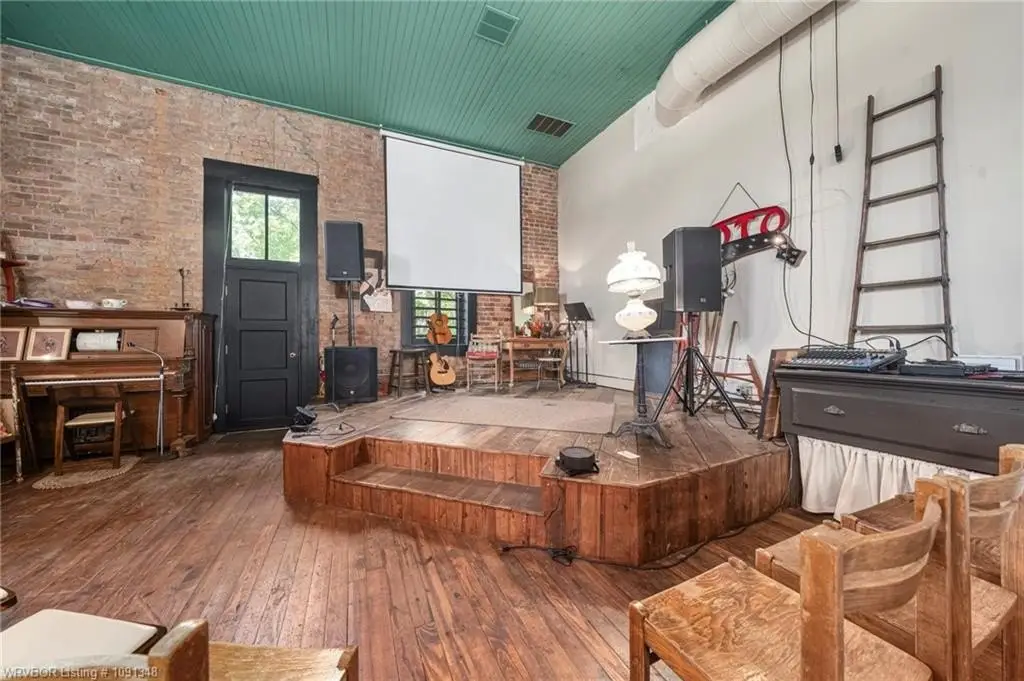
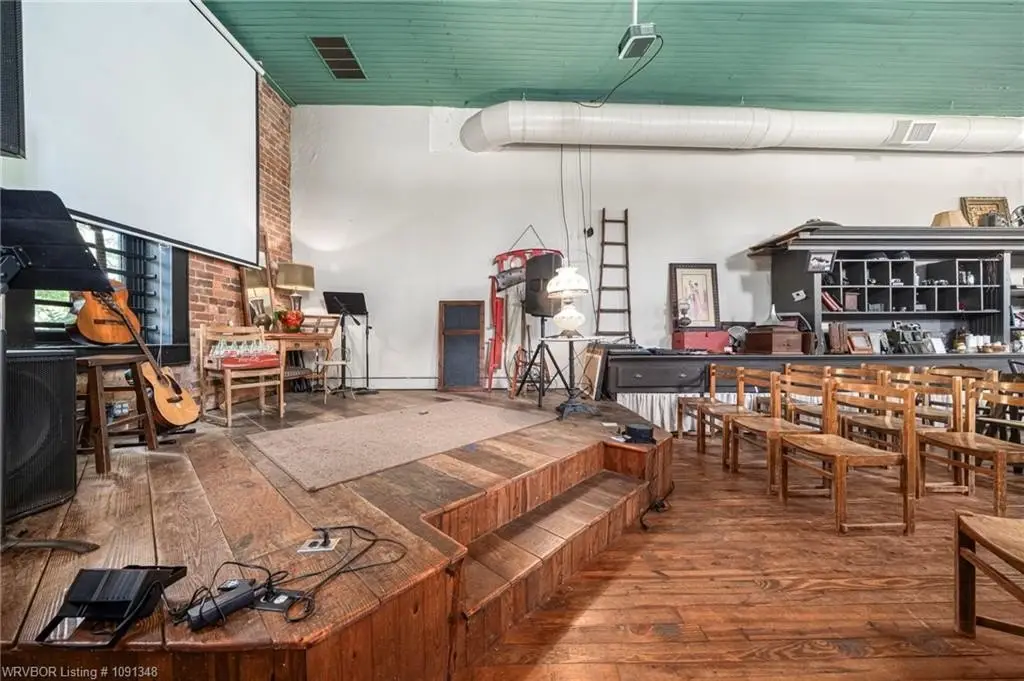
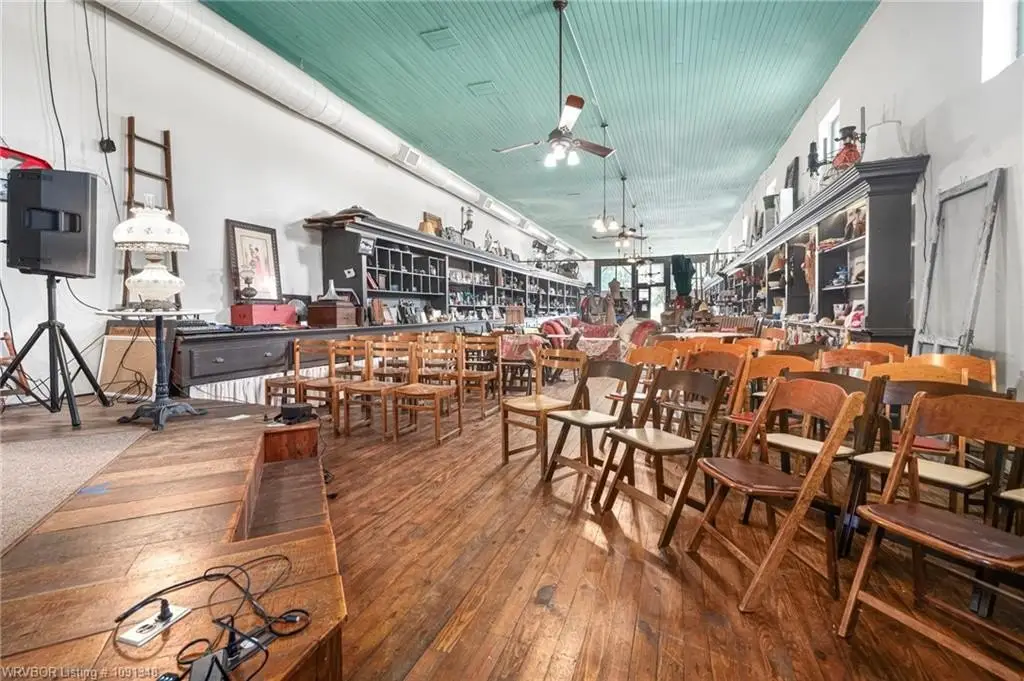
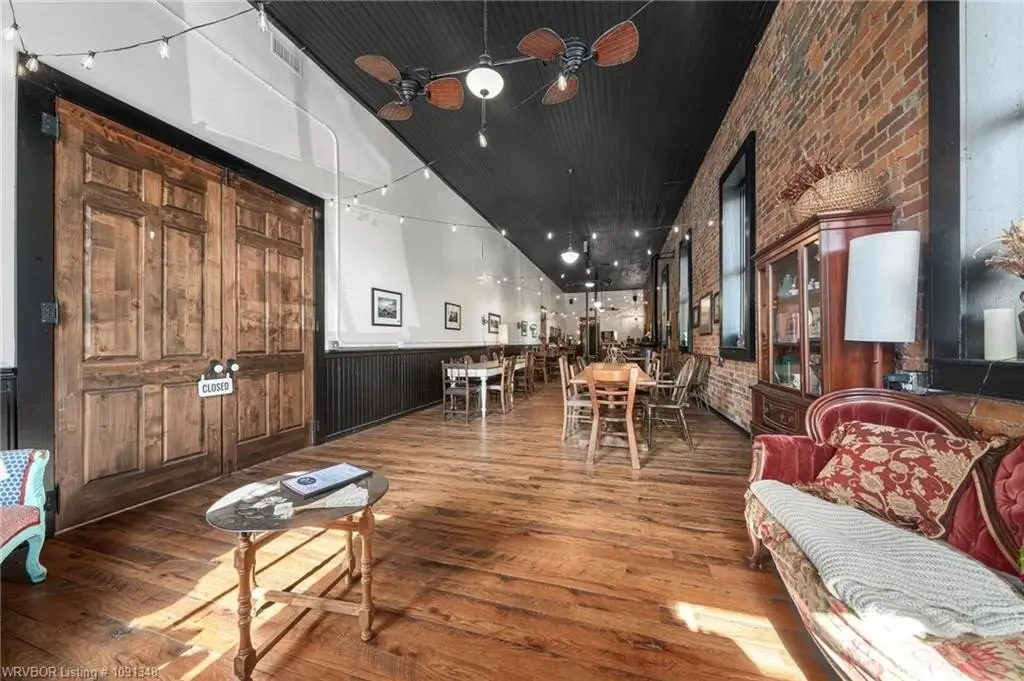
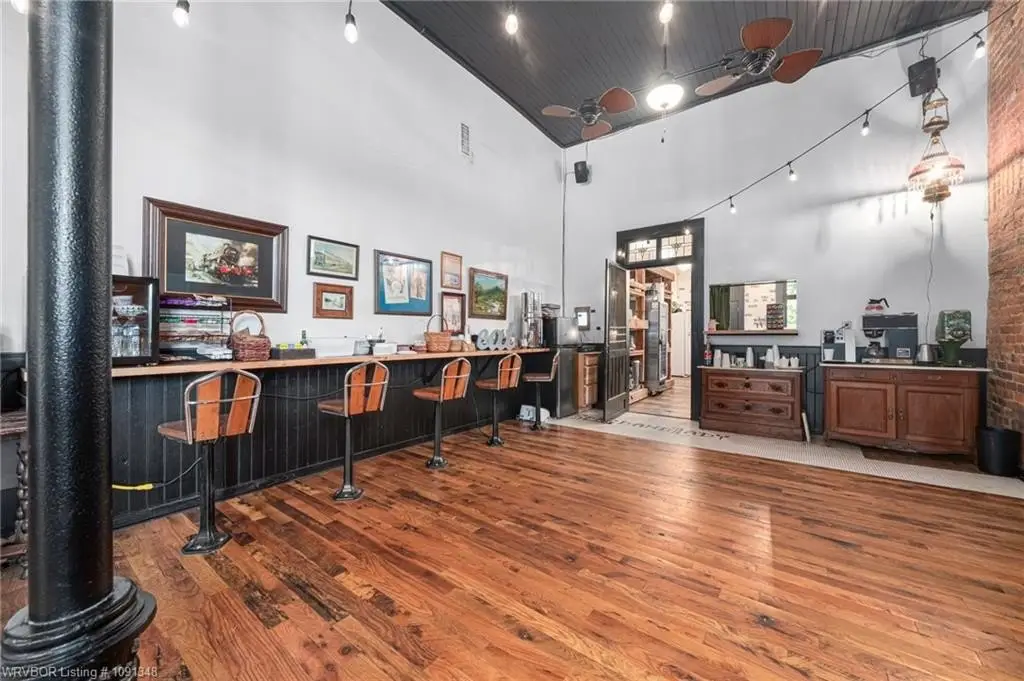
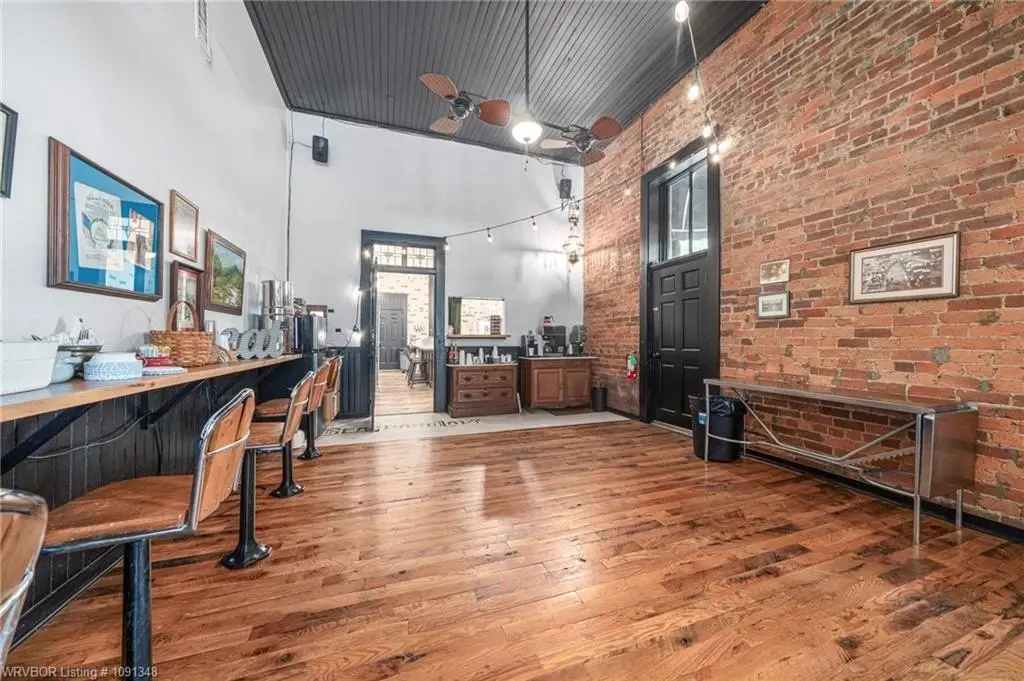
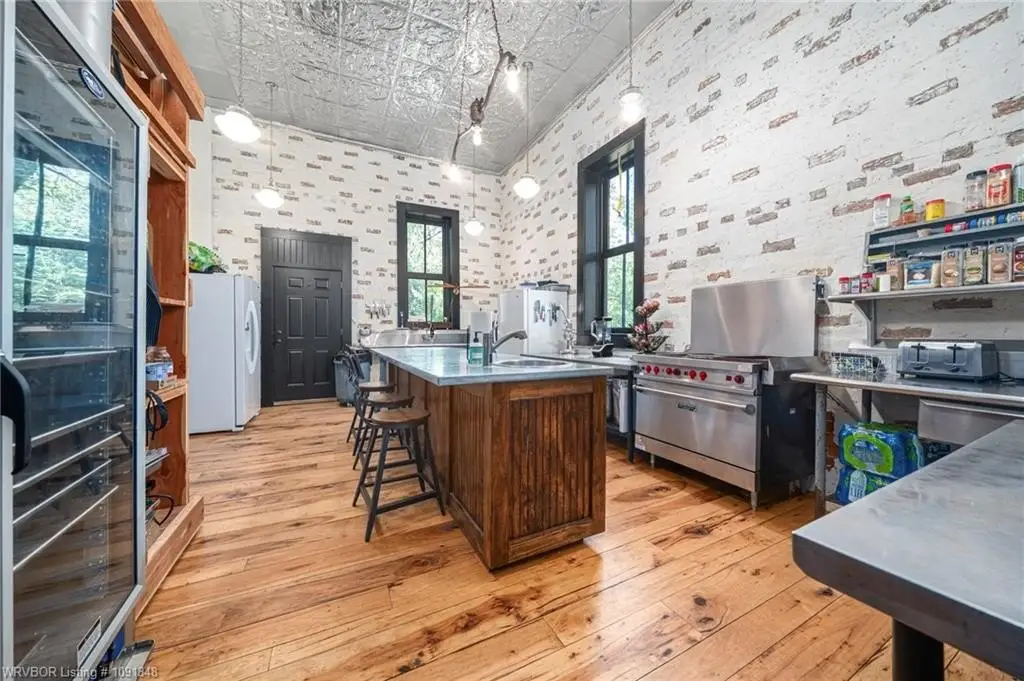
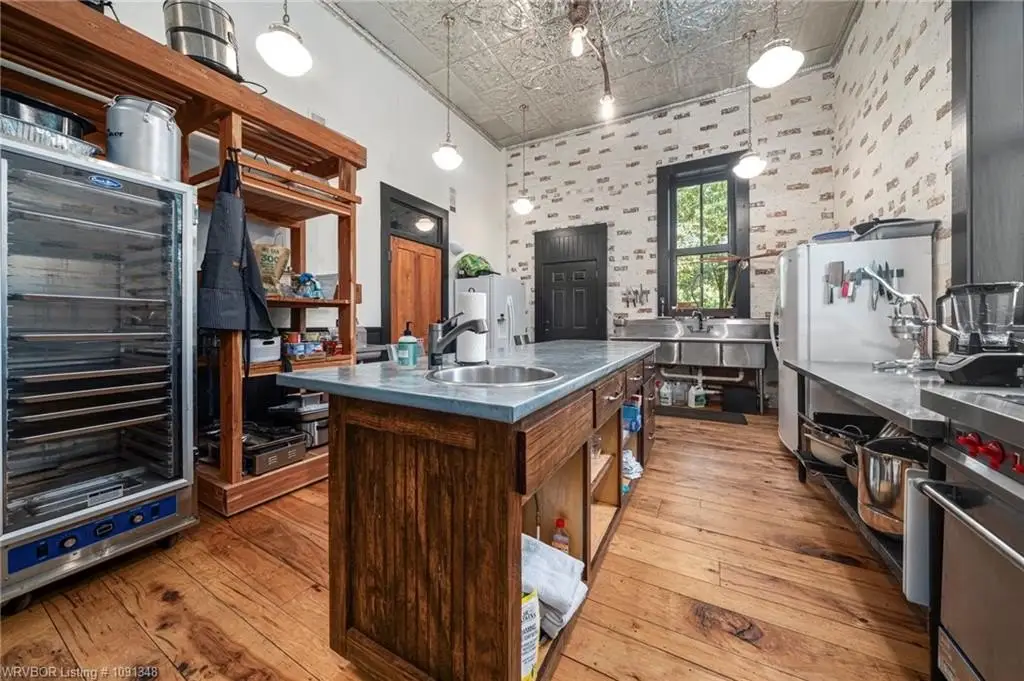
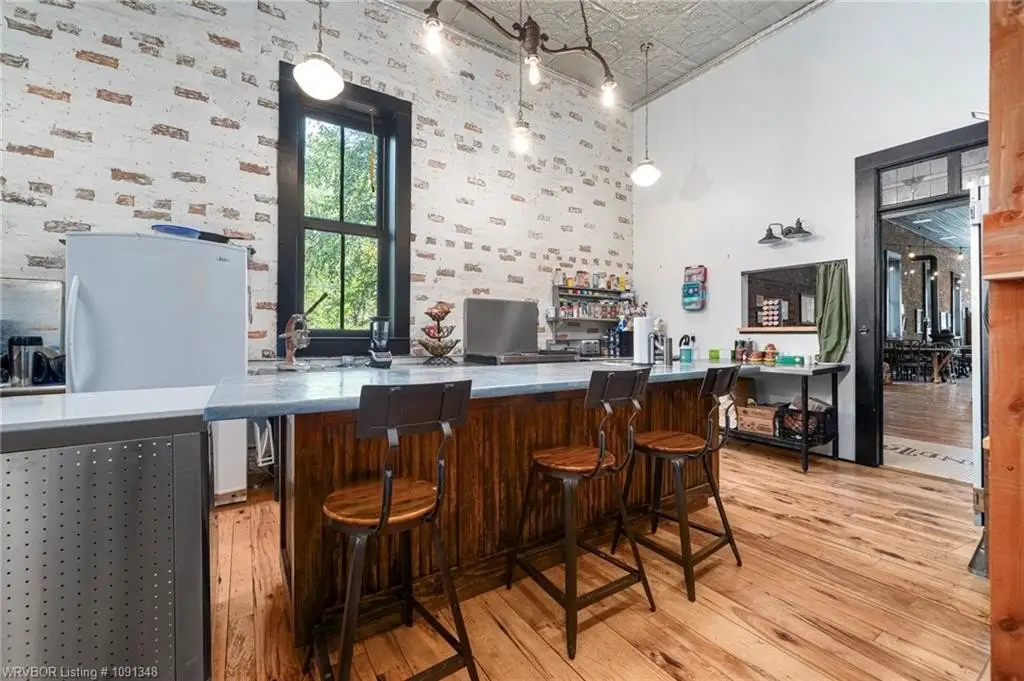
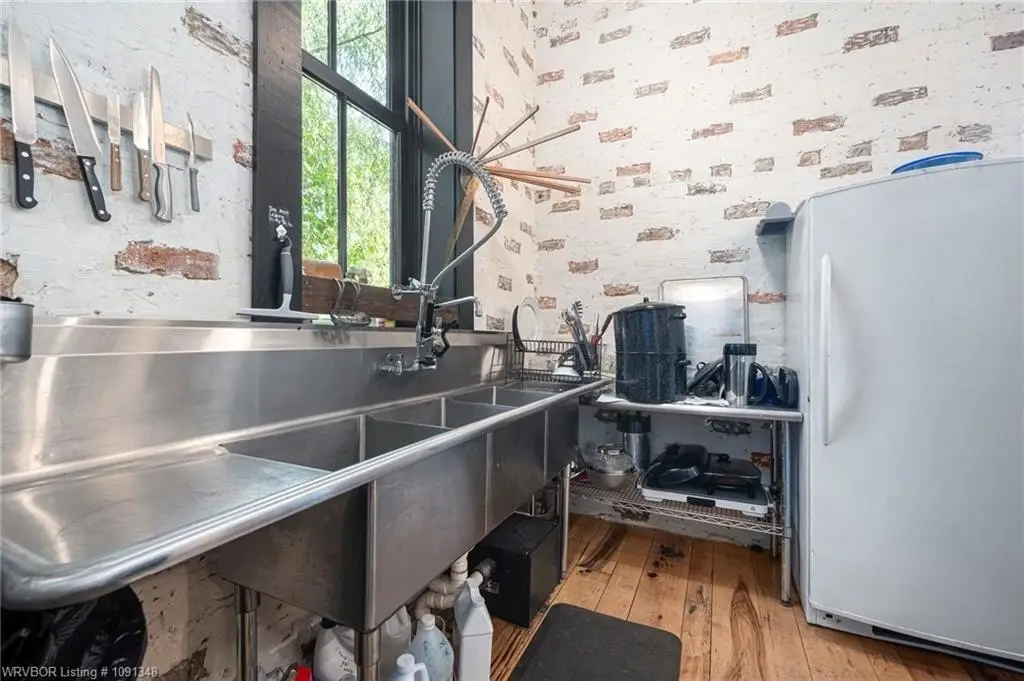
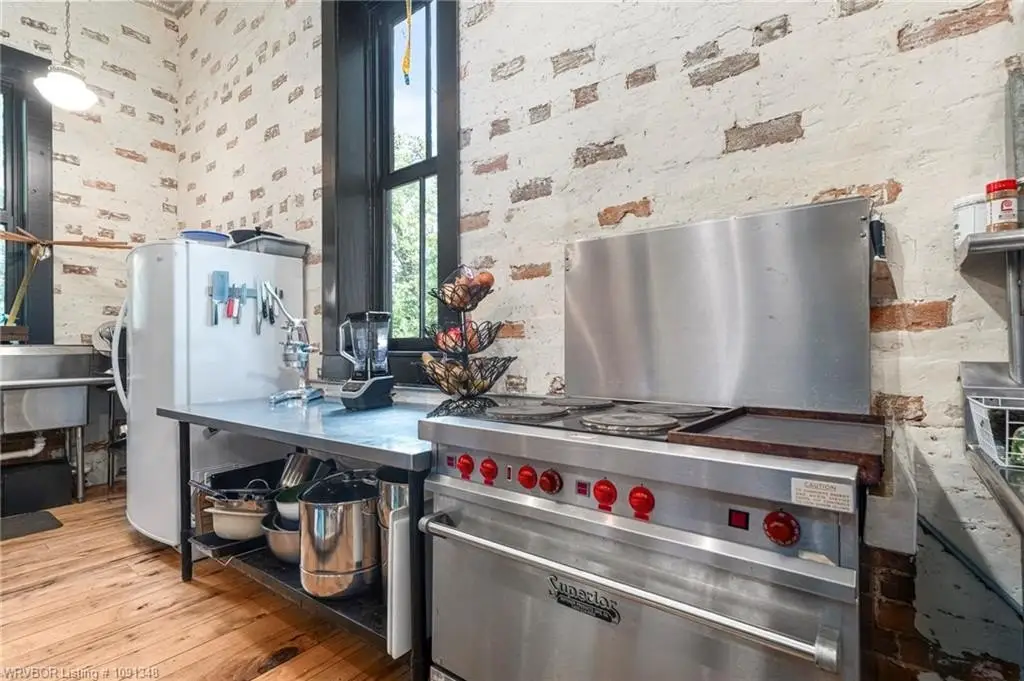
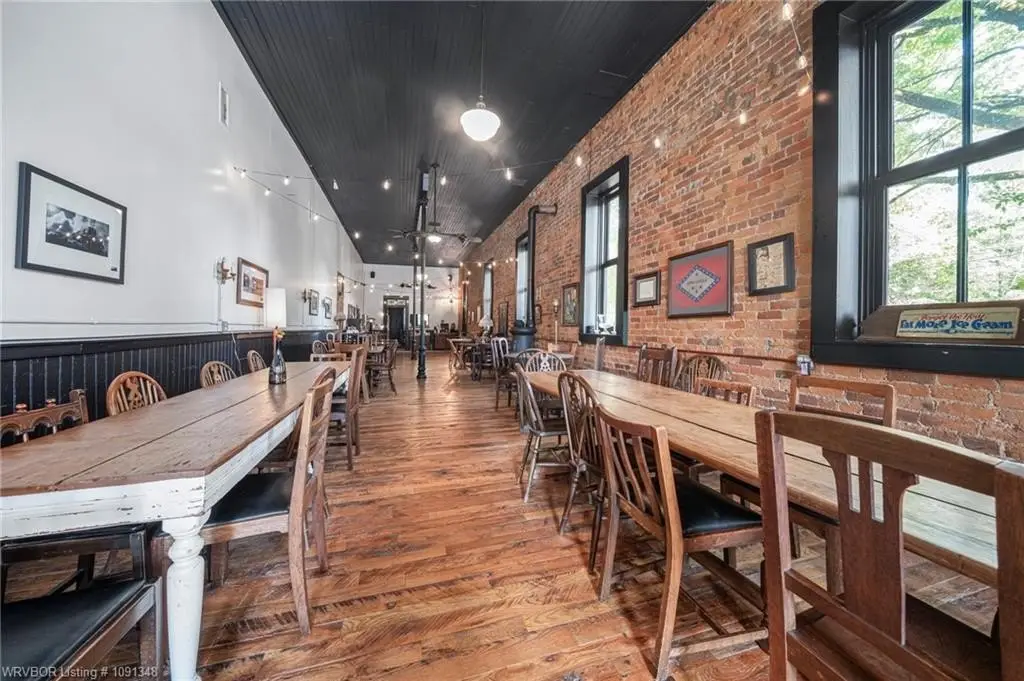
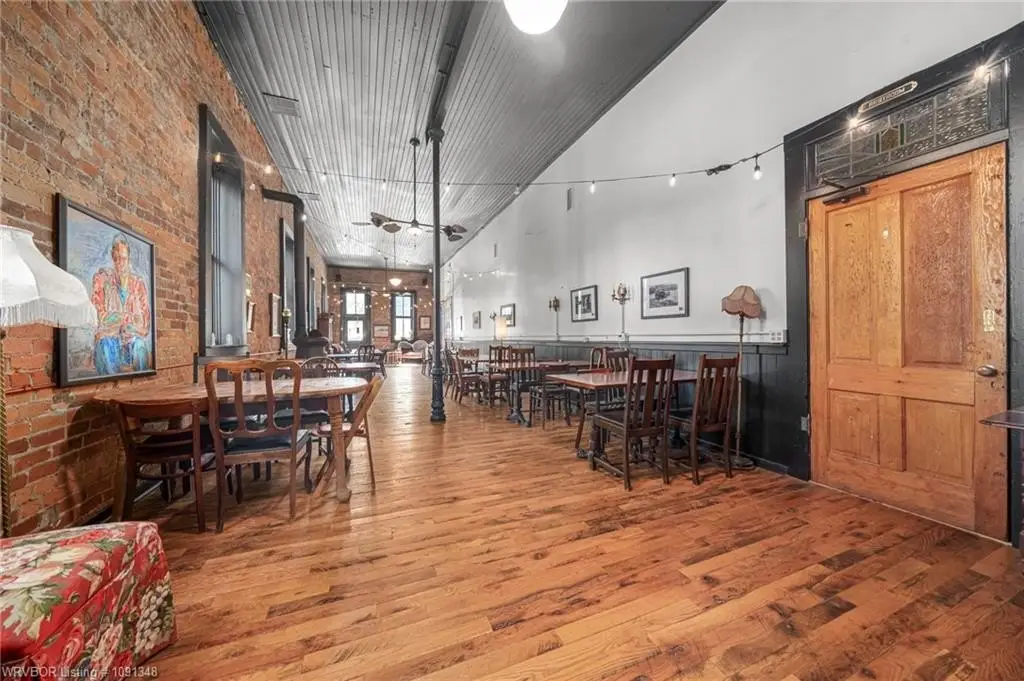
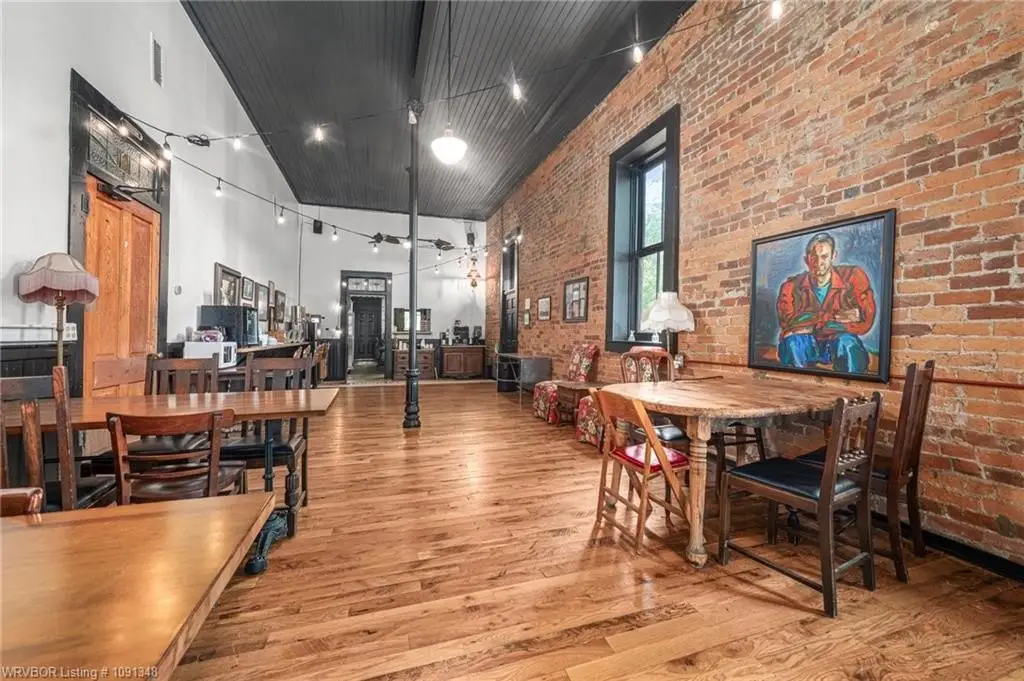
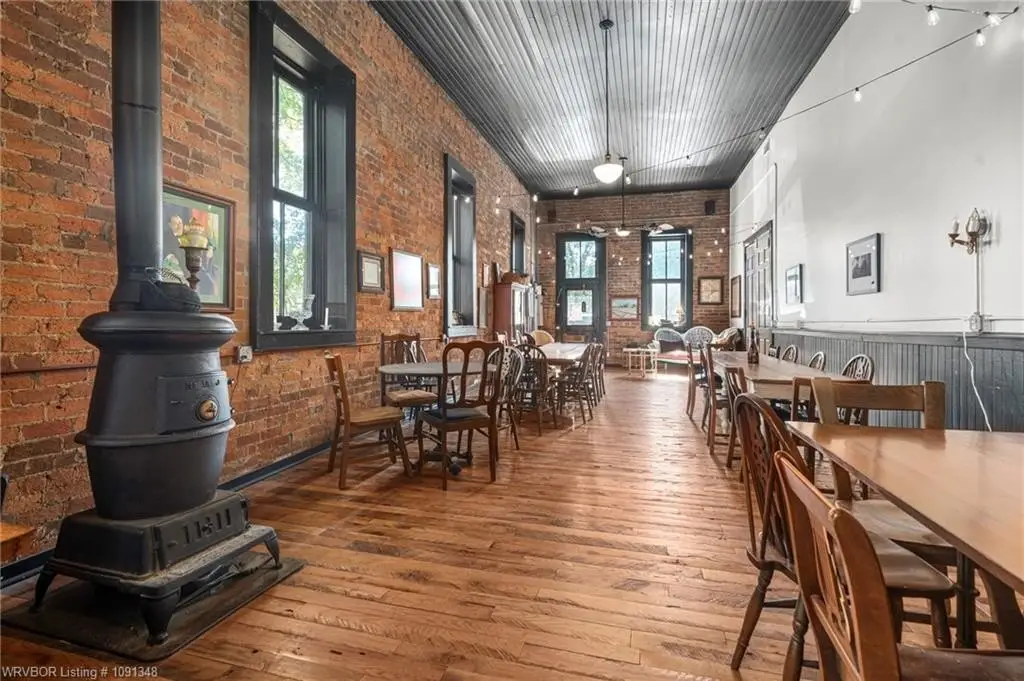
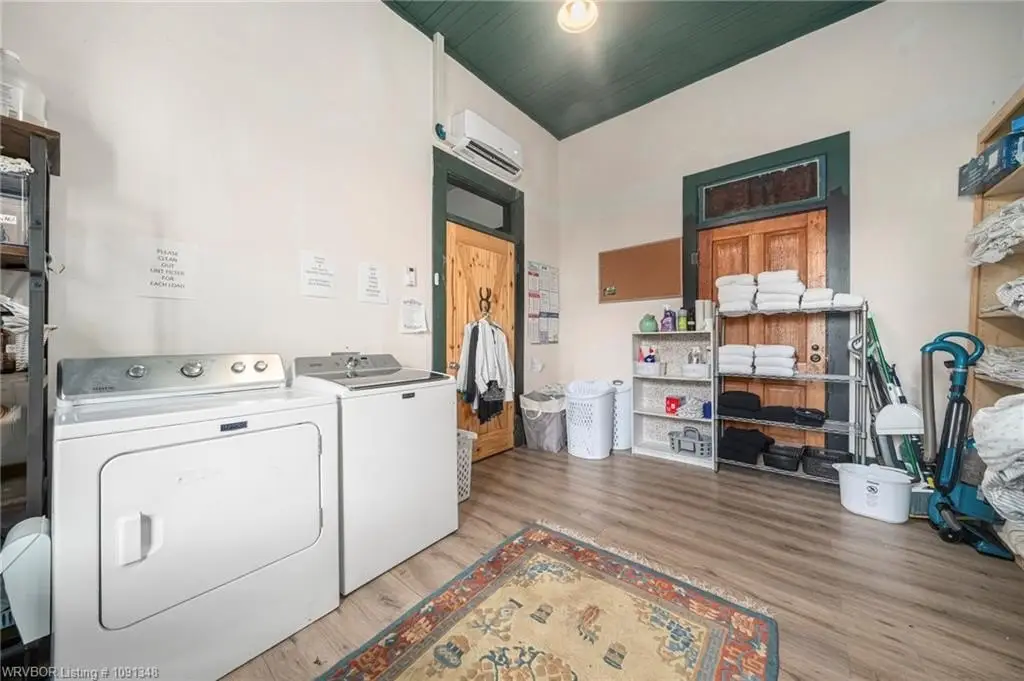
Commercial amenities include an on-site retail and gathering space with a stage and substantial seating, along with a lower-level commercial kitchen, dining hall, and wood-burning stove. Building systems include a new roof, insulated walls, updated HVAC with mini-splits, modern electrical service, new hot water heaters, and integrated dehumidifiers. Exterior features include a large patio, gardens, natural fencing, a stream with a covered bridge, parking, RV hookups, and approximately a quarter acre of undeveloped open ground.
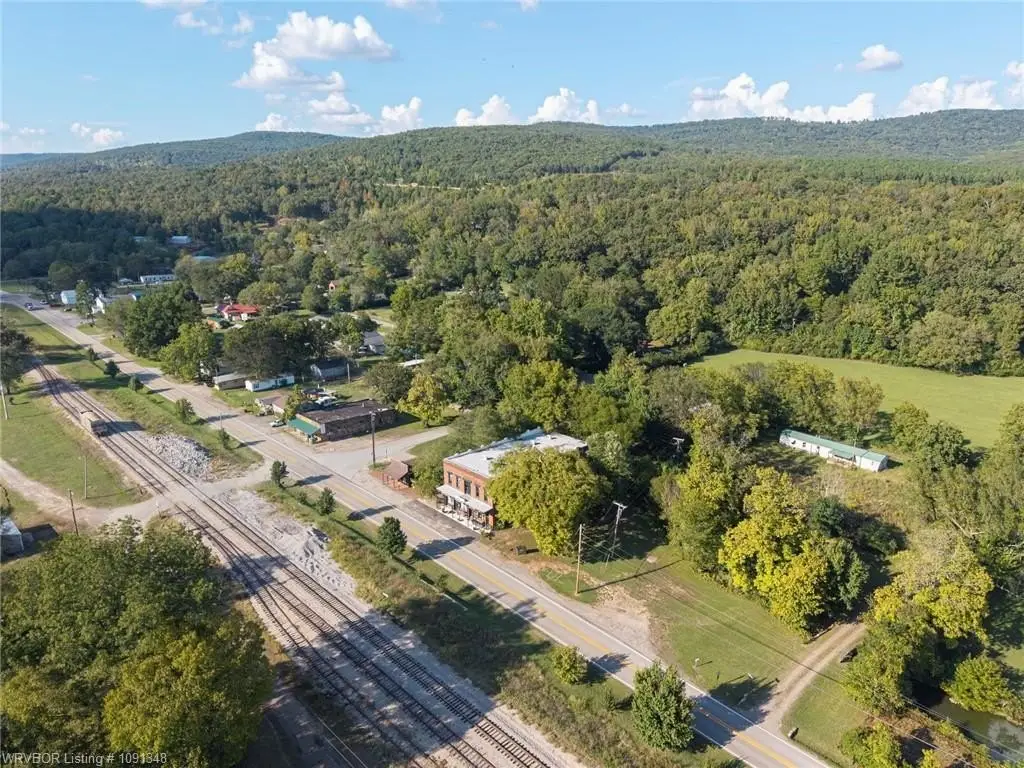
The property has operated as both nightly lodging and a whole-property event venue, hosting weddings, festivals, reunions, train excursions, murder mystery weekends, and interactive theater. It is located just over half a mile from I-49 and within thirty minutes of Fort Smith and Fayetteville.
Commercial amenities include an on-site retail and gathering space with a stage and substantial seating, along with a lower-level commercial kitchen, dining hall, and wood-burning stove. Building systems include a new roof, insulated walls, updated HVAC with mini-splits, modern electrical service, new hot water heaters, and integrated dehumidifiers. Exterior features include a large patio, gardens, natural fencing, a stream with a covered bridge, parking, RV hookups, and approximately a quarter acre of undeveloped open ground.
The property has operated as both nightly lodging and a whole-property event venue, hosting weddings, festivals, reunions, train excursions, murder mystery weekends, and interactive theater. It is located just over half a mile from I-49 and within thirty minutes of Fort Smith and Fayetteville.
Key Highlights
- 9,600‑square‑foot building constructed in 1887 and listed on the National Register of Historic Places since 1974
- Eleven guest rooms, including two luxury suites; one suite has a kitchenette and a clawfoot tub
- Commercial kitchen, dining hall, wood‑burning stove, stage, and large seating area
Financial Insights
Estimated NOI and Cap Rate
NOI / Yr
$60,192
Cap Rate
6.70%
Suggested Prices Based on Cap Rates
Cap Rate 5%
$1,203,840
$1.2M
Cap Rate 7%
$859,886
$859.9K
Cap Rate 9%
$668,800
$668.8K
Market Conditions
NOI Build-Up for 9,600 SF
Gross rent
$144.0K $15.00/SF
− Vacancy
−$17.3K −$1.80/SF
EGI
$126.7K $13.20/SF
− OpEx
−$66.5K −$6.93/SF
NOI
$60.2K $6.27/SF
Area
Crawford County, AR
Vacancy
12.00%
Lease Rate
$15.00 /SF/Yr
Expense Ratio
52.50%
Simulate Cap Rate and NOI
Suggested Prices Based on Cap Rates
Cap Rate 5%
$1,203,840
Cap Rate 7%
$859,886
Cap Rate 9%
$668,800
Alternative Uses
Best Use
Retail
$1.18M
$1.04M – $1.38M
NOI $82,850 @ 7.0% cap · market cap 9.22%
Second Best
Hotel Hospitality
$859.9K
$752.4K – $1.00M
NOI $60,192 @ 7.0% cap · market cap 6.70%
Theoretical Best
Office A
$1.84M
$1.61M – $2.15M
NOI $128,840 @ 7.0% cap · market cap 14.33%
Zoning and permitted uses should be independently verified with authorities.
How Realmo checks its estimates
Property Analytics
Unlock full access to Insights
Subscribe to Realmo Intelligence
Open Analytics
Current Use
Location Intelligence
Trade Area within ½ mile
21
Businesses Nearby
Well-served
Demand for This Use
Explore this area
Business Placement
Demographics for 72934, AR
942
Population
379
Households
2.5
Avg Household Size
40
Median Age
18%
College-Educated
57%
High-School Grad
71.0 sq mi
ZIP Area
13
Density / Sq Mi
$71,009
Median Earnings
$636
Median Rent
Check the figures for this property
Cap Rate, Value Estimation, Potential NOI and more
View Realmo Analytics
Market
Vacancy Rate% for Retail in South region
Frequently Asked Questions
What type of property is this?
Bed & breakfast - National Register recognition, updated systems, and flexible gathering areas support lodging, retail, and private events.
Where is this bed & breakfast located?
The property is located at 411 E Front AVE Chester, AR.
What is the asking price?
The asking price for this property is $899,000.
What are key features of this property?
This property features: 9,600‑square‑foot building constructed in 1887 and listed on the National Register of Historic Places since 1974; Eleven guest rooms, including two luxury suites; one suite has a kitchenette and a clawfoot tub; Commercial kitchen, dining hall, wood‑burning stove, stage, and large seating area


