Updated Brick
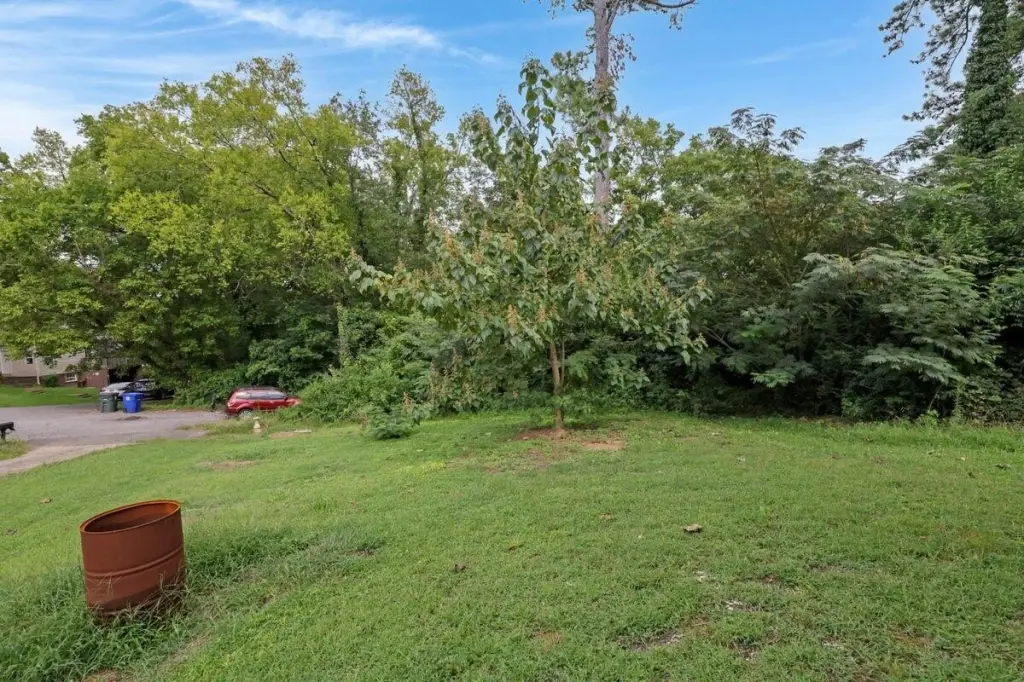
For Sale
$293,000
Pending
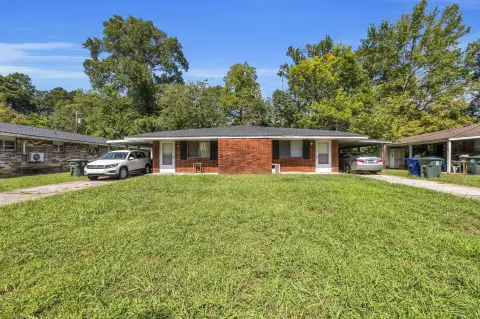
4107 Cherryton Drive, Chattanooga, TN 37411
Residential Income, Chattanooga, TN
Property Size1,940 SF
Lot Size0.25 Acres
Days on Market51
Property Features for 4107 Cherryton Drive
General Information
Property type
Residential Multi Family
Property subtype
Duplex
Bedrooms
4
Bathrooms
2
Full bathrooms
2
Rooms
Bedroom 3, Bathroom 1, Bathroom 2, Bedroom 4, Basement, Bedroom 1, Bedroom 2
Parking features
Off Street, Garage, Open
Window features
Screens, Vinyl Frames, Double Pane Windows
Patio and Porch features
Porch
Interior features
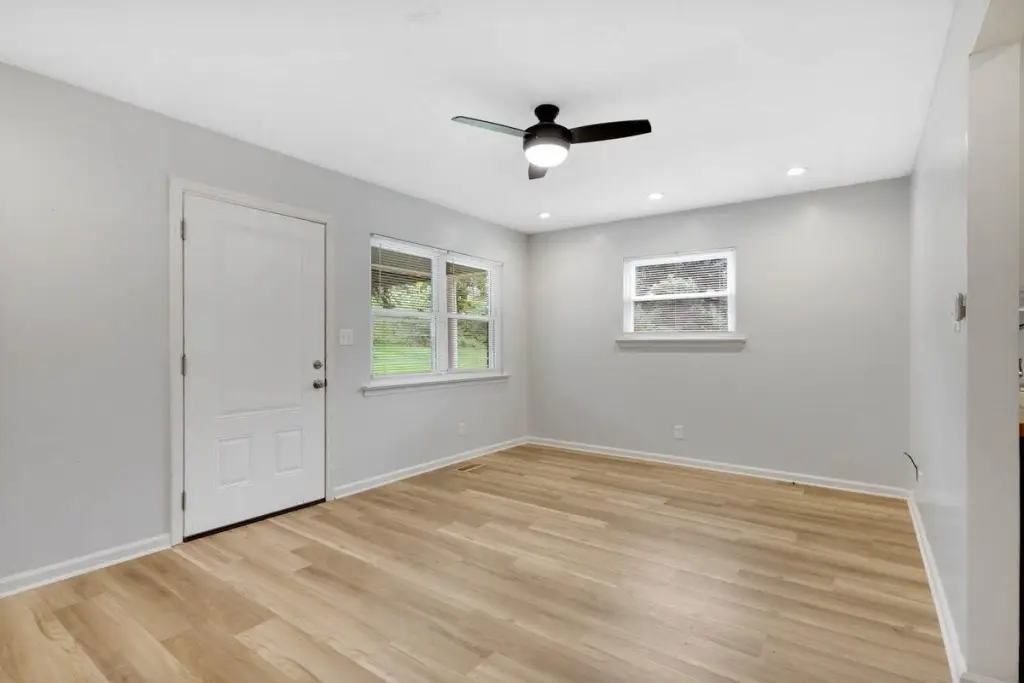
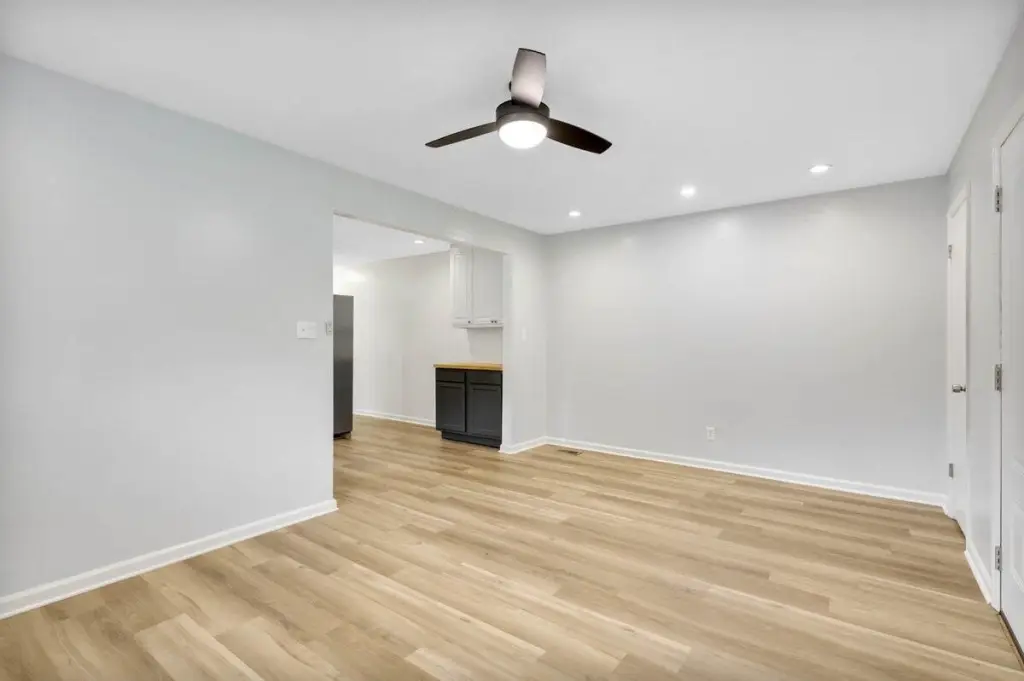
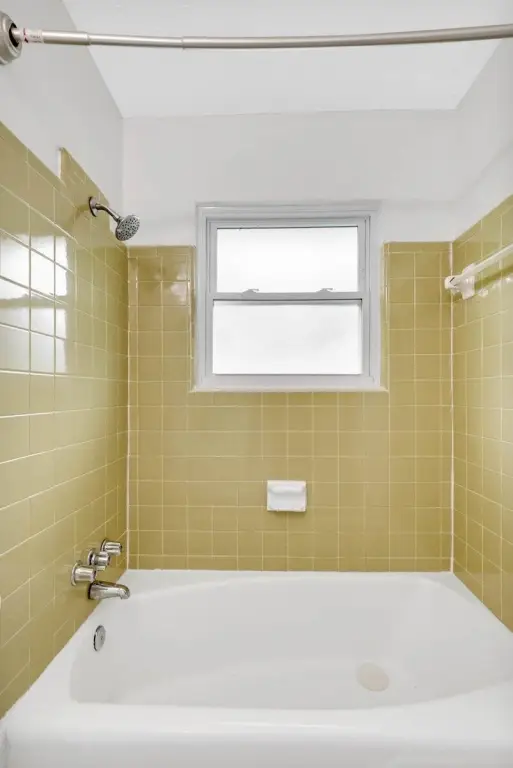
Ceiling Fan(s), Recessed Lighting, Storage, Tub/shower Combo
Exterior features
Uncovered Courtyard
Basement
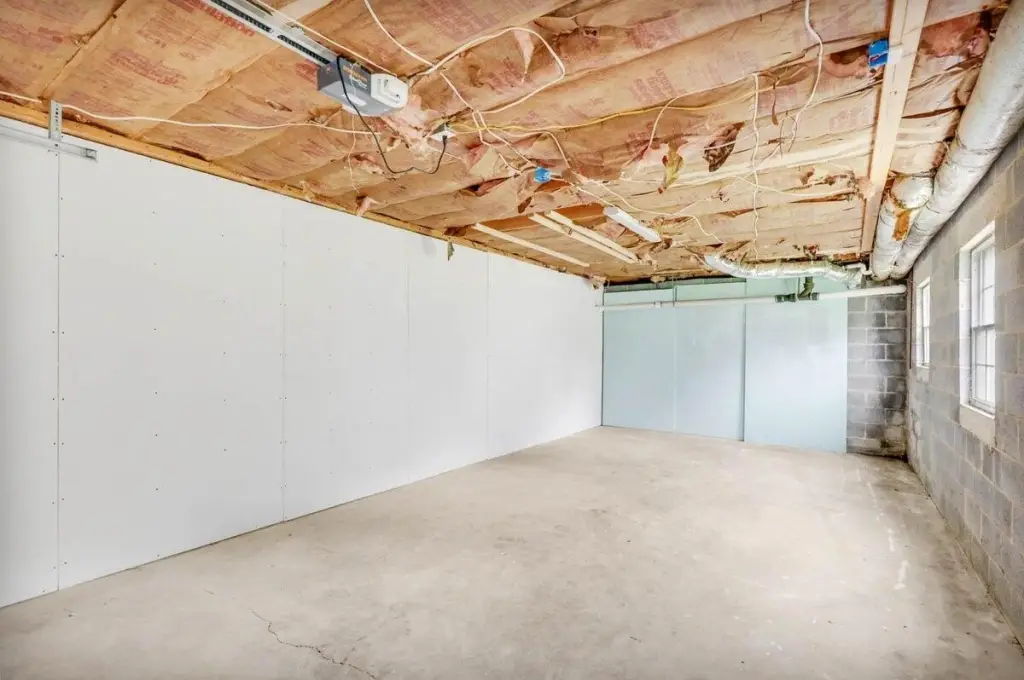
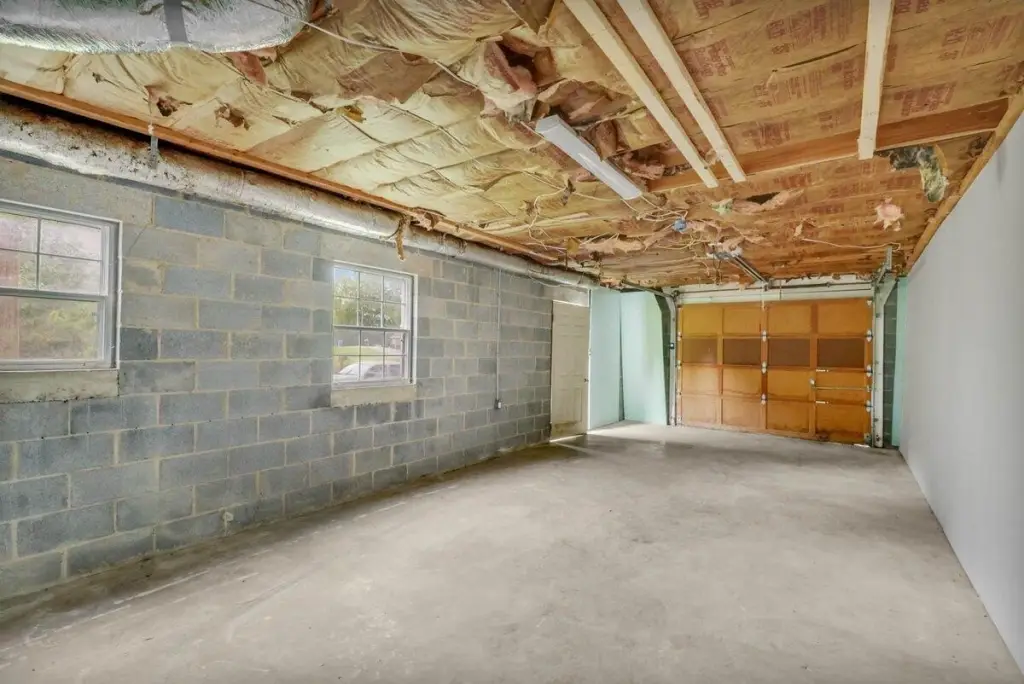
Full, Unfinished
Appliances
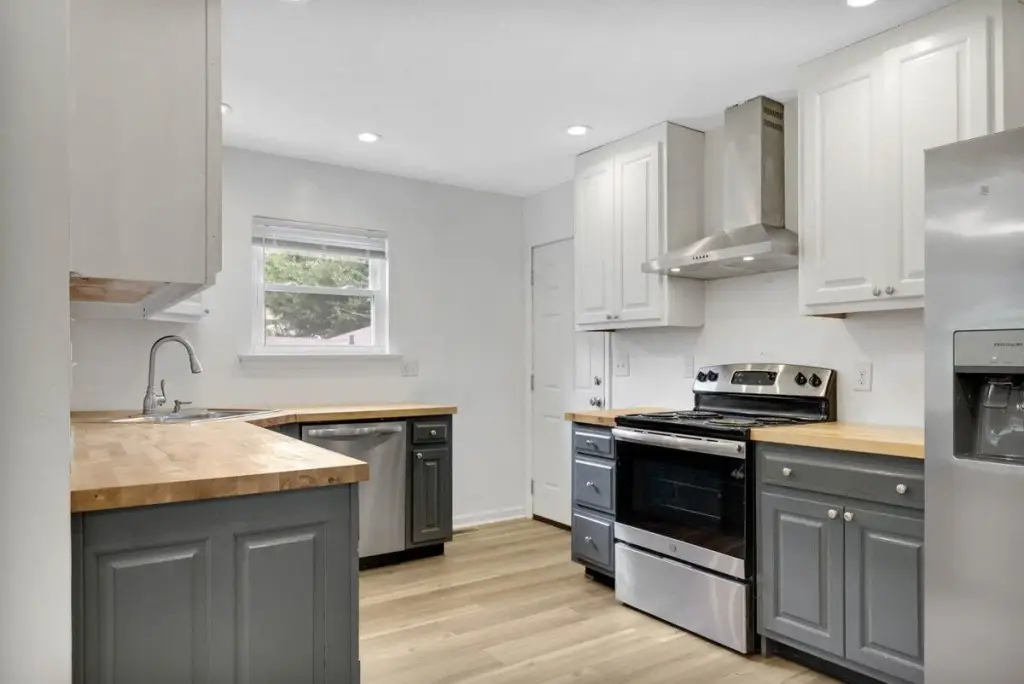
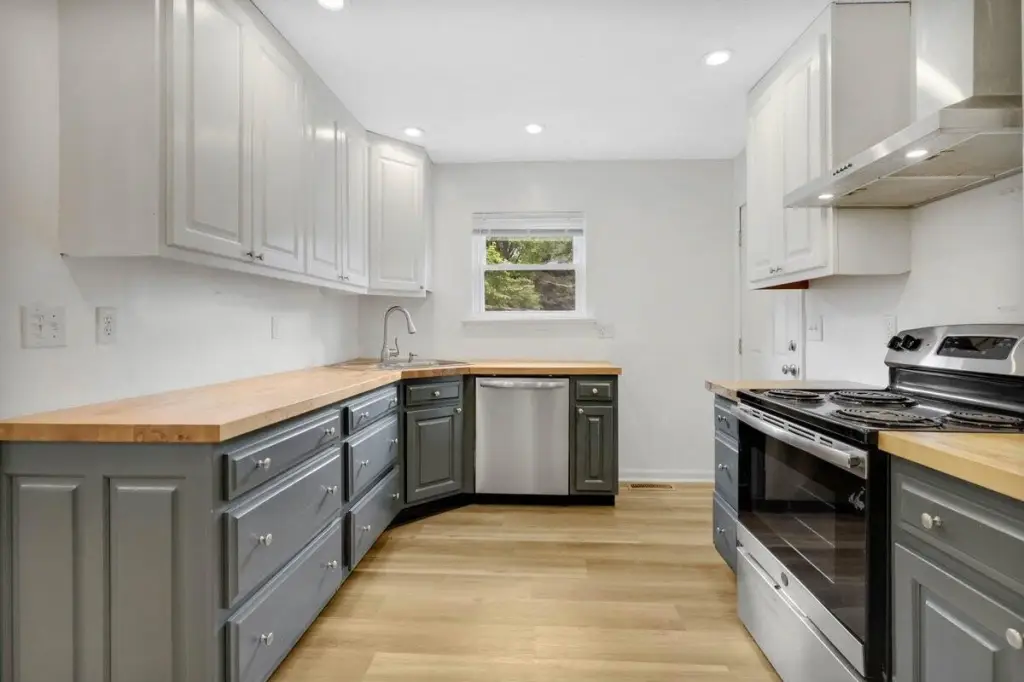
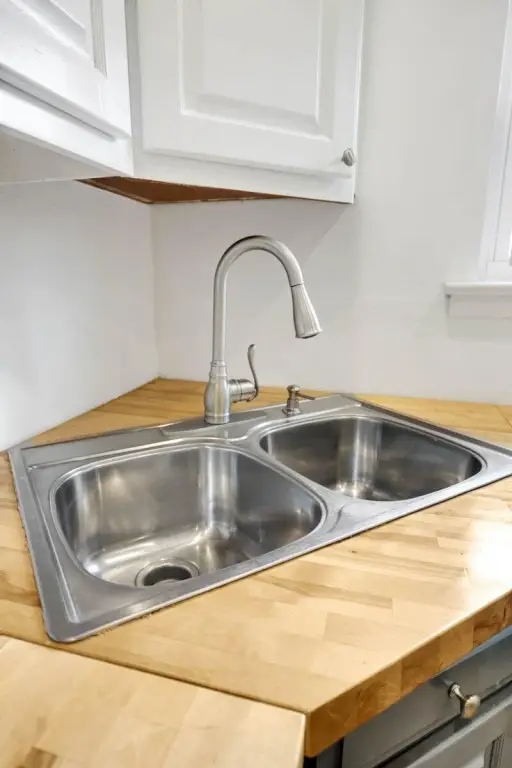
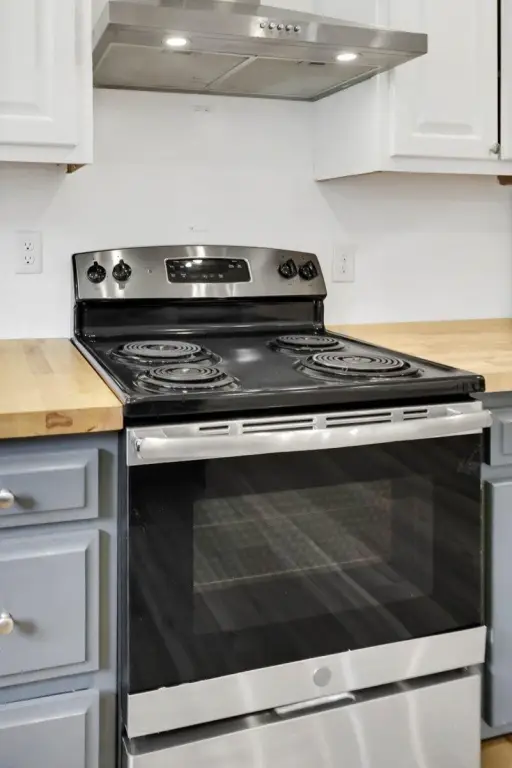
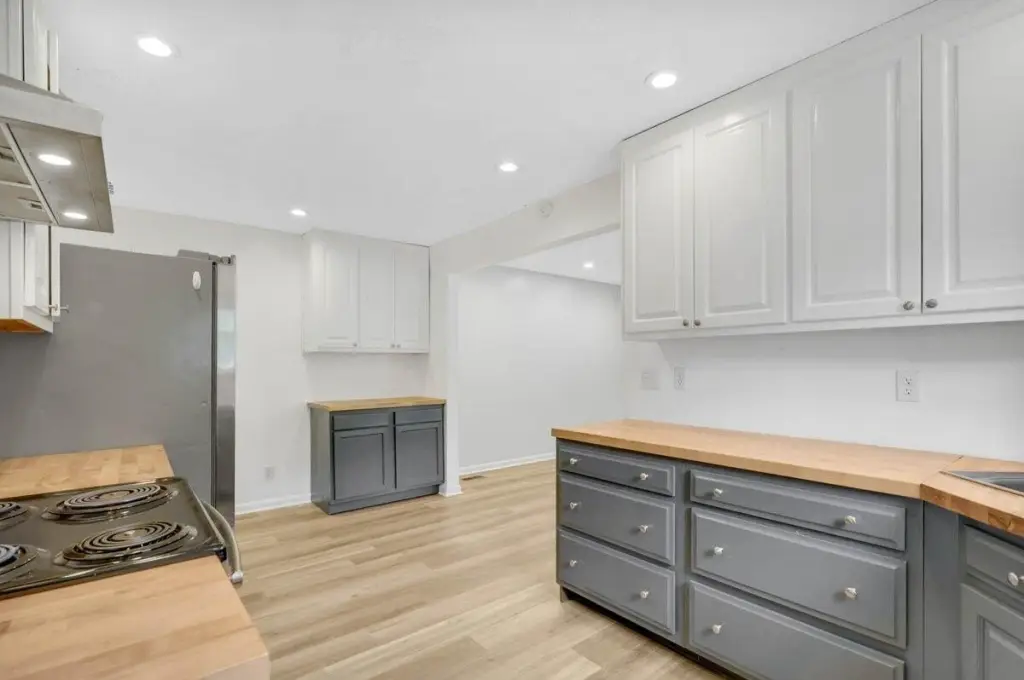
Refrigerator, Range Hood, Free-Standing Electric Range, Electric Water Heater, Dishwasher
Subdivision
Gillespe Terr
Lot features
Back Yard, Front Yard, Gentle Sloping, Landscaped, Sloped, Sloped Down
Elementary school
Barger Academy of Fine Arts
Middle school
Brown Middle
High school
Brainerd High
Directions
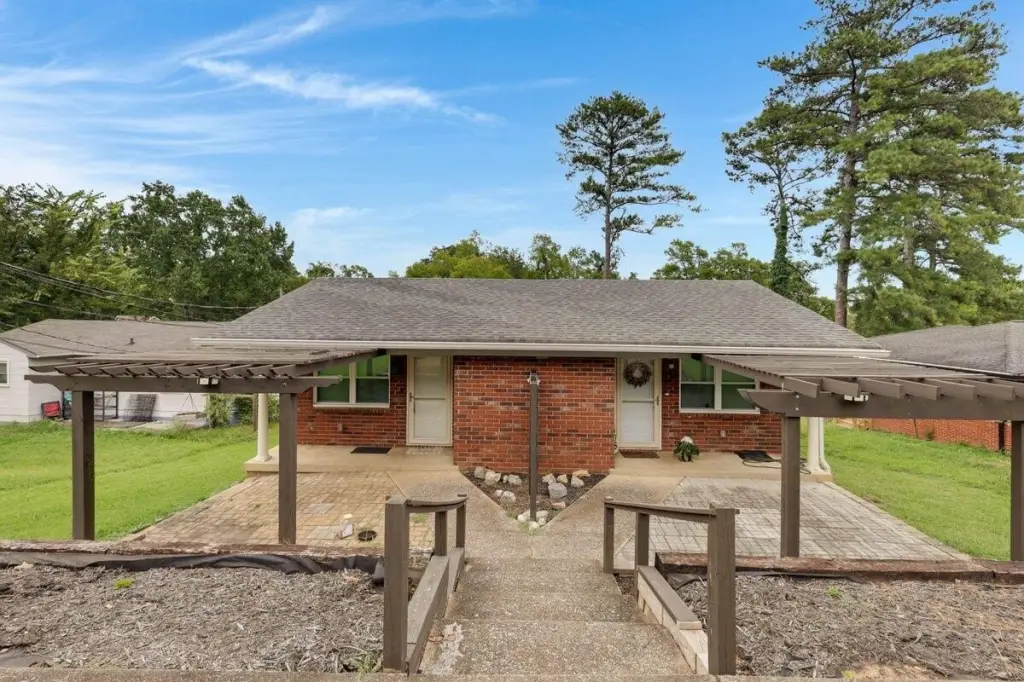
[From Downtown]: Take US-27 S to I-24 E Take S. Terrace in East Ridge. Take Exit 183 continue on S. Terrace. Left onto Belvoir Ave, Right on Brainerd Rd,, Left onto Cherryton Dr., Property on Right. Unit B is the right-side unit.
Standard status
Pending
APN
157g D 024
Size
1,940 SF
Lot size
0.25 Acres
Taxes and HOA fees
Tax Description
Lt 11 Blk 6 Gillespie Terr Pb 11 Pg 22
Tax Annual Amount
3341
Legal Description
Lt 11 Blk 6 Gillespie Terr Pb 11 Pg 22
Utilities
Sewer type
Public Sewer
Heating system
Central, Electric (Heating)
Cooling system
Electric, Central Air
Water source
Public
Amenities
front porch
basement
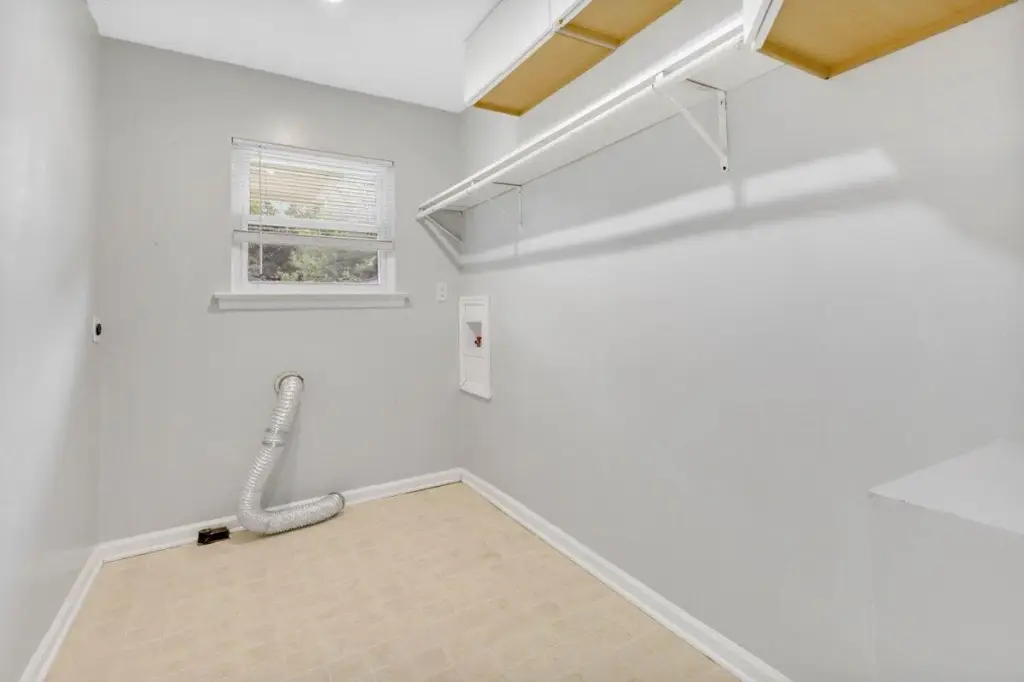
laundry rooms
Building Details
Year built
1966
Floors in Building
1
Number of units
2
Flooring type
Carpet, Vinyl, Tile
Building materials
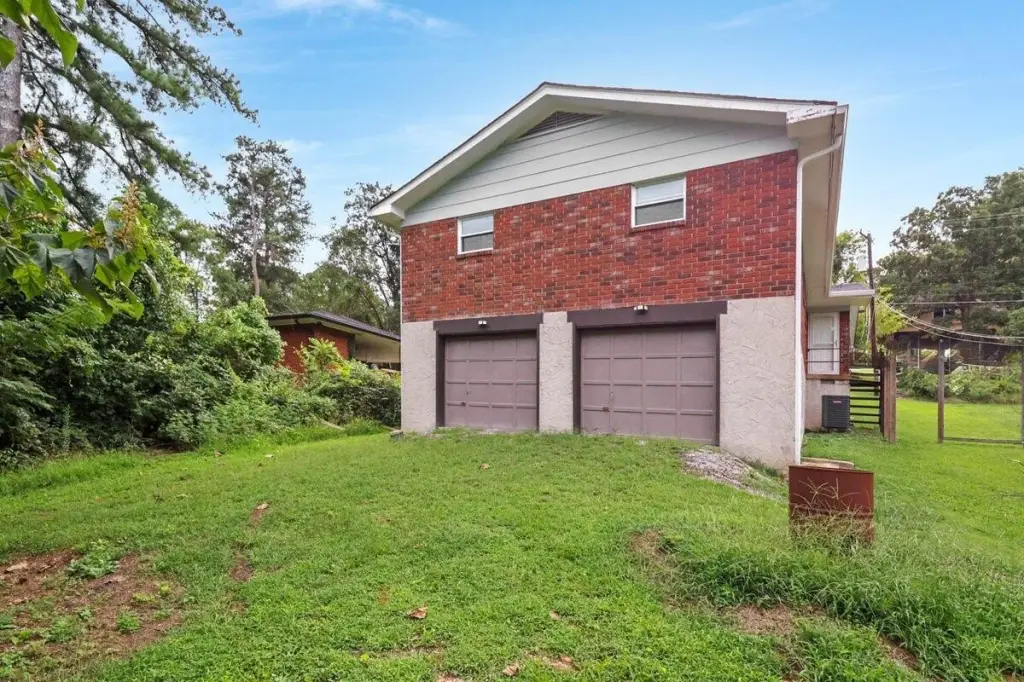
Block, Brick
Roof type
Shingle, Asphalt
Additional Structures
Pergola, Storage
Listing Agency:
Real Broker
(423) 665-7777
Listed By:
Brian Kelly · License #258290
(423) 818-9959
Added: Aug 24
Changed: Oct 8
Last Checked: Oct 13 at 10:06PM
MLS# 1541413
Copyright © 2026 Greater Chattanooga Association of REALTORS. All rights reserved. All information provided by the listing agent/broker is deemed reliable but is not guaranteed and should be independently verified.
Investment Insights
Based on property information with market context.
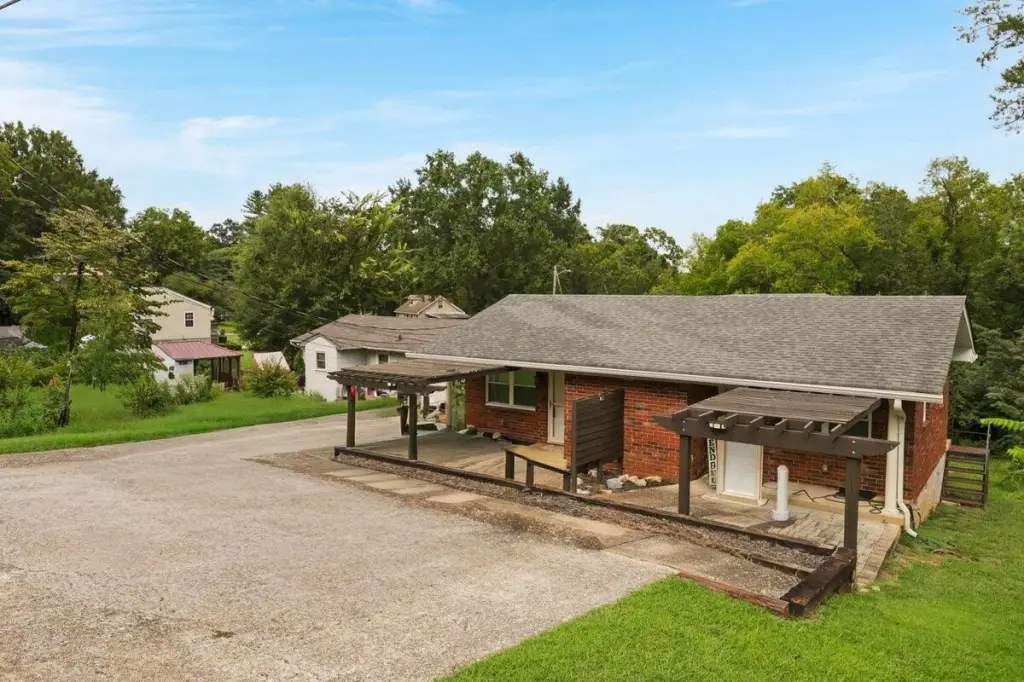
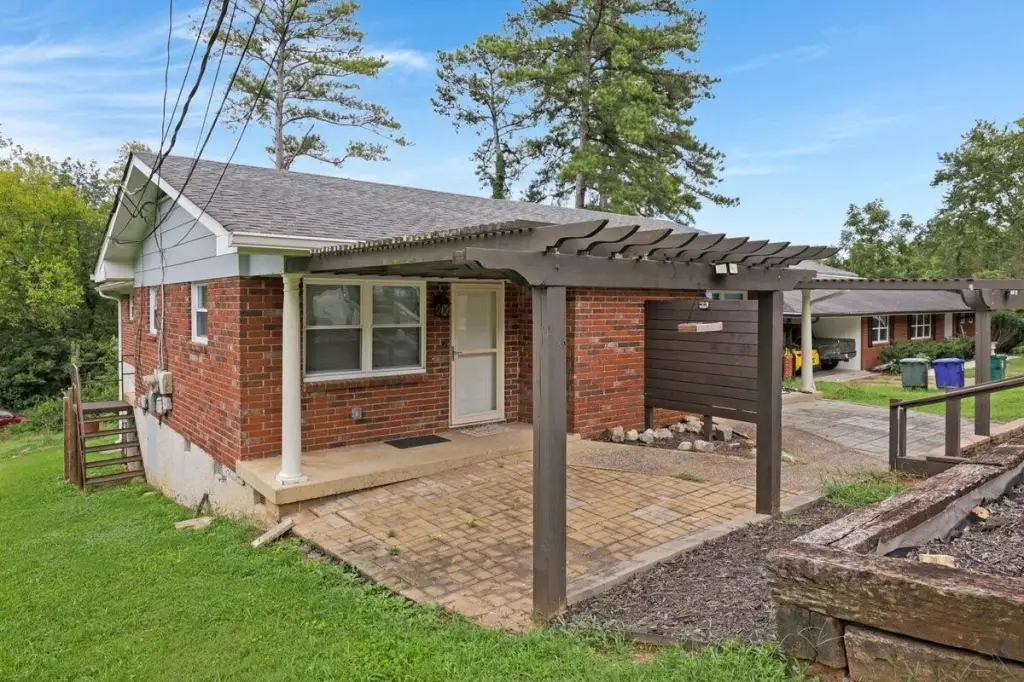
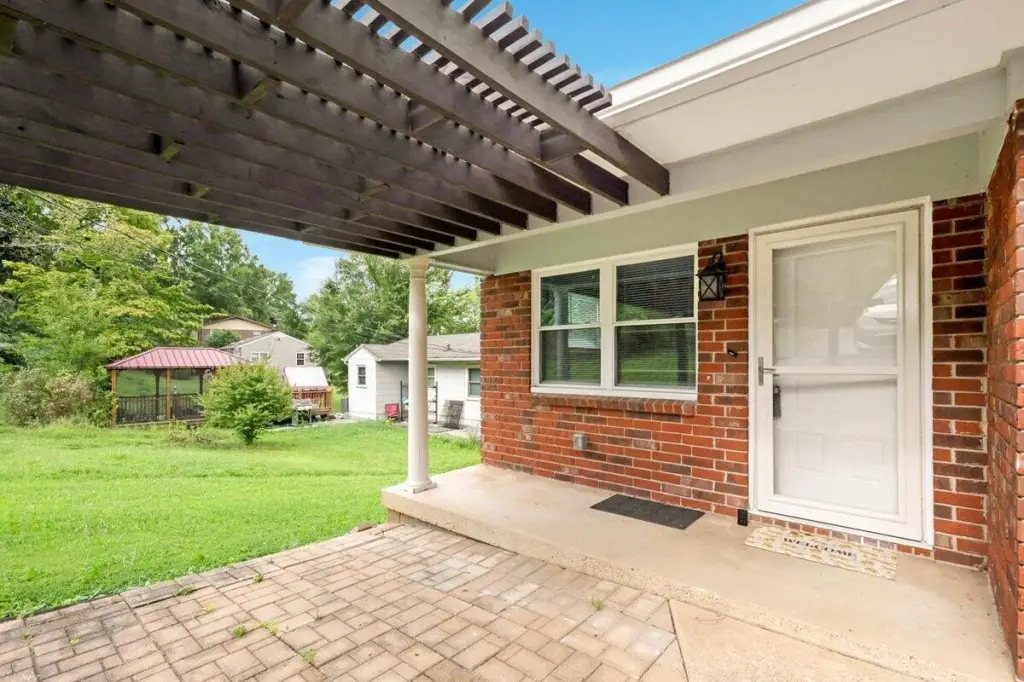
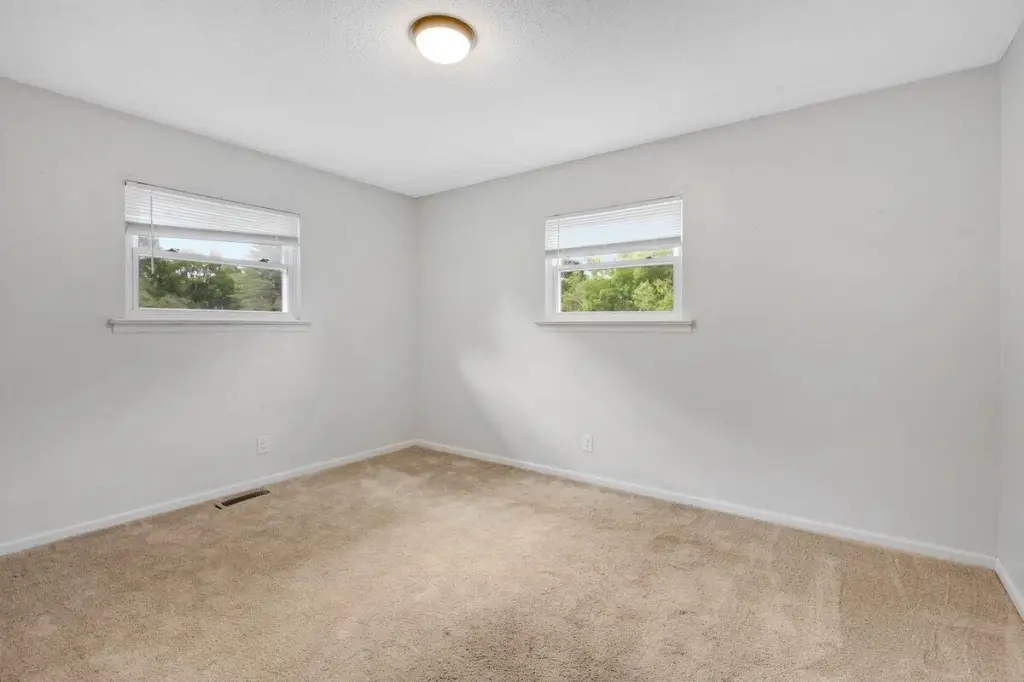
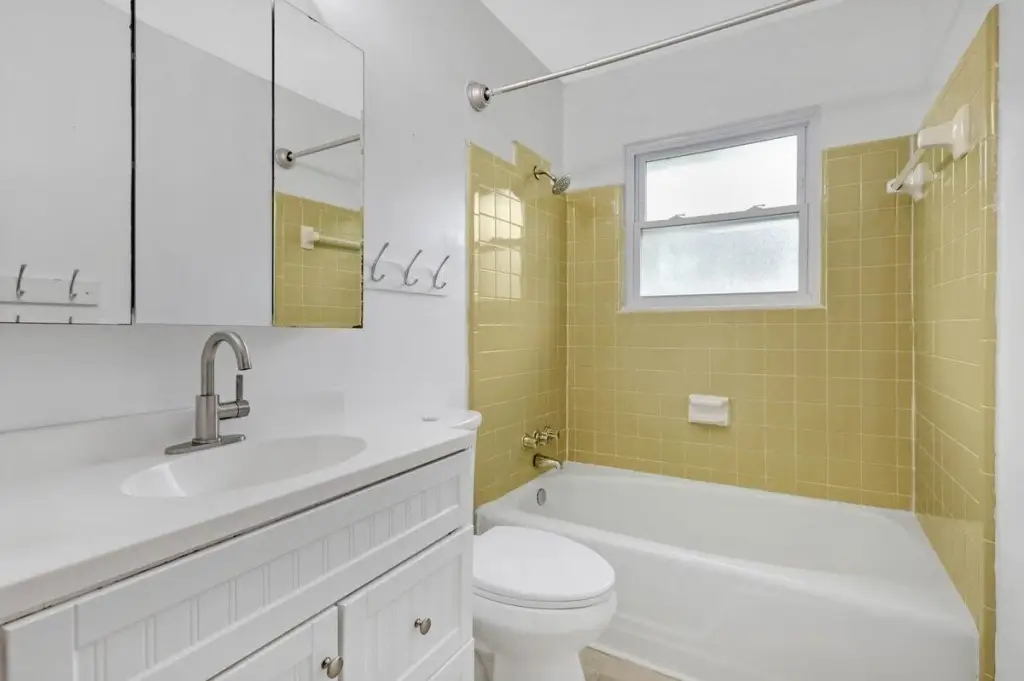
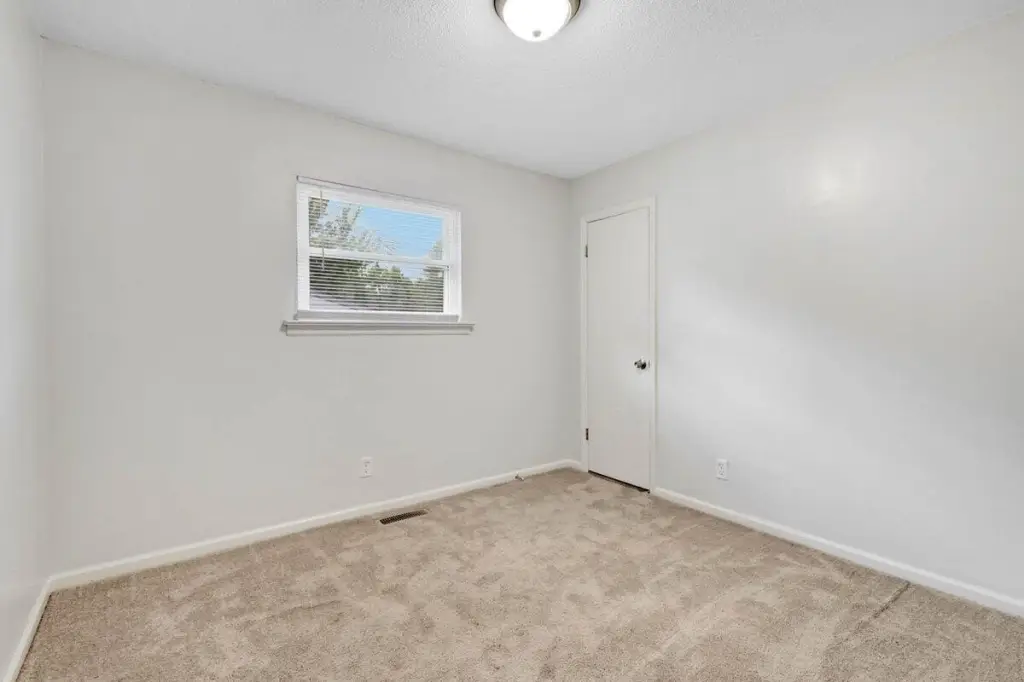
This 1,940-square-foot duplex contains two approximately 950-square-foot units, each arranged with two bedrooms and one bathroom. Both residences feature updated kitchens with stainless steel appliances, dishwashers, new LVP and carpet flooring, large laundry rooms with hookups, storage, and front porches. Brick construction, newer windows, updated electrical, gutters, asphalt shingle roofing, and central electric heating and cooling are among the property improvements.
The 0.25-acre parcel sits on a low-traffic, single-family street in Brainerd, with additional rear road frontage. An unfinished basement and utility garage provide storage space and include open, garage, and off-street parking features. Public water and public sewer serve the property. Built in 1966, the duplex is located in Chattanooga, TN 37411.
The 0.25-acre parcel sits on a low-traffic, single-family street in Brainerd, with additional rear road frontage. An unfinished basement and utility garage provide storage space and include open, garage, and off-street parking features. Public water and public sewer serve the property. Built in 1966, the duplex is located in Chattanooga, TN 37411.
Key Highlights
- Two‑unit duplex with 1,940 square feet total
- Each unit offers approximately 950 square feet with 2 bedrooms and 1 bathroom
- 0.25‑acre lot with additional rear road frontage
Financial Insights
Estimated NOI and Cap Rate
NOI / Yr
$19,046
Cap Rate
6.50%
Suggested Prices Based on Cap Rates
Cap Rate 5%
$380,920
$380.9K
Cap Rate 7%
$272,086
$272.1K
Cap Rate 9%
$211,622
$211.6K
Market Conditions
NOI Build-Up for 1,940 SF
Gross rent
$29.1K $15.00/SF
− Vacancy
−$1.9K −$0.98/SF
EGI
$27.2K $14.03/SF
− OpEx
−$8.2K −$4.21/SF
NOI
$19.0K $9.82/SF
Area
Chattanooga, TN
Vacancy
6.50%
Lease Rate
$15.00 /SF/Yr
Expense Ratio
30.00%
Simulate Cap Rate and NOI
Suggested Prices Based on Cap Rates
Cap Rate 5%
$380,920
Cap Rate 7%
$272,086
Cap Rate 9%
$211,622
Alternative Uses
Best Use
Multifamily LT 5
$272.1K
$238.1K – $317.4K
NOI $19,046 @ 7.0% cap · market cap 6.50%
Second Best
Apartment 5plus
$244.2K
$213.6K – $284.9K
NOI $17,091 @ 7.0% cap · market cap 5.83%
Theoretical Best
Office A
$428.5K
$374.9K – $499.9K
NOI $29,992 @ 7.0% cap · market cap 10.24%
Zoning and permitted uses should be independently verified with authorities.
How Realmo checks its estimates
Property Analytics
Unlock full access to Insights
Subscribe to Realmo Intelligence
Open Analytics
Current Use
Lease Details
2
Residential units
Yes
Paved road access
Location Intelligence
Trade Area within ½ mile
515
Businesses Nearby
Explore this area
Business Placement
Demographics for 37411, TN
17,499
Population
8,807
Households
2
Avg Household Size
40
Median Age
29%
College-Educated
90%
High-School Grad
7.3 sq mi
ZIP Area
2,397
Density / Sq Mi
$50,180
Median Household Income
$34,045
Median Earnings
$1,031
Median Rent
$216,800
Median Home Value
Check the figures for this property
Cap Rate, Value Estimation, Potential NOI and more
View Realmo Analytics
Market
Vacancy Rate% for Multifamily in South region

Questions? Ask Rey
Realmo’s AI knows this listing — price, zoning, demand, history. Ask anything.
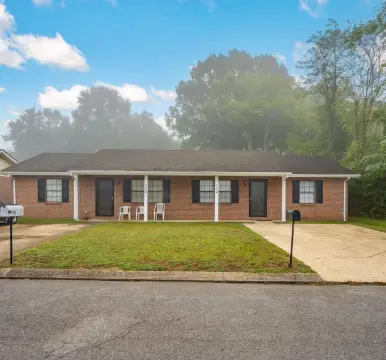
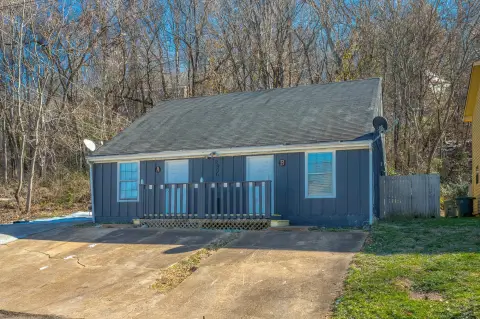

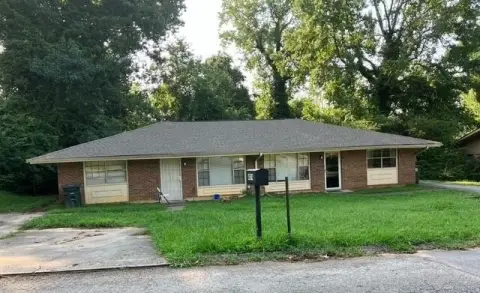




Frequently Asked Questions
What type of property is this?
Duplex - Two-bedroom units feature refreshed interiors, private laundry hookups, porches, storage, and designated parking.
Where is this duplex located?
The property is located at 4107 Cherryton Drive Chattanooga, TN.
What is the asking price?
The asking price for this property is $293,000.
What are key features of this property?
This property features: Two‑unit duplex with 1,940 square feet total; Each unit offers approximately 950 square feet with 2 bedrooms and 1 bathroom; 0.25‑acre lot with additional rear road frontage