Turnkey Restaurant with Office
For Lease
Contact for pricing
410 Utica Ave, Brooklyn, NY 11213
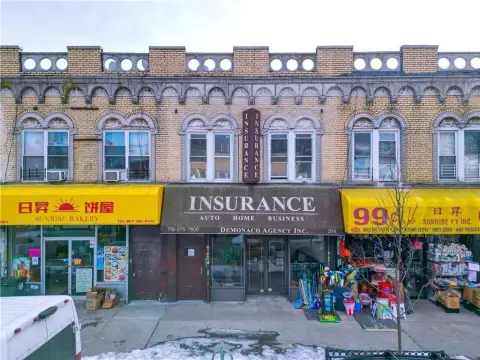
Three-unit building with separate electric meters, first-floor restaurant, and two second-floor offices; delivered vacant.
Space Size1,500 SF
Days on Market237
Property Features for 410 Utica Ave
General Information
Standard status
Active
Size
1,500 SF
Property subtype
RETAIL
Spaces For Lease
at 410 Utica Ave
1,500 SF | 410 Utica Avenue | Vented Former Restaurant with Full Basement for Lease
AVAILABLE
Size
1,500 SF
Type
RETAIL
Rate
Contact for pricing
Former German's Soup Restaurant
Vented with Gas
Full Basement
15 FT Hood
3-Compartment Sink
New Frontage
High Pedestrian & Car Traffic
Contact us
Listing Agency:
Tri State Commercial Realty
(718) 437-6100
Listed By:
Shlomi Bagdadi · License #10311204539
Source:
Moodyscre
Added: Mar 3
Changed: Oct 25
Last Checked: Oct 24 at 8:49PM
Displayed information is deemed reliable but is not guaranteed and should be independently verified. All listing content including descriptions, pricing, images are the copyrighted material of Tri State Commercial Realty

Ask AI about this property
Review the available facts, identify missing information and prepare questions for the agent.
Investment Insights
Based on property information with market context.
Turnkey restaurant on the first floor with a second floor configured as two separate offices. The property contains three commercial units, with gas and heat on for the Store, Front 1st Floor, and Back 1st Floor. Each unit has its own electrical meter, and the property is reported to have no open violations.
The building is located in Brooklyn’s Crown Heights neighborhood, between Montgomery St and Crown St, near the Crown Heights–Utica Ave subway station. Transit options include the 3, 5, 4, and 2 trains at Crown Heights–Utica Ave, plus the B46, B17, B12, and B46-SBS bus lines.
The lot measures 18 x 81, with building dimensions of 18 x 75, for a total of three commercial units.
The building is located in Brooklyn’s Crown Heights neighborhood, between Montgomery St and Crown St, near the Crown Heights–Utica Ave subway station. Transit options include the 3, 5, 4, and 2 trains at Crown Heights–Utica Ave, plus the B46, B17, B12, and B46-SBS bus lines.
The lot measures 18 x 81, with building dimensions of 18 x 75, for a total of three commercial units.
Key Highlights
- Turnkey 3‑unit building with a restaurant on the first floor and two separate offices on the second floor
- Three units have separate electric meters; gas and heat are on for Store, Front 1st Floor, and Back 1st Floor
- Delivered vacant; ready for new owner‑occupant or tenant
Property Analytics
Who owns this building?
See the owner, sales and loan history
Open Analytics
Current Use
Lease Details
NNN (Triple Net)
Lease Type
Location Intelligence
Trade Area within ½ mile
4,572
Businesses Nearby
Under-served
Demand for This Use
Explore this area
Business Placement
Demographics for 11213, NY
67,217
Population
29,186
Households
2.3
Avg Household Size
34
Median Age
34%
College-Educated
84%
High-School Grad
1.1 sq mi
ZIP Area
61,106
Density / Sq Mi
$62,040
Median Household Income
$43,736
Median Earnings
$1,607
Median Rent
$1,184,400
Median Home Value
Check the figures for this property
Cap Rate, Value Estimation, Potential NOI and more
View Realmo Analytics
Market
Lease Benchmarks for Brooklyn, NY
$44.29 /SF/Yr
Avg Asking Price
$22–$60 /SF/Yr
Price Range
1,940 SF
Avg Space Size
Vacancy Rate% for Office in Northeast region





Similar Off Market Nearby
- Fix-U-Plate — 1139 Clarkson Ave, Brooklyn, NY 11212
Frequently Asked Questions
What type of property is this?
Conventional restaurant - Three-unit building with separate electric meters, first-floor restaurant, and two second-floor offices; delivered vacant.
Where is this conventional restaurant located?
The property is located at 410 Utica Ave Brooklyn, NY.
What are key features of this property?
This property features: Turnkey 3‑unit building with a restaurant on the first floor and two separate offices on the second floor; Three units have separate electric meters; gas and heat are on for Store, Front 1st Floor, and Back 1st Floor; Delivered vacant; ready for new owner‑occupant or tenant




