Mixed-Use Investment with
For Sale
$1,580,000
Pending
410-412 N Wantagh Avenue, Bethpage, NY 11714
Residential Income, Bethpage, NY
Property Size4,900 SF
Days on Market141
Property Features for 410-412 N Wantagh Avenue
General Information
Property type
Residential Multi Family
Property subtype
Duplex
Bedrooms
4
Bathrooms
3
Full bathrooms
3
Rooms
Bathroom 2, Bedroom 4, Bedroom 3, Bedroom 2, Bathroom 3, Bedroom 1, Bathroom 1
Parking features
Parking Lot
Elementary school
Contact Agent
Middle school
Island Trees Middle School
High school
Island Trees High School
Elementary school district
Contact Agent
Middle school district
Island Trees
High school district
Island Trees
Standard status
Pending
APN
46-M-239
Taxes and HOA fees
Tax Year
2026
Tax Annual Amount
32685
Utilities
Utilities
Water Available
Sewer type
Public Sewer
Heating system
Natural Gas
Cooling system
Central Air
Water source
Public
Building Details
Year built
1949
Number of units
2
Listing Agency:
Prospes Real Estate Corp
(718) 321-2800
Listed By:
Shuang Ye Xia
(917) 369-0987
Added: Jun 3
Changed: Oct 20
Last Checked: Oct 21 at 8:06AM
MLS# 1008571
Copyright © 2026 OneKey MLS. All rights reserved. All information provided by the listing agent/broker is deemed reliable but is not guaranteed and should be independently verified.

Ask AI about this property
Review the available facts, identify missing information and prepare questions for the agent.
Investment Insights
Based on property information with market context.
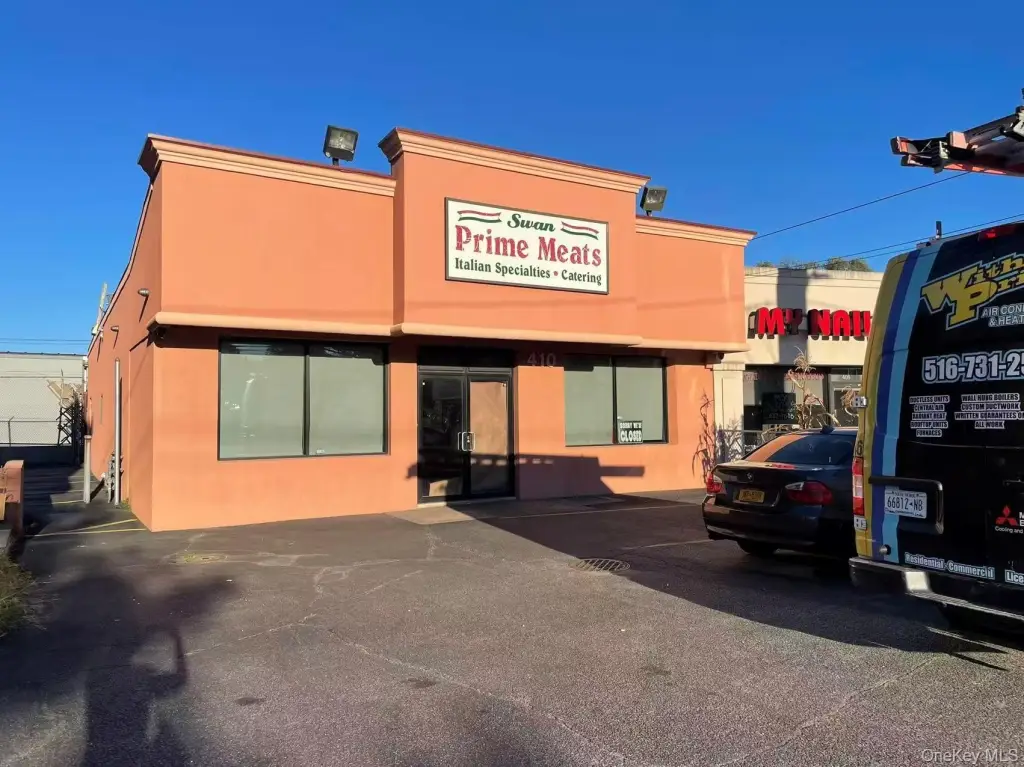
This mixed-use, two-building package includes a commercial restaurant building and a separate one-family residential building. The restaurant building is presented with prominent signage and strong exposure along a busy commercial corridor. The residential building is configured as a spacious one-family property, positioned to support rental income. The listing notes the property can be delivered vacant at closing.
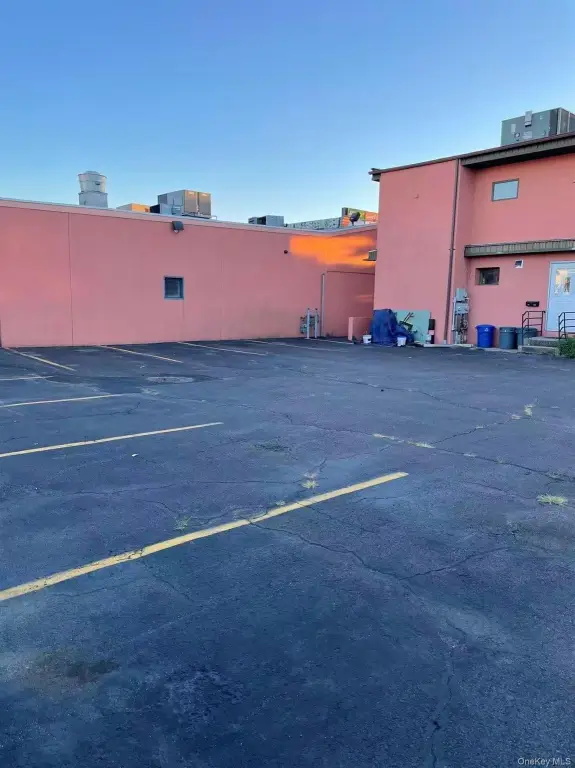
The buildings are located at 410–412 N Wantagh Avenue in Bethpage, Nassau County, with mature surrounding businesses and heavy pedestrian and vehicle exposure described in the remarks. A large private parking lot accommodates approximately 18 vehicles, providing convenience for customers and residents. The listing also cites flexible commercial usage possibilities, including restaurant, deli, beauty salon, nail salon, tutoring center, office, medical use, retail, and more.
Combined interior space for the two buildings is described as approximately 4,900 square feet, with the restaurant portion and residential portion separately described in the listing.
The buildings are located at 410–412 N Wantagh Avenue in Bethpage, Nassau County, with mature surrounding businesses and heavy pedestrian and vehicle exposure described in the remarks. A large private parking lot accommodates approximately 18 vehicles, providing convenience for customers and residents. The listing also cites flexible commercial usage possibilities, including restaurant, deli, beauty salon, nail salon, tutoring center, office, medical use, retail, and more.
Combined interior space for the two buildings is described as approximately 4,900 square feet, with the restaurant portion and residential portion separately described in the listing.
Key Highlights
- Two‑building mixed‑use package with approximately 4,900 Sqft combined interior space
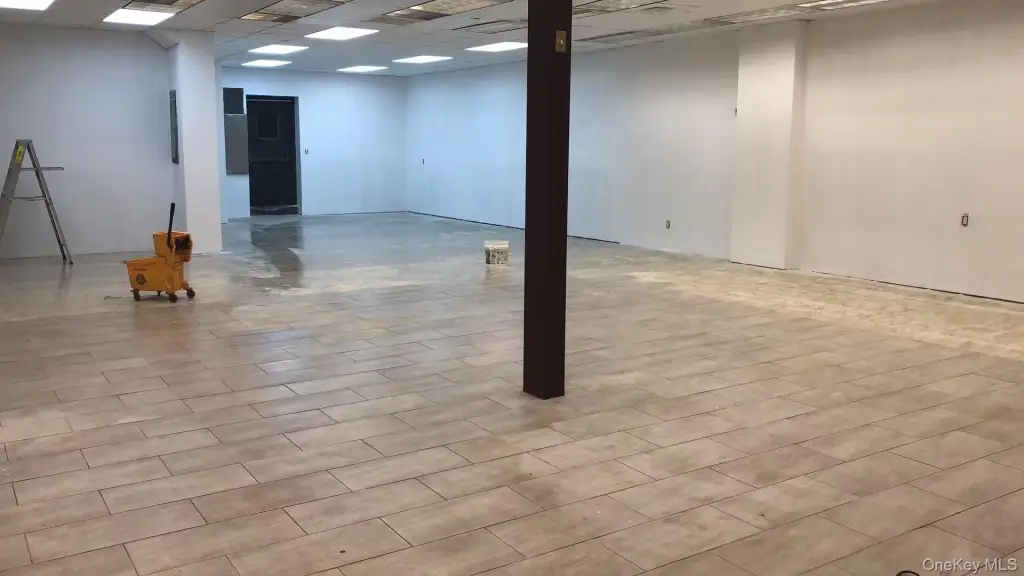
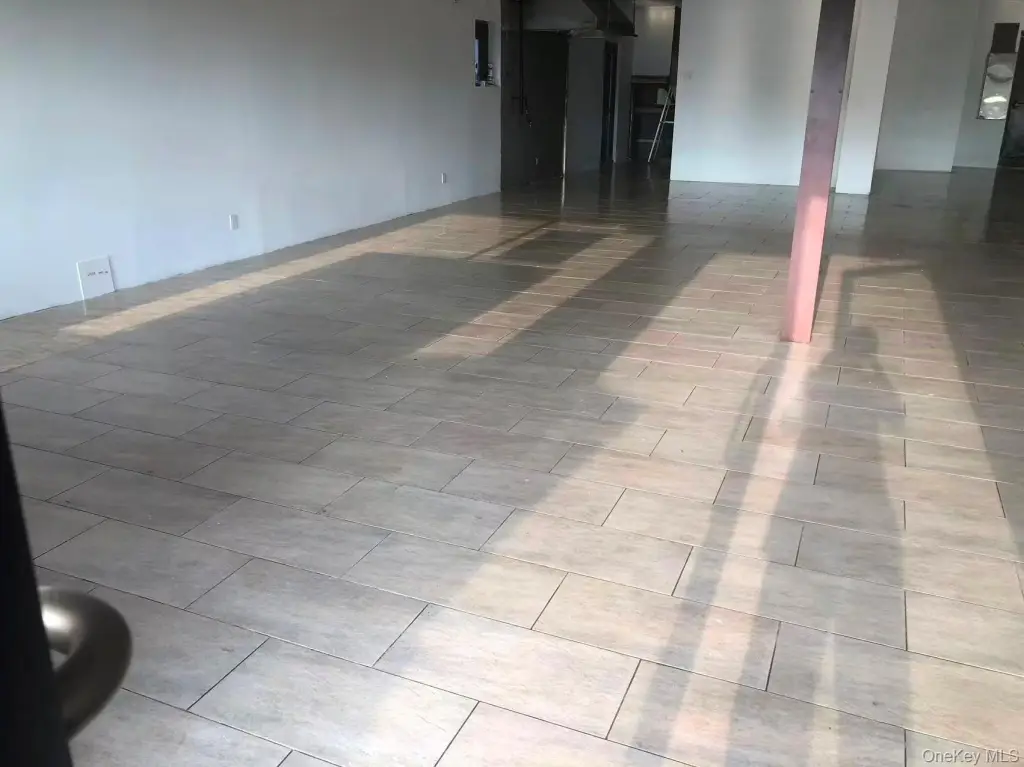
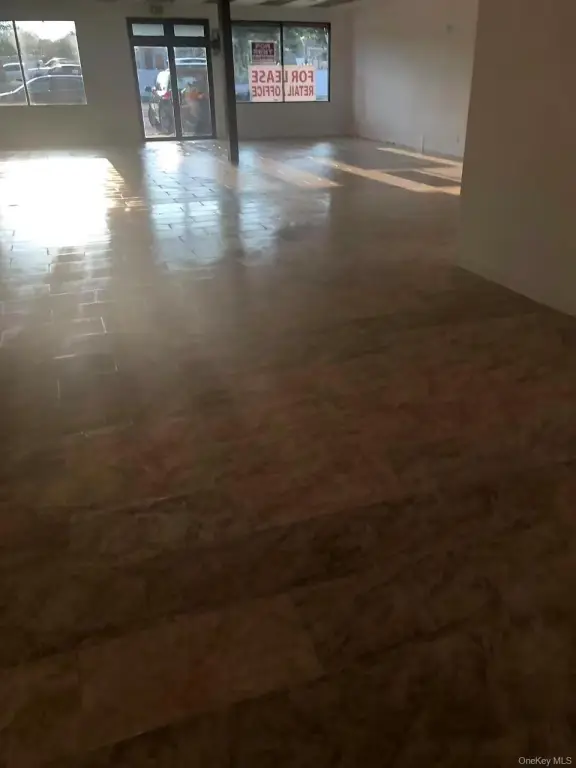
- Commercial restaurant building includes approximately 2,500 Sqft with prominent signage on a busy commercial corridor
- Residential 1‑family building offers approximately 2,400 Sqft and includes multiple bedrooms and bathrooms
Financial Insights
Estimated NOI and Cap Rate
NOI / Yr
$87,404
Cap Rate
5.53%
Suggested Prices Based on Cap Rates
Cap Rate 5%
$1,748,080
$1.7M
Cap Rate 7%
$1,248,629
$1.2M
Cap Rate 9%
$971,156
$971.2K
Market Conditions
NOI Build-Up for 4,900 SF
Gross rent
$166.4K $33.96/SF
− Vacancy
−$7.5K −$1.53/SF
EGI
$158.9K $32.43/SF
− OpEx
−$71.5K −$14.59/SF
NOI
$87.4K $17.84/SF
Area
Nassau County, NY
Vacancy
4.50%
Lease Rate
$33.96 /SF/Yr
Expense Ratio
45.00%
Simulate Cap Rate and NOI
Suggested Prices Based on Cap Rates
Cap Rate 5%
$1,748,080
Cap Rate 7%
$1,248,629
Cap Rate 9%
$971,156
Alternative Uses
Best Use
Specialty Retail
$3.24M
$2.83M – $3.78M
NOI $226,784 @ 7.0% cap · market cap 14.35%
Second Best
Apartment 5plus
$1.25M
$1.09M – $1.46M
NOI $87,404 @ 7.0% cap · market cap 5.53%
Theoretical Best
—
—
same as Best Use
Zoning and permitted uses should be independently verified with authorities.
How Realmo checks its estimates
Property Analytics
Unlock full access to Insights
Subscribe to Realmo Intelligence
Open Analytics
Current Use
Lease Details
1
Residential units
Location Intelligence
Trade Area within ½ mile
603
Businesses Nearby
15k
Monthly Visits Nearby
Explore this area
Business Placement
Foot Traffic Nearby
Dining 51%
Shops & Services 49%
BP
Shops & Services
7,109 visits/mo
0.1 miles
Dunkin' Donuts
Dining
4,140 visits/mo
0.3 miles
Carvel Ice Cream
Dining
1,606 visits/mo
0.1 miles
Domino's Pizza
Dining
1,159 visits/mo
0.0 miles
SUBWAY
Dining
885 visits/mo
0.1 miles
Demographics for 11714, NY
22,989
Population
7,925
Households
2.9
Avg Household Size
45
Median Age
41%
College-Educated
94%
High-School Grad
4.2 sq mi
ZIP Area
5,474
Density / Sq Mi
$123,679
Median Household Income
$61,499
Median Earnings
$2,211
Median Rent
$586,400
Median Home Value
Check the figures for this property
Cap Rate, Value Estimation, Potential NOI and more
View Realmo Analytics
Market
Vacancy Rate% for Retail in Northeast region


Frequently Asked Questions
What type of property is this?
Mixed-use property - Two-building package in Bethpage with a restaurant building, one-family residence, and private parking for about 18 vehicles.
Where is this mixed-use property located?
The property is located at 410-412 N Wantagh Avenue Bethpage, NY.
What is the asking price?
The asking price for this property is $1,580,000.
What are key features of this property?
This property features: Two‑building mixed‑use package with approximately 4,900 Sqft combined interior space; Commercial restaurant building includes approximately 2,500 Sqft with prominent signage on a busy commercial corridor; Residential 1‑family building offers approximately 2,400 Sqft and includes multiple bedrooms and bathrooms


