Multi-Building Restaurant and Bar
For Sale
$459,900
409 411 & 413 Main St, Johnstown, PA 15901
Three connected Main Street buildings include restaurant and bar spaces, plus an outdoor courtyard dining area.
Property Size5,019 SF
Price / SF$91.63
Days on Market141
Property Features for 409 411 & 413 Main St
General Information
Standard status
Active
Size
5,019 SF
Taxes and HOA fees
Annual Taxes
$11,454
Amenities
courtyard
outdoor dining space
elevator
caterer's garage
Building Details
Construction
brick
Listing Agency:
RE/MAX TEAM, REALTORS
Listed By:
Bob & Bobby Colvin
(814) 262-7653
Source:
Exprealty
Added: Jun 5
Changed: Oct 16
Last Checked: Oct 20 at 10:55PM
Displayed information is deemed reliable but is not guaranteed and should be independently verified. All listing content including descriptions, pricing, images are the copyrighted material of RE/MAX TEAM, REALTORS

Ask AI about this property
Review the available facts, identify missing information and prepare questions for the agent.
Investment Insights
Based on property information with market context.
This for-sale property includes multiple commercial buildings and an adjoining lot that were most recently used as a restaurant/bar and outdoor courtyard/dining space. 409 Main Street is described as a concrete patio courtyard with decorative fencing along the front of the property. The rear portion of the lot includes a caterer’s garage complete with an elevator that services the 411 Main Street structure.
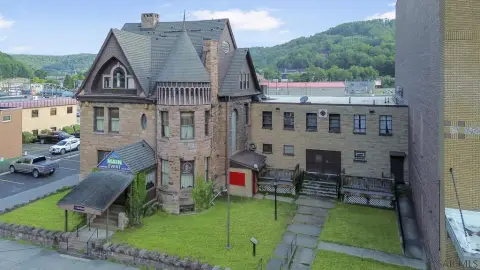
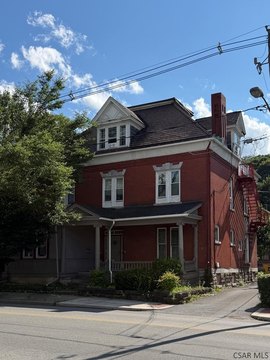
411 Main Street is a three-story brick building with an approximately 2,720 SF finished first-floor area. The first floor has been used as a hostess station, restrooms, business office, and a commercial kitchen serving the courtyard. The second and third stories are unfinished and could be expanded.
413 Main Street is an adjoining two-story brick building with approximately 2,299 SF on the main floor, including bar area and dining space. The second floor is unfinished.
The property is presented as a highly visible center-city location.
411 Main Street is a three-story brick building with an approximately 2,720 SF finished first-floor area. The first floor has been used as a hostess station, restrooms, business office, and a commercial kitchen serving the courtyard. The second and third stories are unfinished and could be expanded.
413 Main Street is an adjoining two-story brick building with approximately 2,299 SF on the main floor, including bar area and dining space. The second floor is unfinished.
The property is presented as a highly visible center-city location.
Key Highlights
- Highly visible center‑city Main Street property with three connected buildings: 409, 411, and 413 Main Street
- 409 Main Street features a concrete patio courtyard with decorative fencing along the front
- 411 Main Street has an approximate 2,720 SF finished 1st floor with hostess station, restrooms, business office, and commercial kitchen
Financial Insights
Estimated NOI and Cap Rate
NOI / Yr
$29,285
Cap Rate
6.37%
Suggested Prices Based on Cap Rates
Cap Rate 5%
$585,700
$585.7K
Cap Rate 7%
$418,357
$418.4K
Cap Rate 9%
$325,389
$325.4K
Market Conditions
NOI Build-Up for 5,019 SF
Gross rent
$44.3K $8.83/SF
− Vacancy
−$2.5K −$0.49/SF
EGI
$41.8K $8.34/SF
− OpEx
−$12.6K −$2.50/SF
NOI
$29.3K $5.83/SF
Area
Cambria County, PA
Vacancy
5.60%
Lease Rate
$8.83 /SF/Yr
Expense Ratio
30.00%
Simulate Cap Rate and NOI
Suggested Prices Based on Cap Rates
Cap Rate 5%
$585,700
Cap Rate 7%
$418,357
Cap Rate 9%
$325,389
Alternative Uses
Best Use
Specialty Retail
$721.9K
$631.7K – $842.3K
NOI $50,535 @ 7.0% cap · market cap 10.99%
Second Best
Industrial
$418.4K
$366.1K – $488.1K
NOI $29,285 @ 7.0% cap · market cap 6.37%
Theoretical Best
Office A
$1.51M
$1.33M – $1.77M
NOI $106,001 @ 7.0% cap · market cap 23.05%
Zoning and permitted uses should be independently verified with authorities.
How Realmo checks its estimates
Property Analytics
Who owns this building?
See the owner, sales and loan history
Open Analytics
Current Use
Location Intelligence
Trade Area within ½ mile
83
Businesses Nearby
6k
Monthly Visits Nearby
Explore this area
Business Placement
Foot Traffic Nearby
Shops & Services 91%
Dining 9%
Dollar General
Shops & Services
5,677 visits/mo
0.3 miles
Fox's Pizza Den
Dining
577 visits/mo
0.2 miles
Demographics for 15901, PA
3,379
Population
2,629
Households
1.3
Avg Household Size
50
Median Age
12%
College-Educated
88%
High-School Grad
1.5 sq mi
ZIP Area
2,253
Density / Sq Mi
$27,946
Median Household Income
$27,258
Median Earnings
$476
Median Rent
$19,200
Median Home Value
Check the figures for this property
Cap Rate, Value Estimation, Potential NOI and more
View Realmo Analytics
Market
Vacancy Rate% for Retail in Northeast region





Frequently Asked Questions
What type of property is this?
Commercial kitchen - Three connected Main Street buildings include restaurant and bar spaces, plus an outdoor courtyard dining area.
Where is this commercial kitchen located?
The property is located at 409 411 & 413 Main St Johnstown, PA.
What is the asking price?
The asking price for this property is $459,900.
What are key features of this property?
This property features: Highly visible center‑city Main Street property with three connected buildings: 409, 411, and 413 Main Street; 409 Main Street features a concrete patio courtyard with decorative fencing along the front; 411 Main Street has an approximate 2,720 SF finished 1st floor with hostess station, restrooms, business office, and commercial kitchen


