15-Key Boutique
For Sale
Contact for pricing
405 Palm Canyon Drive, Borrego Springs, CA 92004
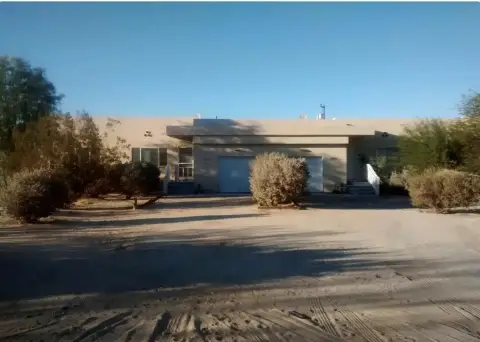
Adults-oriented lodging with private patios, pools, spas, and landscaped outdoor areas in a designated dark-sky community.
Property Size7,501 SF
Price / SF$333.29
Days on Market170
Property Features for 405 Palm Canyon Drive
General Information
Standard status
Active
Size
7,501 SF
Property subtype
Hospitality
Zoning
C-6
Amenities
private patios
resort-style pools and spas
landscaped outdoor spaces
Building Details
Year Built
1998
Units
14
Listing Agency:
Hershler Hospitality
Listed By:
Jared Hershler · License #020019478
Source:
Crexi
Added: Apr 30
Changed: Oct 9
Last Checked: Oct 14 at 8:56PM
Displayed information is deemed reliable but is not guaranteed and should be independently verified. All listing content including descriptions, pricing, images are the copyrighted material of Hershler Hospitality

Ask AI about this property
Review the available facts, identify missing information and prepare questions for the agent.
Investment Insights
Based on property information with market context.
Borrego Valley Inn is a 15-key hospitality property with guestrooms designed for an adults-oriented stay. The improvements include private patios, resort-style pools and spas, and landscaped outdoor areas. Built in 1998, the property carries C-6 zoning and encompasses 7,501 square feet.
The inn is located at 405 Palm Canyon Drive in Borrego Springs, California, near Anza-Borrego Desert State Park. The surrounding destination supports leisure travel associated with hiking, cycling, seasonal tourism, and stargazing within a designated dark-sky community. The property is positioned for boutique hospitality operations in a drive-to Southern California leisure market.
The inn is located at 405 Palm Canyon Drive in Borrego Springs, California, near Anza-Borrego Desert State Park. The surrounding destination supports leisure travel associated with hiking, cycling, seasonal tourism, and stargazing within a designated dark-sky community. The property is positioned for boutique hospitality operations in a drive-to Southern California leisure market.
Key Highlights
- 15‑key boutique hospitality property in Borrego Springs, California
- Private patios accompany the guestrooms
- Resort‑style pools and spas with landscaped outdoor areas
Financial Insights
Estimated NOI and Cap Rate
NOI / Yr
$123,116
Cap Rate
4.92%
Suggested Prices Based on Cap Rates
Cap Rate 5%
$2,462,320
$2.5M
Cap Rate 7%
$1,758,800
$1.8M
Cap Rate 9%
$1,367,956
$1.4M
Market Conditions
NOI Build-Up for 7,501 SF
Gross rent
$302.4K $40.32/SF
− Vacancy
−$43.2K −$5.77/SF
EGI
$259.2K $34.55/SF
− OpEx
−$136.1K −$18.14/SF
NOI
$123.1K $16.41/SF
Area
San Diego County, CA
Vacancy
14.30%
Lease Rate
$40.32 /SF/Yr
Expense Ratio
52.50%
Simulate Cap Rate and NOI
Suggested Prices Based on Cap Rates
Cap Rate 5%
$2,462,320
Cap Rate 7%
$1,758,800
Cap Rate 9%
$1,367,956
Alternative Uses
Best Use
Hotel Hospitality
$1.76M
$1.54M – $2.05M
NOI $123,116 @ 7.0% cap · market cap 4.92%
Second Best
—
—
no second resolved use
Theoretical Best
Office A
$3.44M
$3.01M – $4.01M
NOI $240,570 @ 7.0% cap · market cap 9.62%
Zoning and permitted uses should be independently verified with authorities.
How Realmo checks its estimates
Property Analytics
Unlock full access to Insights
Subscribe to Realmo Intelligence
Open Analytics
Current Use
Location Intelligence
Trade Area within ½ mile
122
Businesses Nearby
Explore this area
Business Placement
Demographics for 92004, CA
3,414
Population
2,917
Households
1.2
Avg Household Size
60
Median Age
29%
College-Educated
90%
High-School Grad
914.9 sq mi
ZIP Area
4
Density / Sq Mi
$71,582
Median Household Income
$42,721
Median Earnings
$380,900
Median Home Value
Check the figures for this property
Cap Rate, Value Estimation, Potential NOI and more
View Realmo Analytics



Frequently Asked Questions
What type of property is this?
Hotel - Adults-oriented lodging with private patios, pools, spas, and landscaped outdoor areas in a designated dark-sky community.
Where is this hotel located?
The property is located at 405 Palm Canyon Drive Borrego Springs, CA.
What is the asking price?
The asking price for this property is $2,500,000.
What are key features of this property?
This property features: 15‑key boutique hospitality property in Borrego Springs, California; Private patios accompany the guestrooms; Resort‑style pools and spas with landscaped outdoor areas


