Multifamily Townhome
For Sale
$600,000
4044 W Ski Jump Ln, Meridian, ID 83642
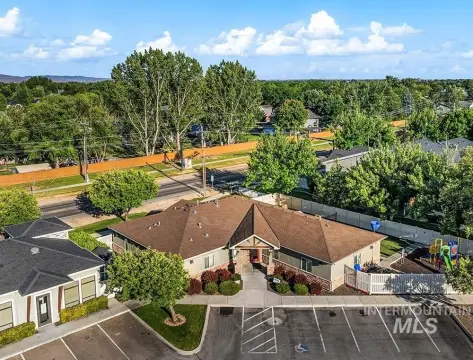
Townhomes in Entrata Farms with access to a pool, playground, dog park, green spaces, and walking paths.
Property Size3,556 SF
Price / SF$168.73
Days on Market56
Property Features for 4044 W Ski Jump Ln
General Information
Standard status
Active
Size
3,556 SF
Property subtype
Multi-Family
Additional Details
Highway Access
Yes
Amenities
playground
pool
dog park
green spaces
walking paths
Building Details
Year Built
2021
Listing Agency:
Silvercreek Realty Group
Listed By:
Pedro Resendez · License #SP55961
(208) 377-0422
Source:
Adventureidahorealestate
Added: Aug 21
Changed: Oct 6
Last Checked: Oct 7 at 2:26PM
Displayed information is deemed reliable but is not guaranteed and should be independently verified. All listing content including descriptions, pricing, images are the copyrighted material of Silvercreek Realty Group
Investment Insights
Based on property information with market context.
This multifamily townhome property in the Entrata Farms community includes 3,556 square feet and was built in 2021. The offering supports both rental ownership and owner occupancy with tenants, as described in the property information.
The community is in Meridian, minutes from I-84, with banks, restaurants, entertainment, and outdoor activities within walking distance. Residents have access to shared amenities that include a large playground, swimming pool, dog park, green areas, and maintained walking paths.
The community is in Meridian, minutes from I-84, with banks, restaurants, entertainment, and outdoor activities within walking distance. Residents have access to shared amenities that include a large playground, swimming pool, dog park, green areas, and maintained walking paths.
Key Highlights
- 3,556‑square‑foot multifamily townhome property
- Built in 2021
- Located in Entrata Farms in Meridian
Financial Insights
Estimated NOI and Cap Rate
NOI / Yr
$35,673
Cap Rate
5.95%
Suggested Prices Based on Cap Rates
Cap Rate 5%
$713,460
$713.5K
Cap Rate 7%
$509,614
$509.6K
Cap Rate 9%
$396,367
$396.4K
Market Conditions
NOI Build-Up for 3,556 SF
Gross rent
$67.4K $18.96/SF
− Vacancy
−$2.6K −$0.72/SF
EGI
$64.9K $18.24/SF
− OpEx
−$29.2K −$8.21/SF
NOI
$35.7K $10.03/SF
Area
Meridian, ID
Vacancy
3.80%
Lease Rate
$18.96 /SF/Yr
Expense Ratio
45.00%
Simulate Cap Rate and NOI
Suggested Prices Based on Cap Rates
Cap Rate 5%
$713,460
Cap Rate 7%
$509,614
Cap Rate 9%
$396,367
Alternative Uses
Best Use
Apartment 5plus
$509.6K
$445.9K – $594.6K
NOI $35,673 @ 7.0% cap · market cap 5.95%
Second Best
—
—
no second resolved use
Theoretical Best
Office A
$938.4K
$821.1K – $1.09M
NOI $65,689 @ 7.0% cap · market cap 10.95%
Zoning and permitted uses should be independently verified with authorities.
How Realmo checks its estimates
Property Analytics
Unlock full access to Insights
Subscribe to Realmo Intelligence
Open Analytics
Current Use
Lease Details
Yes
Highway access
Location Intelligence
Trade Area within ½ mile
341
Businesses Nearby
Explore this area
Business Placement
Demographics for 83642, ID
55,465
Population
22,700
Households
2.4
Avg Household Size
35
Median Age
44%
College-Educated
95%
High-School Grad
41.5 sq mi
ZIP Area
1,337
Density / Sq Mi
$96,361
Median Household Income
$45,824
Median Earnings
$1,629
Median Rent
$492,300
Median Home Value
Check the figures for this property
Cap Rate, Value Estimation, Potential NOI and more
View Realmo Analytics
Market
Vacancy Rate% for Multifamily in West region

Questions? Ask Rey
Realmo’s AI knows this listing — price, zoning, demand, history. Ask anything.







Frequently Asked Questions
What type of property is this?
Multifamily property - Townhomes in Entrata Farms with access to a pool, playground, dog park, green spaces, and walking paths.
Where is this multifamily property located?
The property is located at 4044 W Ski Jump Ln Meridian, ID.
What is the asking price?
The asking price for this property is $600,000.
What are key features of this property?
This property features: 3,556‑square‑foot multifamily townhome property; Built in 2021; Located in Entrata Farms in Meridian


